AR
TICLE
Consumption of dietary intake markers by patients with diabetes
assessed using a mobile application
Abstract The aim of this study was to assess the consumption of dietary intake markers in pa-tients with diabetes using a mobile application. A cross-sectional study was conducted with 100 younger and older adult type 2 diabetes patients in treatment in a hospital in the State of Rio Grande do Sul, Brazil. Data was collected using the Dia-betes Food Control app. The chi-squared test was used to measure the association between adequate consumption of healthy and unhealthy markers and the variables investigated by the study adopt-ing a 5% significance level. The findadopt-ings revealed that a high percentage of the respondents were overweight and/or obese and showed inadequate glycemic control. The prevalence of adequate consumption of both healthy and unhealthy diet markers was greatest for the following food groups: fried foods (82%), milk or yogurt (71%), fresh fruit (70%), beans and sugary drinks (68% each item), cookies and sweets (57%), and raw salad (56%). Adequate consumption of unhealthy diet markers was greatest in patients with a family in-come of less than four minimum salaries, followed by those who did not have high blood pressure. The frequency of consumption of markers was consid-ered adequate for the majority of patients; how-ever, nutritional monitoring is required to correct high blood glucose and HbA1c levels.
Key words Diabetes Mellitus, Dietary intake, Diet
Maria Cristina Zanchim 1
Vanessa Ramos Kirsten 2
Ana Carolina Bertoletti De Marchi 1
1 Programa de Pós-Graduação em
Envelhecimento Humano, Universidade de Passo Fundo. BR 285, São José, 99052-900 Passo Fundo RS Brasil.
Z
anc
him MC
Introduction
Healthy eating is one of the main pillars of the treatment and management of diabetes mellitus (DM). Dividing meals into appropriate portion sizes, eating natural foods, like fruit and vegeta-bles, wholegrain cereals, and pulses, and reducing fat, sodium, and sugar intake help to control di-abetes, maintain adequate nutritional status, and prevent complications caused by the disease1.
Nutrition is a prominent global health issue. A number of studies in Brazil have confirmed that changes in people’s eating habits over the years, marked by a fall in the consumption of tra-ditional staples such as rice and beans and rise in the consumption of processed and ultra-pro-cessed foods such as sugary drinks, instant noo-dles, and cookies, have hugely contributed to the impoverishment of our diet and the increased prevalence of chronic diseases, notably Type 2 DM2-4.
Within this context, various methods have been used to assess dietary intake in order to pro-vide valid and reliable data, with a view to deter-mining the association between dietary exposure and health status. Food frequency question-naires, which indicate habitual food intake, are widely used to measure the association between the qualitative characteristics of diet and the in-cidence of chronic diseases5,6.
However, in recent years researchers have tended to simplify dietary assessment tools. Short assessment instruments are being devel-oped to reduce administration time, facilitate understanding, and enable the identification of groups at risk of inadequate food intake7,8.
In this respect, the Brazilian Ministry of Health has developed paper-based and electron-ic care protocols that are used by primary care health professionals to assess the dietary habits and nutritional status of patients. One of these protocols is a simplified food frequency ques-tionnaire designed to identify inadequacies in dietary intake and, in particular, provide the basis for guidance on developing healthy eating habits9.
As an alternative to traditional methods, the automation of dietary assessment questionnaires to an electronic format has shown itself to be a promising tool for optimizing the assessment process10. Factors such as streamlined access,
24-hour availability, swift processing, low cost, and easy return make electronic questionnaires a practical tool that can be used hospitals, clin-ics, and outpatient departments, especially when
accessed via mobile devices11. Thus, given that
di-etary habits are an essential element of successful DM control and prevention, the aim of the pres-ent study was to assess dietary intake markers in diabetes patients using a mobile application.
Methods
A cross-sectional study was conducted with a sample made up of younger and older adult type 2 DM patients in treatment in a hospital in a city in the State of Rio Grande do Sul, Brazil during the period August to November, 2015.
Sample size was calculated based on a mar-gin of error of 5% and 95% confidence interval, the number of patients treated in the hospital in the last year (31,680), and the diabetes prev-alence rate for 2012 published in the DATASUS (11.7%)12, resulting in 158 patients. However, it
was only possible to reach a sample of 100 pa-tients during the study period.
The inclusion criteria were as follows: aged 18 years or over; diagnosed with type 2 DM; gly-cated hemoglobin (HbA1c) levels reported in the patient’s medical records; being conscious and able to communicate verbally. The follow-ing individuals were excluded: women who were pregnant or breast feeding; patients admitted for more than 72 hours; patients undergoing exclu-sive enteral or parenteral nutritional therapy; patients admitted to the intensive care unit, re-covery or emergency units; amputees or patients with a limb in a plaster cast; patients with edema or ascites; illiterate patients; and patients in pal-liative care.
Diabetes Food Control App
Data was collected using the Diabetes Food Control app13 run on a tablet. The app consists
of a seven-step electronic questionnaire com-prising the following domains: personal details; biochemical assessment; anthropometric mea-surements; sociodemographic and economic data; medical and nutritional history; lifestyle; and diet.
Procedure
aúd
e C
ole
tiv
a,
23(12):4199-4208,
2018
admission, sex, age, and fasting blood glucose and HbA1c levels, was obtained from the pa-tient’s medical records.
Glycemic control was assessed based on the normal blood glucose threshold set by the Amer-ican Diabetes Association14.
Body weight was measured in accordance with Food and Nutrition Surveillance System
(SISVAN) recommendations15. For bedridden
patients and those unable to stand upright, mea-surements were estimated with the app based on equations proposed by Lee and Nieman16 and
Chumlea et al.17. Knee height (KH) and Arm
Circumference (AC) were measured (CB) using methods described by Lee and Nieman16. These
measurements were used to calculate Body Mass Index (BMI) and nutritional status according to the classification proposed by the World Health Organization (WHO)18.
Waist circumference (WC) was measured using a tape measure following the method pro-posed by SISVAN15. After recording the
measure-ment in the app, the risk of metabolic compli-cations associated with obesity was estimated according to the classification proposed by the WHO18.
During the next step, sociodemographic and economic data was collected, including years of schooling, marital status, place of residence, and family income.
The following items were assessed in rela-tion to medical and nutrirela-tional history: length of time since diagnosis, whether the patient suffers from high blood pressure (HBP)/dyslipidemia, nutritional monitoring and guidance, as well as information about lifestyle related to smoking, alcohol consumption, and physical activity.
Dietary intake was assessed using the simpli-fied food markers frequency questionnaire, a 10-item instrument proposed by SISVAN9 that
ex-plores the frequency of consumption of healthy and unhealthy foods over the seven days prior to the interview. The recommendations of the Dietary Guidelines for the Brazilian Population (Dietary Guidelines para População Brasileira)19
were used assess the consumption adequacy of the foods listed in the instrument. Adequate con-sumption was regarded as: the daily consump-tion of foods that are healthy diet markers (such as raw salad, pulses and cooked vegetables, fresh fruit and fruit salad, milk or yogurt) and the con-sumption of beans at least five times a week; the consumption of unhealthy diet markers (such as fried food, hamburgers and processed meat products, savory biscuits or packaged snacks,
cookies or sweets and sugary drinks) no more than once a week.
After completing the dietary intake question-naire, the app provided feedback to the patient regarding his performance in meeting each of the recommendations set out by the Dietary Guide-lines.
Statistical analysis
The data was sent by email in a CSV file and then saved in an Excel spreadsheet. Data analysis was performed using the statistical software SSPS version 18.0. The chi-squared test was used to measure the association between adequate con-sumption of healthy and unhealthy diet markers and variables investigated by the study adopting a 5% significance level.
Ethical aspects
The study was conducted in accordance with Resolution 466/2012 and was approved by the hospital’s Research and Postgraduate Committee and by the Ethics Committee. All participants received information about the study objectives and research procedures and signed an informed consent form.
Results
A total of 100 patients diagnosed with type 2 DM were assessed, 57% of whom had been ad-mitted to hospital for heart treatment (data not shown). Table 1 shows the main characteristics of the patients. The majority of the sample were male (51%) and 83% were elderly. Average age was 67.14 ± 8.78 years. Almost half the sample had up to four years of schooling (47%) and 60% were married. The majority of the participants lived in urban areas (83%) and 71% had a family income of less than four minimum salaries (MS).
The average length of time since diagnosis was 9.5 years, ranging between 0.6 and 40 years (data not shown). The prevalence of HBP and dyslipid-emia among the sample was 75% and 36%, respec-tively. With respect to diet, 72% reported that they had received nutritional guidance. Of this group, 42% cited that the source of this guidance was a doctor. Eighty-two percent of the participants were not undergoing nutritional monitoring.
Z
anc
him MC
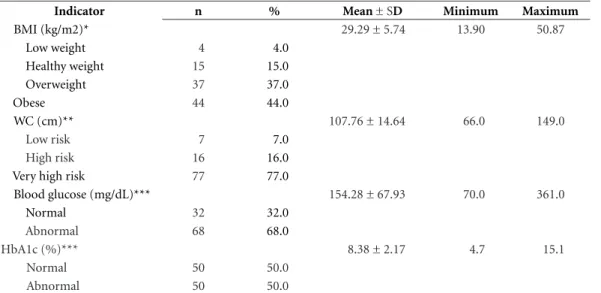
With respect to nutritional status, 37% of the respondents were overweight and 44% were obese. With regard to CC, 77% of the partici-pants were at a high risk of developing metabolic complications associated with obesity. Average HbA1c and fasting blood glucose levels were 8.38 ± 2.17% and 154.28 ± 67.93mg/dL, respectively, indicating unsatisfactory glycemic control based on these markers in 50% and 68% of the patients, respectively (Table 2).
With regard to healthy diet markers, over half of patients reported that they consumed milk or yogurt, fresh fruit, and raw salad on a daily basis (71%, 70%, and 56%, respectively), while 68% ate beans at least five times a week. The least consumed healthy diet markers were pulses and cooked vegetables (22.0%). The frequency of consumption of unhealthy diet markers (savory biscuits, hamburgers and processed meat prod-ucts, cookies and sweets, sugary drinks and fried food) was above the ideal in 67%, 53%, 43%, 32%, and 18% of respondents, respectively (Ta-ble 3).
The analysis of the association between ade-quate consumption of healthy diet markers and unhealthy diet markers and sociodemographic and economic variables showed that adequate consumption of fruit was greatest in females and that adequate consumption of cookies and sweets was greatest among patients whose family income was less than four MSs. No significant as-sociation was found between the other variables, as shown in Table 4.
The analysis of the association between ade-quate consumption of healthy and unhealthy diet markers and the variables in the domains medical and nutritional history, lifestyle, and biochemical assessment showed that adequate consumption of sugary drinks was greatest in patients who did not have HBP, while adequate consumption of milk or yogurt was greatest in individuals who were not overweight. No significant association was found between the other variables, as shown in Table 5.
Discussion
The lifestyle profile of the participants of the present study was similar to that found in studies conducted with diabetes patients in the south of the country20,21. The findings in relation to
smok-ing cessation among the study participants are particularly interesting, because they show that this facet of self-care is being incorporated into Table 1. Main characteristics of the study sample. Passo
Fundo, Brazil 2015 (n = 100).
Characteristic n % Mean ± SD Sex
Male 51 51.0
Female 49 49.0
Age (years) 67.14 ± 8.78
< 60 17 17.0
≥ 60 83 83.0
Years of schooling 6.07 ± 4.88
≤ 4 47 47.0
5-8 32 32.0
≥ 9 21 21.0
Marital status
Single 6 6.0
Married 60 60.0
Divorced 5 5.0
Widow 29 29.0
Place of residence
Urban area 83 83.0
Rural area 17 17.0
Family income (MS)
< 2 33 33.0
2-3 38 38.0
4-9 26 26.0
≥ 10 3 3.0
Self-reported HBP
Yes 75 75.0
No 25 25.0
Self-reported dyslipidemia
Yes 36 36.0
No 64 64.0
Nutritional guidance for DM
Yes 72 72.0
No 28 28.0
Professional who provided guidance
Doctor 42 58.3
Nutritionist 29 40.3
Other 1 1.4
Nutritional monitoring
Yes 18 18.0
No 82 82.0
Smoker
Never smoked 43 43.0
Ex-smoker 57 57.0
Alcohol consumption
Never 73 73.0
< 1 unit a ,month 12 12.0 1-3 units per week 12 12.0 4-7 units per week 3 3.0 Physical activity
Yes 23 23.0
No 77 77.0
aúd
e C
ole
tiv
a,
23(12):4199-4208,
2018
Table 2. Nutritional status, metabolic risk and glycemic control. Passo Fundo, Brazil, 2015 (n = 100).
Indicator n % Mean ± SD Minimum Maximum
BMI (kg/m2)* 29.29 ± 5.74 13.90 50.87
Low weight 4 4.0
Healthy weight 15 15.0
Overweight 37 37.0
Obese 44 44.0
WC (cm)** 107.76 ± 14.64 66.0 149.0
Low risk 7 7.0
High risk 16 16.0
Very high risk 77 77.0
Blood glucose (mg/dL)*** 154.28 ± 67.93 70.0 361.0
Normal 32 32.0
Abnormal 68 68.0
HbA1c (%)*** 8.38 ± 2.17 4.7 15.1
Normal 50 50.0
Abnormal 50 50.0
*Estado nutricional segundo IMC. **Risco de complicações metabólicas segundo a CC. ***Controle glicêmico segundo a Glicemia capilar e HbA1c.
the treatment of diabetes. However, physical ac-tivity should be encouraged in this group given its many benefits, including improved nutrition-al status, insulin sensitivity, and glucose toler-ance, which favors glycemic control14.
Despite the fact that overweight and obesity are important predictors of morbidity and mor-tality among both the general population and people who have diabetes, the data regarding BMI reveals that the prevalence of these condi-tions is particularly high among the study par-ticipants (81%). It is important to note, however, that these findings differ from those reported by Lisbôa et al.22. Furthermore, based on the WC
data, the majority of the group (93%) were at high or very high risk of metabolic complications associated with obesity, corroborating the find-ings of Supp23.
The participants did not meet the glycemic control targets set by the Brazilian Diabetes So-ciety. Blood glucose and HbA1c levels were above the recommended levels, which is in line with the findings of Sampaio et al.24 (154.28 ± 67.93mg/dl
and 8.38 ± 2.17% versus 160.5 ± 62.8mg/dl and 8.5 ± 1.90%, respectively). These findings indicate that it is necessary to improve glycemic control among this group, given that chronic hyperglyce-mia triggers a series of long-term complications25.
Table 3. Frequency of consumption of dietary intake makers in the week before the interview. Passo Fundo, Brazil, 2015 (n = 100).
Marker None 1x 2x 3x 4x 5x 6x 7x
% % % % % % % %
Raw salad 6.0 5.0 2.0 12.0 5.0 5.0 9.0 56.0
Pulses and cooked vegetables 7.0 19.0 15.0 17.0 10.0 6.0 4.0 22.0
Fresh fruit 2.0 4.0 2.0 7.0 7.0 5.0 3.0 70.0
Beans 5.0 6.0 9.0 6.0 6.0 17.0 11.0 40.0
Milk or yogurt 17.0 2.0 1.0 2.0 2.0 2.0 3.0 71.0
Fried foods 57.0 25.0 12.0 2.0 - 1.0 - 3.0
Hamburgers and processed meat products 36.0 11.0 8.0 6.0 2.0 3.0 4.0 30.0
Savory biscuits 20.0 13.0 11.0 15.0 7.0 6.0 1.0 27.0
Cookies or sweets 32.0 25.0 19.0 8.0 4.0 3.0 2.0 7.0
Z
anc
him MC
With respect to adequate consumption of healthy diet markers listed in the Dietary Guide-lines, the findings show that frequency of con-sumption was greatest for milk and yogurt, fresh fruit, and beans and raw salad, drawing atten-tion to the low daily consumpatten-tion of pulses and cooked vegetables, foods which are essential parts of a balanced diet. These results contrast with the findings of a study conducted by Tiew et al.26 with
patients in a hospital in Sepang, Malaysia, but are similar to the findings of a study undertaken by Destri27.
In Brazil, VIGITEL data for 20144 reveal that
44.1% of the population eat fruit and vegetables on a regular basis and that only 29.4% of these people eat at least five portions of these foods per day, as recommended by the Dietary Guidelines. However, the VIGITEL also found that a relative-ly large proportion of Brazilians consume beans and milk on a regular basis (63% and 48.8%, re-spectively). These rates are less than those found by the present study for these markers, which can be deemed satisfactory for the patients assessed by this study.
With regard to the consumption of unhealthy diet markers, adequate consumption was greatest for fried foods, sugary drinks, and sweet foods. These findings contrast with those reported by Kobayashi et al.28 and Lima et al.29, who showed
that the diet of participants was inadequate due to the excessive consumption of these markers. Limiting the consumption of sweets and fried foods is the main recommendation given by health professionals to diabetes patients given that there is a direct relation between the con-sumption of these foods and high blood glucose and lipid levels.
Bleich and Wang30 showed that 45% of
re-spondents consumed sugary drinks on a daily basis, while Lima et al.29 reported that 40% of
diabetes patients consumed soft drinks and ar-tificial juice drinks. These results differ from the findings of the present study, which show that only 13% of respondents consumed these items on a daily basis. These differences may be due to the use of different dietary assessment methods. Furthermore, given the number of patients with comorbidities and the high average length time since diagnosis, the group is probably more in-terested in diet and adopting healthy behaviors.
Despite adequate consumption of unhealthy diet markers, it is worth mentioning that the in-take of cookies, sweets, sugary drinks, and fried food is still common among the respondents and that over half of the patients eat savory biscuits
T ab le 4. A d eq uat e c o ns ump tio n o f health
y and unhealth
y die t mar ke rs a cr oss so cio d emo gr ap
hic and e
co no mic v ar iab les. P asso F und o , B razil,
2015 (n = 100).
R
aw salada n (%)
P ulses and c o ok ed ve ge tab les a n (%) F resh fr uita n (%) B eans b n (%) M ilk o r yo gur t a n (%) F rie d f o o ds c n (%) H amb ur ge rs and pr o cesse d me at pr o d ucts c n (%) Sa vo ry biscuits c n (%) C o
okies and sw
ee ts c n (%) S ug ar y dr inks c n (%) S ex
p = 0.687
p = 0.633
p = 0.004
p = 0.393
p = 0.189
p = 0.796
p = 0.316
p = 0.400
p = 0.691
p = 0.136
M ale 30 (58.8) 10 (19.6) 29 (56.9) 37 (72.5) 33 (64.7) 41 (80.4) 21 (41.2) 19 (37.3) 28 (54.9) 31 (60.8) F emale 26 (53.1) 12 (24.5) 41 (83.7) 31 (63.3) 38 (77.6) 41 (83.7) 26 (53.1) 14 (28.6) 29 (59.2) 37 (75.5) A ge (y ear s)
p = 0.795
p = 0.348
p = 0.576
p = 0.401
p = 0.564
p = 0.
296
p = 0.301
p = 0.167
p = 0.595
p = 1.000
< 60 9 (52.9) 2 (11.8) 11 (64.7) 10 (58.8) 11 (64.7) 16 (94.1) 10 (58.8) 3 (17.6) 11 (64.7) 12 (70.6) ≥ 60 47 (56.6) 20 (24.1) 59 (71.1) 58 (69.9) 60 (72.3) 66 (79.5) 37 (44.6) 30 (36.1) 46 (55.4) 56 (67.5) Y ear s o f sc ho oling
p = 0.261
p = 0.866
p = 0.879
p = 0.346
p = 0.885
p = 0.111
p = 0.222
p = 0.974
p = 0.115
p = 0.078
≤ 4 26 (55.3) 10 (21.3) 34 (72.3) 35 (74.5) 34 (72.3) 36 (76.6) 20 (42.6) 15 (31.9) 23 (48.9) 27 (57.4) 5-8 21 (65.6) 8 (25.0) 22 (68.8) 21 (65.6) 23 (71.9) 30 (93.8) 19 (59.4) 11 (34.4) 23 (71.9) 26 (81.3) ≥ 9 9 (42.9) 4 (19.0) 14 (66.7) 12 (57.1) 14 (66.7) 16 (76.2) 8 (38.1) 7 (33.3) 11 (52.4) 15 (71.4) Pla ce o f r esid enc e
p = 0.795
p = 0.757
p = 0.262
p = 1.000
p = 0.771
p = 0.730
p = 0.790
p = 1.000
p = 1.000
p = 0.401
U rban ar ea 47 (56.6) 19 (22.9) 56 (67.5) 56 (67.5) 58 (69.9) 67 (80.7) 40 (48.2) 27 (32.5) 47 (56.6) 58 (69.9) R ur al ar ea 9 (52.9) 3 (17.6) 14 (82.4) 12 (70.6) 13 (76.5) 15 (88.2) 7 (41.2) 6 (35.3) 10 (58.8) 10 (58.8) F amil y inc o me (MS)
p = 0.509
p = 0.793
p = 1.000
p = 0.814
p = 0.472
p = 0.775
p = 0.276
p = 0.349
p = 0.049
p = 0.147
< 4 38 (53.5) 15 (21.1) 50 (70.4) 49 (69.0) 52 (73.2) 59 (83.1) 36 (50.7) 21 (29.6) 45 (63.4) 51 (71.8) ≥ 4 18 (62.1) 7 (24.1) 20 (69.0) 19 (65.5) 19 (65.5) 23 (79.3) 11 (37.9) 12 (41.4) 12 (41.4) 17 (58.6) MS: M inim um S alar y. aDail y c o ns ump tio n. bA
t least fiv
e t
imes a w
eek.
cN
o mo
re than o
nc
e a w
4205
Ciência & S aúde C
oleti va, 23(12):4199-4208, 2018
n (%) vegetablesa
n (%)
n (%) n (%) yogurt
n (%)
foods n (%)
meat
productsc
n (%)
biscuits n (%)
sweets n (%)
drinks n (%)
Self-reported HBP p = 0.650 p = 0.413 p = 0.615 p = 0.458 p = 0.800 p = 0.378 p = 0.819 p = 0.807 p = 0.818 p = 0.052
Yes 43 (57.3) 15 (20.0) 51 (68.0) 49 (65.3) 54 (72.0) 63 (84.0) 36 (48.0) 24 (32.0) 42 (56.0) 47 (62.7)
No 13 (52.0) 7 (28.0) 19 (76.0) 19 (76.0) 17 (68.0) 19 (76.0) 11 (44.0) 9 (36.0) 15 (60.0) 21 (84.0)
Self-reported dyslipidemia p = 1.000 p = 1.000 p = 0.822 p = 0.513 p = 0.821 p = 0.101 p = 0.835 p = 0.508 p = 0.536 p = 0.513
Yes 20 (55.6) 8 (22.2) 26 (72.2) 23 (63.9) 25 (69.4) 33 (91.7) 16 (44.4) 10 (27.8) 19 (52.8) 23 (63.9)
No 36 (56.3) 14 (21.9) 44 (68.8) 45 (70.3) 46 (71.9) 49 (76.6) 31 (48.4) 23 (35.9) 38 (59.4) 45 (70.3)
Nutritional guidance for DM p = 0.266 p = 0.178 p = 1.000 p = 0.812 p = 1.000 p = 0.573 p = 0.505 p = 1.000 p = 0.500 p = 0.812
Yes 43 (59.7) 13 (18.1) 50 (69.4) 48 (66.7) 51 (70.8) 60 (83.3) 32 (44.4) 24 (33.3) 43 (59.7) 48 (66.7)
No 13 (46.4) 9 (32.1) 20 (71.4) 20 (71.4) 20 (71.4) 22 (78.6) 16 (53.6) 9 (32.1) 14 (50.0) 20 (71.4)
Nutritional monitoring p = 1.000 p = 0.347 p = 0.257 p = 0.266 p = 0.260 p = 1.000 p = 0.447 p = 0.277 p = 0.436 p = 0.579
Yes 10 (55.6) 2 (11.1) 15 (83.3) 10 (55.6) 15 (83.3) 15 (83.3) 10 (55.6) 8 (44.4) 12 (66.7) 11 (61.1)
No 46 (56.1) 20 (24.4) 55 (67.1) 58 (70.7) 56 (68.3) 67 (81.7) 37 (45.1) 25 (30.5) 45 (54.9) 57 (69.5)
Physical activity p = 0.347 p = 1.000 p = 0.195 p = 0.801 p = 1.000 p = 1.000 p = 1.000 p = 1.000 p = 0.811 p = 0.126
Yes 15 (65.2) 5 (21.7) 19 (82.6) 15 (65.2) 16 (69.6) 19 (82.6) 11 (47.8) 8 (34.8) 14 (60.9) 19 (82.6)
No 41 (53.2) 17 (22.1) 51 (66.2) 53 (68.8) 55 (71.4) 63 (81.8) 36 (46.8) 25 (32.5) 43 (55.8) 49 (63.6)
BMI* p = 0.801 p = 0.121 p = 0.170 p = 0.412 p = 0.054 p = 0.325 p = 0.445 p = 0.594 p = 1.000 p = 1.000
Not overweight 10 (52.6) 7 (36.8) 16 (84.2) 11 (57.9) 17 (89.5) 14 (73.7) 7 (36.8) 5 (26.3) 11 (57.9) 13 (68.4)
Overweight 46 (56.8) 15 (18.5) 54 (66.7) 57 (70.4) 64 (66.7) 68 (84.0) 40 (49.4) 28 (34.6) 46 (56.8) 55 (67.9)
WC (cm)** p = 0.215 p = 0.302 p = 0.884 p = 0.411 p = 0.926 p = 0.124 p = 0.593 p = 0.476 p = 0.681 p = 0.333
Low risk 3 (42.9) - 5 (71.4) 4 (57.1) 5 (71.4) 4 (57.1) 2 (28.6) 3 (42.9) 3 (42.9) 3 (42.9)
High risk 12 (75.0) 3 (18.8) 12 (75.0) 13 (81.3) 12 (75.0) 12 (75.0) 8 (50.0) 7 (43.8) 10 (62.5) 11 (68.8)
Very high risk 41 (53.2) 19 (24.7) 53 (68.8) 51 (66.2) 54 (70.1) 66 (85.7) 37 (48.1) 23 (29.9) 44 (57.1) 54 (70.1)
Blood glucose (mg/dL)*** p = 0.130 p = 0.130 p = 0.060 p = 0.492 p = 0.814 p = 1.000 p = 0. 091 p = 0.649 p = 0.830 p = 0.363
Normal 14 (43.8) 4 (12.5) 18 (56.3) 20 (62.5) 22 (68.8) 26 (81.3) 11 (34.4) 12 (37.5) 19 (59.4) 24 (75.0)
Abnormal 42 (61.8) 18 (26.5) 52 (76.5) 48 (70.6) 49 (72.1) 56 (82.4) 36 (52.9) 21 (30.9) 38 (55.9) 44 (64.7)
HbA1c (%)*** p = 0.840 p = 0.470 p = 0.828 p = 0.830 p = 0.660 p = 0.192 p = 0.689 p = 0.395 p = 0.686 p = 0.133
Normal 29 (58.0) 13 (26.0) 34 (68.0) 35 (70.0) 37 (74.0) 44 (88.0) 25 (50.0) 19 (38.0) 30 (60.0) 38 (76.0)
Abnormal 27 (54.0) 9 (18.0) 36 (72.0) 33 (66.0) 34 (68.0) 38 (76.0) 22 (44.0) 14 (28.0) 27 (54.0) 30 (60.0)
aDaily consumption. cAt least five times a week. p value: Chi-squared test. *Nutritional status based on BMI. ** Risk of metabolic complications based on WC. *** Glycemic control based on blood glucose and HbA1c. DM:
Z
anc
him MC
and hamburgers and processed meat products more than once a week. Industrialized foods, which are high in simple sugars and additives, often contain saturated fat and excess salt and are reduced into complex carbohydrates. This pattern is strongly associated with the develop-ment of chronic noncommunicable diseases and obesity and should be discouraged, particularly in people with chronic disease31.
The analysis of the association between ad-equate consumption of healthy diet markers and sociodemographic variables showed that adequate consumption of fruit is greater among women than in men, which is similar to the find-ings of the most recent VIGITEL4. Other studies
with diabetes patients have also reported gender differences in the adequate consumption of fruit, indicating that women are more concerned with diet and health than men27,32.
With respect to anthropometric measure-ments, adequate consumption of milk or yo-gurt was greater in individuals who where not overweight or obese based on BMI. This finding is particularly pertinent because some studies have shown that adequate consumption of dairy products, especially low-fat food items, is in-versely associated with increased blood glucose, insulin, and blood pressure levels and excess body weight33,34.
With respect to adequate consumption of unhealthy diet markers, the results show that adequate consumption of cookies or sweets was greater among individuals with a family income of less than four MSs, corroborating the findings of a study with diabetes patients conducted by Iop et al.32 that observed a positive relationship
between the consumption of cookies and cakes and income, demonstrating that the greater the income the greater the consumption of these foods. These findings show that a better quality diet is possible even among people with more modest incomes35.
Adequate consumption of sugary drinks (no more than once a week) was greatest among pa-tients who did not have HBP. A systematic review and meta-analysis based on data from prospec-tive cohort studies showed that a high level of consumption of sugary or artificially sweetened drinks was associated with a significant increase in the risk of developing HPB36. Reducing the
consumption of sugar and sodium-rich foods is
widely recommended among diabetes patients due to their harmful effects1. Thus, this finding is
positive and may be the result of the effects dia-betes has on health and fear of developing other diseases, obliging diabetes patients to make more appropriate and healthier choices.
Conclusions
The findings of this study show that the majority of participants showed adequate consumption of healthy and unhealthy diet markers based on the consumption frequency recommended by the Ministry of Health. However, based on the anthropometric measurements and results of the biochemical assessment, the fact that blood glucose and HbA1c levels were particularly high among this group is worrying.
The app was shown to be an adequate tool for the collection of information on the dietary habits assessed by this study, given that it is quick and easy to use and dispenses with the need for long and complex paper questionnaires. Fur-thermore, it enabled process automation, with the assessments being directly transmitted to a database, thus minimizing time and chances of protocol entry errors and resulting in greater ac-curacy. The app offers a further advantage over paper-based assessment in the form of immedi-ate patient feedback on his/her nutritional status and food consumption adequacy.
Given the findings and the fact that nutrition-al therapy is one of the pillars of diabetes treat-ment, this study concludes that it is necessary to reinforce nutritional guidance and explain to pa-tients the importance of making positive changes to unhealthy eating habits to help control their di-abetes. Encouraging patients to adopt a balanced diet and regular physical activity can help improve nutritional status and metabolic control in these patients, as well as reducing acute and chronic complications associated with the disease.
aúd
e C
ole
tiv
a,
23(12):4199-4208,
2018
Collaborations
MC Zanchim was responsible for study concep-tion, data collecconcep-tion, analysis and interpretaconcep-tion, and drafting this article. VR Kirsten co-super-vised this work and participated in data analysis and interpretation, and in drafting this article. ACB De Marchi supervised this work, participat-ing in study conception, data analysis and inter-pretation, and in drafting this article.
Acknowledgements
We are grateful to the Coordination of Improve-ment of Higher Education Personnel (CAPES, acronym in Portuguese) and National Council for Scientific and Technological Development (CNPq, acronym in Portuguese).
References
1. Sociedade Brasileira de Diabetes. Princípios para orientação nutricional no diabetes mellitus. Diretrizes
da Sociedade Brasileira de Diabetes 2015; 19:41.
2. Levy-Costa RB, Sichieri R, Pontes NS, Monteiro CA. Disponibilidade domiciliar de alimentos no Brasil: dis-tribuição e evolução (1974-2003). Rev Saude Publica
2005; 39(4):530-540.
3. Instituto Brasileiro de Geografia e Estatística (IBGE).
Pesquisa de Orçamentos Familiares 2008-2009. Análise
do Consumo Alimentar Pessoal no Brasil. Rio de Janeiro:
IBGE; 2011.
4. Brasil. Ministério da Saúde (MS). Vigitel Brasil 2014: vigilância de fatores de risco e proteção para doenças
crô-nicas por inquérito telefônico. Brasília: MS; 2015.
5. Selem SS, Carvalho AM, Verly-Junior E, Carlos JV, Teixeira JA, Marchioni DM, Fisberg RM. Validity and reproducibility of a food frequency questionnaire for adults of São Paulo, Brazil. Rev Bras Epidemiol 2014; 17(4):852-859.
6. Pedraza DF, Menezez TN. Questionários de Frequência de Consumo Alimentar desenvolvidos e validados para população do Brasil: revisão da literatura. Cien Saude
Colet 2015; 20(9):2697-2720.
7. Eysteinsdottir T, Thorsdottir I, Gunnarsdottir I, Ste-ingrimsdottir L. Asessing validity of a short food fre-quency questionnaire on present dietary intake of el-derly Icelanders. Nutr J 2012; 11(12):1-8.
8. Mannato LW, Pereira TSS, Velasquez-Melendez G, Car-doso LO, Benseñor IM, Molina MCB. Comparison of a short version of the Food Frequency Questionnaire with its long version - a cross-sectional analysis in the Brazilian Longitudinal Study of Adult Health (EL-SA-Brasil). Sao Paulo Med J 2015; 133(5):414-420. 9. Brasil. Ministério da Saúde (MS). Protocolos do Sistema
de Vigilância Alimentar e Nutricional. SISVAN na
assis-tência à saúde. Brasília: MS; 2008.
10. Curioni CC, Brito FSB, Boccolini CS. O uso de tecnolo-gias de informação e comunicação na área da nutrição.
Jornal Brasileiro de TeleSSaúde 2013; 2(3):103-111.
11. Costa TM, Salomão PL, Martha AS, Pisa IT, Sigulem D. The impact of short message service text messages sent as appointment reminders to patients’ cell phones at outpatients clinics in São Paulo, Brazil. Int J Med In-form 2010; 79(1):65-70.
12. Brasil. Ministério da Saúde (MS). Banco de dados do Sistema Único de Saúde-DATASUS: Indicadores de Fa-tores de Risco e de Proteção, Prevalência de diabete melito
em 2012. [acessado 2014 Nov 8]. Disponível em: http://
www.datasus.gov.br
13. Baldo C, Zanchim MC, Kirsten VR, de Marchi ACB.
Diabetes FoodControl – Um aplicativo móvel para ava-liação do consumo alimentar de pacientes diabéticos.
RECIIS 2015; 9(3):1-12.
14. American Diabetes Association. Standards of Medical Care in Diabetes-2015. Diabetes Care 2014; 38(1):1-94. 15. Brasil. Ministério da Saúde (MS). Orientações para a
coleta e análise de dados antropométricos em serviços de saúde: Norma Técnica do Sistema de Vigilância
Alimen-tar e Nutricional - SISVAN. Brasília: MS; 2011.
Z
anc
him MC
17. Chumlea WC, Roche AF, Steunbaugh ML. Estimating stature from knee height for persons 60 to 90 years of age. J Am Geriatr Soc 1985; 33(2):116-120.
18. World Health Organization (WHO). Obesity: prevent-ing and managprevent-ing the global epidemic. Report of a WHO
Consultation on Obesity. Geneva: WHO; 1998.
19. Brasil. Ministério da Saúde (MS). Guia alimentar para a população brasileira: promovendo a alimentação
sau-dável. Brasília: MS; 2006.
20. Pinheiro DS, Costa CDD, Rocha-Filho CRR, Mundim CA, Reis AAS, Ghedini PC. Avaliação do nível de con-trole glicêmico dos pacientes diabéticos tipo 2 atendi-dos em um Hospital universitário. Revista da
Universi-dade Vale do Rio Verde 2012; 10(2):3-11.
21. Winkelmann ER, Fontela PC. Condições de saúde de pacientes com diabetes mellitus tipo 2 cadastrados na Estratégia Saúde da Família, em Ijuí, Rio Grande do Sul, 2010-2013. Epidemiologia e Serviços de Saúde 2014; 23(4):665-674.
22. Lisbôa HRK, Souilljee M, Cruz CS, Zoletti L, Gobbato DO. Prevalência de hiperglicemia não diagnosticada nos pacientes internados nos hospitais de Passo Fundo,
RS. Arquivos Brasileiros de Endocrinologia &
Metabolo-gia 2000; 44(3):220-226.
23. Supp EDP. Avaliação dos fatores relacionados ao surgi-mento de hipertensão, em um grupo de diabéticos tipo 2
de Timbé do Sul – SC [monografia]. Criciúma:
Univer-sidade do Extremo Sul Catarinense; 2012.
24. Sampaio HAC, Carioca AAF, Sabry MOD, Santos PM, Coelho MM, Passamai MPB. Letramento em saúde de diabéticos tipo 2: fatores associados e controle
glicêmi-co. Cien Saude Colet 2015; 20(3):865-874.
25. Ferreira LT, Saviolli IH. Valentini VE, Abreu LC. Dia-betes melito: hiperglicemia crônica e suas complica-ções. Arquivos Brasileiros de Ciências da Saúde 2011; 36(3):182-188.
26. Tiew KF, Chan YM, Lye MS, Loke SC. Factors associ-ated with dietary diversity score among individuals with type 2 diabetes mellitus. J Health Popul Nutr 2014; 32(4):665-676.
27. Destri K. Marcadores de Consumo Alimentar de Hiper-tensos e Diabéticos do Município de Nova Boa Vista-RS
[dissertação]. Pelotas: Universidade Federal de Pelotas; 2014.
28. Kobayashi Y, Hattori M, Wada S, Iwase H, Kadono M, Tatsumi H, Kuwahata M, Fukui M, Hasegawa G, Naoto NN, Kido Y. Assessment of daily food and nutrient in-take in Japanese type 2 diabetes mellitus patients using dietary reference intakes. Nutrients 2013; 5(7):2276-2288.
29. Lima LA, Nedel FB, Olinto MTA, Baldisserotto J. Food habits of hypertensive and diabetics cared for in a Pri-mary Health Care service in the South of Brazil. Revista
de Nutrição 2015; 28(2):197-206.
30. Bleich SN, Wang YC. Consumption of sugar-sweetened beverages among adults with type 2 diabetes. Diabetes Care 2011; 34(3):551-555.
31. Brasil. Ministério da Saúde (MS). Estratégias para o
cui-dado da pessoa com doença crônica. Brasília; MS; 2014.
(Cadernos de Atenção Básica, n. 35) (Série A. Normas e Manuais Técnicos).
32. Iop SCF, Teixeira E, Deliza R. Comportamento alimen-tar de indivíduos diabéticos. Brazilian Journal Food
Te-chnology 2009; II SSA:36-43.
33. Martins ML, Kac G, Silva RA, Bettiol H, Barbieri MA, Cardoso VC, Silva AA. Dairy consumption is associated with a lower prevalence of metabolic syndrome among young adults from Ribeirão Preto, Brazil. Nutrition
2015; 31(5):716-721.
34. Drehmer M, Pereira MA, Schmidt MI, Del Carmen B Molina M, Alvim S, Lotufo PA, Duncan BB. Associa-tions of dairy intake with glycemia and insulinemia, in-dependent of obesity, in Brazilian adults: the Brazilian Longitudinal Study of Adult Health (ELSA-Brasil). Am
J Clin Nutr 2015; 101(4):775-782.
35. Zanetti ML, Arrellias CCA, Franco RC, Santos MA, Rodrigues FFL, Faria HTG. Adesão às recomendações nutricionais e variáveis sociodemográficas em pacien-tes com diabepacien-tes mellitus. Revista Escola de Enfermagem USP 2015; 49(4):619-625.
36. kim Y, Je Y. Prospective association of sugar-sweetened and artificially sweetened beverage intake with risk of hypertension. Arch Cardiovasc Dis 2016; 109(4):242-253.
Article submitted 18/06/2016 Approved 13/05/2017
Final version submitted 15/05/2017
This is an Open Access article distributed under the terms of the Creative Commons Attribution License BY