THE EFFECT OF ANTIMONY PRESENCE IN ANODIC COPPER ON
KINETICS AND MECHANISM OF ANODIC DISSOLUTION AND
CATHODIC DEPOSITION OF COPPER
Z. D. Stanković*, V. Cvetkovski** and M. Vuković*
*University of Belgrade, Technical Faculty, VJ 12, 19210 Bor, Serbia, **Institute for Mining and Metallurgy Bor, 19210 Bor, Serbia
(Received 01 February 2008; accepted 26 February 2008)
Abstract
The influence of the presence of Sb atoms, as foreign metal atoms in anode copper, on kinetics, and, on the mechanism of anodic dissolution and cathodic deposition of copper in acidic sulfate solution has been investigated. The galvanostatic single-pulse method has been used. Results indicate that presence of Sb atoms in anode copper increase the exchange current density as determined from the Tafel analysis of the electrode reaction. It is attributed to the increase of the crystal lattice parameter determined from XRD analysis of the electrode material.
Keywords: copper, anodic dissolition, cahodic deposition, antimony, lattice parameter
* Corresponding author: [email protected]
DOI:10.2298/JMMB0801107S
M i n i n g a n d M e t a l l u r g y Journal of Mining and Metallurgy 44 B (2008) 107 - 114
1. Introduction
The corrosion behavior of copper in various solutions is very well documented. Many fundamental studies have been concerned with the mechanism of corrosion [1-5] and deposition of copper[3-20]. Despite these findings, the influence of metal impurities in anode copper on kinetics and
phenomena[1], in electropolishing[1], and in maintaining the supply for electroless deposition processes[2].
For the electrochemical dissolution and deposition of copper
Cu(II) + 2e ↔ Cu (1)
has been found by Mattson and Bockris [6] and verified by numerous authors [6-17] that in an acidic sulfate system, the reaction proceeds in two steps
Cu(II) + e ↔ Cu(I) (slow) (2)
Cu(I) + e ↔ Cu (fast) (3)
The assumption of Butler-Volmer kinetics
with a symmetry factor β = αc = 0.5 for
reaction 2 and of equilibrium of Reaction 3 yields
j = jo / [exp (αa Fη/RT )
-- exp ( -- αcFη /RT )] (4)
where j is the net current density, jo is the
exchange current density, αa and αc are the
anodic and cathodic transfer coefficient, the theoretical values of which are 1.5 and 0.5, respectively.
The aim of the present work is to obtain insight into the effect of the antimony presence into copper electrode on kinetics and mechanism of anodic dissolution and cathodic deposition of copper. The anodic copper used in electrolytic plants for the production of copper usually contains antimony as a metal impurity in the range of 0.0002 to 0.1980 weight %[24].
2. Experimental
The influence of Sb atoms in anodic copper on the kinetics and mechanism of anodic dissolution and cathodic deposition of copper in an acidic sulfate system was investigated using the single pulse galvanostatic method. The electrochemical cell was a commercial product (AMEL MODEL 494/GC + 494/TJ).
The working Cu-Sb electrodes was prepared from speimens obtained by the melting of an appropriate mixture of Cu and Sb powder under purified nitrogen at1780 K. The concentration of Sb atoms in copper was chosen to be close to that in the commercial plants for the production of copper, i.e., into the ranges of 0.01 to 1.05 atom % Sb. Only the largest concentration of 16.87 atom % Sb was outside this range. Figure 1. is the copper-antimony diagram from[25]. A double-headed arrow indicates the range of phase space sampled, and, it does not represent fabrication temperature.
After melting and solidification, part of the specimens was taken for X-ray diffraction (XRD) and microstructure analysis. For the working electrode, part of the specimens used was in the form of a cube (5 mm edge) embedded in an epoxy resin with the contact of mercury and copper wire exposed to the upward face, so that only the base of a cube was exposed to the solution. Prior to each experiment, the electrode was ground with 400 grade emery paper and washed with bi-distilled water.
The counter electrode was spiral-shaped Pt wire of 0.5 mm diameter and 20 cm length. A spectroscopically pure copper wire, 4 cm length, has been used for equilibrating solution[26], with respect to the reaction.
Cu(II) + Cu ↔ 2Cu(I)
The reference electrode was a saturated calomel electrode (SCE) and all the potentials are referred to SCE.
Solutions were made from copper sulfate (p.a. Merck), sulfuric acid (supra-pure Merck), and bidistilled water. The concentrations of copper sulfate and sulfuric acid were 0.7 and 1.5 M, respectively. The solutions were de-aerated by bubbling nitrogen of high purity for 1 h. Stirring was affected by employing a magnetic stirrer. During measurements, stirring was stopped while nitrogen was slowly bubbled through the solution.
The single-pulse method was carried out using a potentiostat/galvanostat (AMEL model 551) programmed with function generator (AMEL model 565). The pulses were made long enough for the activation over-voltage to reach a constant value (from 5 ms for the highest current density to 500
ms for the lowest). A series of transients was recorded covering the current density range
0.06-90 mA/cm2. All the anodic transients were taken first and then followed by cathodic ones in the order from low to high current densities. The overvoltage-time transients were recorded by a personal computer system. Between the electrode system and analog-to-digital converter (RTI-800, Analog Devices), an instrumentation preamplifier AMP-01 (from PMI) with input
resistance ≥109 Ω was used. Temperature
was maintained at 298 ±0.1 K .
3. Results and Discussion
Quasi-steady-state overvoltage values at different current densities were found from plateaus of the galvanostatic transients and Tafel plots were determined. The regression analysis to obtain Tafel slopes and exchange current densities was done using the principle of least squares and the corresponding PASCAL program. This has been done for both the anodic and cathodic direction of the process and for each of the investigated electrodes with a different content of Sb atoms. Tafel plots were made with the potential expressed versus SCE and corrected current densities, Y, obtained from the relation
Y = j / [1 - exp (-2Fη/RT )] =
= (jo)a,c exp (±αa,cFη/RT )] (5)
where j is the net current density, αa,c is the
anodic, i.e., cathodic transfer coefficient, and (jo)a,c is the exchange current density for the anodic, i.e., cathodic reaction, respectively.
data of the exchange current densities and other kinetic parameters, used as diagnostic criteria in the study of the mechanism and kinetics of the electrode processes, it was necessary to test the apparatus end of the experimental procedure in respect to reproducibility and assurance of the obtained data. It was of special importance in this study because the mechanism and kinetics of the copper electrode with the addition of foreign atoms was investigated.
Therefore, two test experiments were performed under the similar conditions described in[17, 21, 27, 28], where the results were used as reference point for comparison with the results of test experiments obtained in this study. In one of two test experiments, the Cu electrode was prepared as described in the experimental procedure as currently used, i.e., by melting copper powder in purified nitrogen; but, in the second test, before measurements, a copper deposit was freshly grown on the
electrode for 30 min at 15 mA/cm2 from the solution employed in the experiment.
The obtained results are collected in Table I together with reference data, and, apart from being very reproducible, are in satisfactory agreement with the reference ones as well. Three replicate experiments were made and the data in Table I is the medium values.
Cathodic Tafel slopes were 118 mV and anodic slopes 44 mV (115 and 43 mV in references). The corresponding transfer
coefficients are αc = 0.5 ι αa = 1.35. The
sum of αc i αa is 1.85 and that is close to the
theoretical value of 2. The agreement of jo, obtained by extrapolation of the cathodic and
anodic Tafel lines at high potentials to η= 0,
is fair but two facts should be highlighted:
1.There is a slight but definite tendency for the values from the anodic Tafel lines to be smaller, as can be seen from Table I. Similar results were obtained by Bockris and Enyo, Bockris and Mattson, and Albaya and Lorenz.
2.The exchange current densities obtained
in this study are lower than those in[17, 21, 27, 28]. Also, the exchange current densities obtained in this study are lower for the electrode prepared by melting in a nitrogen atmosphere than for the electrode prepared by electrodeposition on such electrode from the solution employed in the experiment, as can be seen in Table I. This is probably the consequence of the difference in structure of
the investigated copper electrodes.
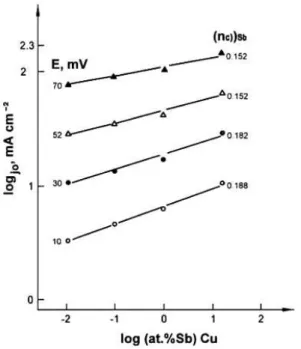
The exchange current densities obtained from the Tafel lines for the Cu-Sb electrodes with different concentrations of Sb atoms, prepared by melting, were found to increase with an increasing concentration of Sb atoms, as can be seen in Figures 2-5 and Table II. Also, the exchange current density of each component of alloy can be treated separately – for the anodic dissolution and cathodic deposition of copper.
Figure 3. shows that the increase in the
Table 2. Kinetic parameters for the anodic dissolution and cathodic deposition of Cu-Sb in 0.7 M Cu(II) + 1.5 M H2SO4 solution. T = 298 K.
Figure 2. The anodic and cathodic Tafel plots at different concentrations of Sb in Cu-electrode: -o-: 0.01, -•-: 0.1, -∆-: 1.05, and -▲-: 16.87 atom % Sb.
anodic and cathodic exchange current densities with the increase in the concentration of Sb atoms, can be expressed by the quotients, i.e., electro-chemical orders
(no)a=[log (jo)a/log CSb]E,T=0.21 (6a)
(no)C=[log (jo)C/log CSb]E,T=0.14 (6b)
respectively, where CSb is the atomic concentration of Sb atoms. However, in order to analyze the effect of Sb on mechanism of processes on copper, the data in regard to the partial electrochemical orders are required.
Figures 4 and 5 show that concentration dependence of the anodic and cathodic current densities at any constant value of the potential in the anodic region of 10-70 mV and cathodic region of 80-170 mV on the concentration of Sb atoms may be expressed on the basis of their partial electrochemical orders. Experimentally determined values of these orders are:
na = 0.19 - 0.11 and nc = 0.23 - 0.29.
This reveals a partial participation of antimony in the reaction mechanism on copper in an investigated system. The influence of Sb is more pronounced in the case of cathodic deposition of copper.
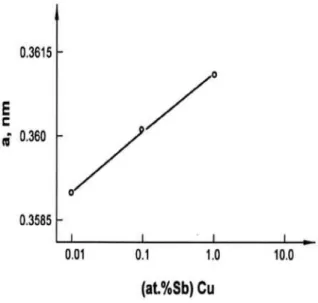
The increase in the anodic and cathodic exchange current densities with the increase in the concentration of Sb atoms, can be attributed to the increase in the lattice parameter, a. Namely, using XRD analysis, the lattice parameter was determined and the results are presented in Figure 6. It is quite evident that the increase in the exchange current densities follows well the increase in
Fig.. 4. Logarithm of anodic current densities for copper dissolution as a function of Sb concentration at several constant potentials.
the lattice parameter of the crystal structure. It seems that the presence of Sb atom (in the range of 0.01 to 1.05 atom %) in the crystal structure of copper facilitates in the increasing of the interatomic distances. Based on this, it may be assumed that the accelerating effect of Sb atoms on the kinetics of the electrodissolution/deposition of the copper is due to the decreasing of the inter-atomic force in the crystal structure of the copper in the presence of the Sb atoms. However, at the highest Sb concentration of 16.87 atom %, XRD analysis did not show the presence of copper reflections. Instead, a new reflection line was detected for nCu3,3Sb.
This compound with a hexagonal crystal structure has a significantly higher value for the lattice parameter, i.e., a = 0.992 nm.
These results, which indicate the influence of the lattice parameter on the kinetics of anodic dissolution and cathodic deposition of copper, seem to confirm some
other findings obtained for the Cu single-crystal micro-alloyed with 0.45 atom % Sb[29, 30]. Namely, the STM obtained for this alloy demonstrate that Sb atoms, segregate substitutionally, and, they do not exist as adatoms at the Cu(111) surface. Furthermore, despite atomic radii mismatch
that exists between Sb and Cu (≈ 15%), the
six Cu atoms surrounding each Sb atom, in the (111) plane, are significantly perturbed in terms of either electronic density or their atomic position[29]. Thus, it has been assumed that Cu atoms were vertically and laterally displaced from their expected position, thereby leading to an unexpected broken surface.
4. Conclusion
The exchange current densities obtained from the Tafel lines for the Cu-Sb electrodes with different concentration of Sb atoms, prepared by melting, were found to increase with increasing concentration of Sb atoms. The influence of Sb atoms on the anodic and cathodic reaction on copper can be expressed by the electrochemical orders
(no)a = [log (jo)a / log CSb]E,T = 0.21 (no)c = [log (jo)c / log CSb]E,T = 0.14
The increase in the anodic and cathodic exchange current densities with the increase in the concentration of Sb atoms, can be attributed to the increase of the lattice parameter with the increase in the concentration of Sb atoms in investigated Cu-Sb electrodes.
References
1. T. Osuka and M. Uda, Corros. Sci., 9
(1969) 707.
2. U. Bertoci and D. R. Turner, in Encyclopedia of Electrochemistry of the Elements, Vol. 11, A. J. Bard, Editor, Marcel Decker, New York, 1974, p. 383
3. M. Novak and A. Szuch, J.
Electroanal. Chem. Interfacial Electrochem., 210 (1986) 229.
4. L. A. Ammar and S. Reed, Corros. Sci.,
9 (1969) 423.
5. S. N. Mostafa, M. Y. Mourad, and S. A.
Selimam, Corros. Sci., 130 (1981) 221.
6. E. Mattson and J. O’M. Bockris, Trans.
Faraday Soc., 55 (1959)1586.
7. P. J. Hillson, Trans. Faraday Soc., 50
(1954) 385.
8. J. O’M. Bockris and M.Enyo, Trans.
Faraday Soc., 58 (1962) 1187.
9. J. O’M. Bockris and H. Kita, J.
Electrochem. Soc., 109 (1962) 928.
10. O. R. Brown and H. R. Thirsk,
Electrochim. Acta, 10 (1965) 383.
11. I. M. Pearson and G. F. Schrader,
Electrochim. Acta, 13 (1968) 2021.
12. T. Hurlen, G. Ottesen, and A.
Staurset, Electrochim. Acta, 23 (1978) 223.
13. J. O’M. Bockris and B. E. Conway, J.
Chem. Phys., 28 (1968) 707.
14. D. R. Turner and G. R. Johnson, J.
Electrochem. Soc., 109 (1962) 798.
15. R. Caban and T. W. Chapman, J.
Electrochem. Soc., 124 (1977) 1371.
16. H. G. Albaya and W. J. Lorenz, Phys.
Chem. N.F., 81 (1972) 294.
17. Z. D. Stanković and M. Vuković,
Electrochim. Acta, 41 (1996) 2529.
18. C. Gabriell, P. Mocoteguy, H. Perrot
and R. Wiart, J. Electroanal. Chem., 572
(2004) 367.
19. W. P. Dow and H. S. Huang, J.
Electrochem. Soc., 152 (2005) C67.
20. W. Shao, G. Pattanaik and G. Zangari,
J. Electrochem. Soc., 154 (2007) D201.
21. Z. D. Stanković,J. Electrochem. Soc.,
128 (1981) 1862.
22. Z. D. Stanković, V. Cvetkovski and
M. Rajčić-Vujasinović, J. Electrochem. Soc.,
148 (2001) C443.
23. V. N. Chervyakov, G. N. Markos’yan
and A. P. Pchel’nikov, Protection of Metals,
40 (2004) 111.
24. K. Biswas and G. Davenport, Extractive Metallurgy of Copper, Second Edition, Pergamon Press, Oxford, 1976, p.115.
25. C. J. Smithells, Metals Reference Book, Fifth Edition, Butterworths, London and Boston, 1976, p.591.
26. A. Damjanović, M. Paunović, and J.
O’M. Bockris, J. Electroanal. Chem., 9
(1965) 93.
27. Z. D. Stanković, Erzmetall, 38 (1985)
361.
28. Z. D. Stanković, Electrochim. Acta.,
29 (1984) 407.
29. B. Aufray, H. Giordino, and D. N.
Seidman, Surface Sci., 447 (2000)180
30. H. Giordino and B. Aufray, Surface
![Figure 1. is the copper-antimony diagram from[25]. A double-headed arrow indicates the range of phase space sampled, and, it does not represent fabrication temperature.](https://thumb-eu.123doks.com/thumbv2/123dok_br/16296485.185764/2.918.483.755.677.944/figure-antimony-diagram-indicates-sampled-represent-fabrication-temperature.webp)