Article
J. Braz. Chem. Soc., Vol. 24, No. 8, 1276-1286, 2013. Printed in Brazil - ©2013 Sociedade Brasileira de Química 0103 - 5053 $6.00+0.00
A
*e-mail: [email protected], [email protected], [email protected]
Redox Pathways of Aliskiren Based on Experimental and Computational
Approach and Its Voltammetric Determination
Deniz Pamuk,aİbrahim Hüdai Taşdemir,*,b Abdulilah Ece,*,c
Esin Canela and Esma Kılıça
aDepartment of Chemistry, Faculty of Science, Ankara University, 06100 Ankara, Turkey
bDepartment of Chemistry, Faculty of Arts and Science, Amasya University, 05100 Amasya, Turkey
cDepartment of Chemistry, Faculty of Science, Hacettepe University, 06800 Ankara, Turkey
O comportamento eletroquímico do aliscireno (ALS) foi estudado por meio de métodos experimentais eletroquímicos e cálculos teóricos realizados em nível B3LYP/6-31+G (d)//AM1. Estudos eletroquímicos foram baseados nos processos de redução reversível controlada por adsorção a ca. −1,5 V em eletrodo gotejante de mercúrio (HMDE) e de oxidação eletroquímica irreversível a ca. 1,0 V em eletrodo de carbono vítreo (GCE) do ALS vs. Ag/AgCl, KCl (3,0 mol L−1)
em solução tampão Britton-Robinson pH 10 e 8, respectivamente. De acordo com os achados computacionais e experimentais, o ALS é esperado ser irreversivelmente oxidado na posição benzílica e reversivelmente reduzido nos grupos carbonila da amida. Métodos voltamétricos com e sem modo de redissolução adsortiva foram desenvolvidos e validados para quantificação do ALS em diferentes amostras. Limites de detecção e de quantificação para o ALS foram 6,3 × 10⁻⁸ e
2,1 × 10⁻⁷ mol L−1 por voltametria de pulso diferencial em HMDE e 1,2 × 10⁻⁸ e 3,9 × 10⁻⁸ mol L−1
por voltametria de onda quadrada com redissolução catódica adsortiva. Os métodos foram aplicados com sucesso em ensaios de fármacos em comprimidos e em sangue humano com boas recuperações, entre 91,7 e 102,3%, e desvio padrão relativo menor que 10%.
Electrochemical behavior of aliskiren (ALS) was studied via experimental electrochemical methods and theoretical calculations performed at B3LYP/6-31+G (d)//AM1. Cyclic voltammetry studies were carried out based on the adsorption-controlled reversible reduction at ca. −1.5 V on hanging mercury drop electrode (HMDE) and irreversible electrochemical oxidation of ALS at
ca. 1.0 V on glassy carbon electrode (GCE), vs. Ag/AgCl, KCl (3.0 mol L−1), in Britton-Robinson
buffer at pH 10 and 8, respectively. According to computational and experimental findings, ALS is expected to be oxidized irreversibly at benzylic position and reduced reversibly at amide carbonyl groups. Voltammetric methods with and without adsorptive stripping mode were developed and validated for quantification of ALS in different samples. Limits of detection and of quantification for ALS were 6.3 × 10⁻⁸ and 2.1 × 10⁻⁷ mol L−1 for differential pulse voltammetry on HMDE and
1.2 × 10⁻⁸ and 3.9 × 10⁻⁸ mol L−1 for square-wave cathodic adsorptive stripping voltammetry.
The methods were successfully applied to assay the drug in tablets and human serum with good recoveries, between 91.7 and 102.3%, having relative standard deviation less than 10%.
Keywords: aliskiren, density functional theory, electrochemical behavior, electrode mechanism, HOMO-LUMO, voltammetric determination
Introduction
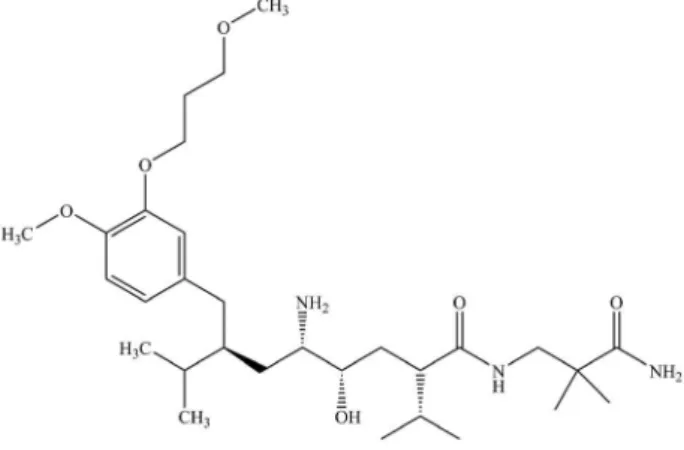
Aliskiren (ALS), chemically known as (2S,4S,5S,7S )- 5-amino-N-(2-carbamoyl-2,2-dimethylethyl)-4-hydroxy-7-{[4-methoxy
3-(3-methoxypropoxy)phenyl]methyl}-8-methyl-2-(propan-2-yl)nonanamide (Figure 1), is an oral renin inhibitor used in the treatment of hypertension. It can be used in combination with other drugs in the antihypertensive class, as well as alone.1
to biologically important molecules, especially to drug compounds. Electrochemical methods make it possible to evaluate reduction and oxidation characteristics, plausible redox pathways and adsorption-diffusion parameters ofmolecules under investigation.2-7 These parameters are
important for distribution, metabolism, pharmacological, toxicological and pharmacokinetic properties of drugs. Theoretical calculations were also found to be useful as an additional tool to enlighten oxidation-reduction mechanisms.6,8,9
Since ALS is very new as a drug, only few analytical methods have been described for its determination in pharmaceutical samples/biological fluids and amongst them are spectrophotometry,10 spectrofluorimetry,11,12
layer chromatography (LC),13 micellar electrokinetic
c h r o m a t o g r a p h y,1 4 h i g h - p e r f o r m a n c e l i q u i d
chromatography (HPLC),15 hydrophobic interaction
liquid chromatography16 and reversed phase-LC (RP-LC)17
methods. To the best of our knowledge, up to the present time, there is no electrochemical study dealing with voltammetric determination of ALS in pharmaceutical formulation and biological samples.
Voltammetric techniques are used for the quantitative determination of a variety of organic and inorganic substances including drug active ingredients and excipients in pharmaceutical dosage forms and their possible metabolites in biological fluids. Additionally, voltammetric stripping technique extends the use of these methods ensuring lower limits of detection. Many applications of the voltammetric stripping methods have been reported in the literature to determine environmentally and biologically important substances.2,3,6-8,18-21
The present study was designed to investigate the electrochemical behavior of ALS on hanging mercury drop electrode (HMDE) and glassy carbon electrode (GCE). A tentative reaction mechanism was also proposed. Computational studies were performed to enlighten the
redox reaction mechanisms. In addition, it was also aimed to develop rapid, simple and novel voltammetric methods for direct determination of ALS in pharmaceutical dosage forms and human serum.
Experimental
Apparatus
All voltammetric measurements on HMDE and GCE were carried out using a CH-instrument electrochemical analyzer (CHI 760). The three electrode system consisted of working electrodes (HMDE; BAS CGME 1108, 0.0145 cm2 and GCE; BAS, MF 2012, 0.071 cm2), reference
electrode (Ag/AgCl, 3 mol L−1 KCl; MF-2052, RE-5B) and
a Pt auxiliary electrode (BAS MW-1034). Prior to each experiment, GCE was polished manually with slurries prepared from 0.01 micron aluminum oxide on a smooth polishing pad (BAS velvet polishing pad), then rinsed with bidistilled water thoroughly.
All pH measurements were made with Thermo Orion model 720A pH ion meter having an Orion combined glass pH electrode (912600; Thermo Fisher Scientific). Bidistilled deionized water was supplied from Ultra-Pure Water System (ELGA as PURELAB Option-S). All the measurements were performed at room temperature.
Reagents and solutions
ALS standard was supplied from Novartis. All the chemicals were of analytical grade.
ALS stock solutions (1.0 × 10⁻³ mol L–1)were prepared
in bidistilled water and kept in the dark in a refrigerator. ALS working solutions were prepared by sufficient dilution of stock solution with selected supporting electrolyte and used within 24 h to avoid decomposition. Phosphoric acid (Riedel-de-Haen, Honeywell Specialty Chemicals Seelze GmbH, Germany), boric acid (Riedel-de-Haen, Honeywell Specialty Chemicals Seelze GmbH, Germany) and acetic acid (Merck KGaA, Darmstadt, Germany) were used in the preparation of Britton-Robinson (BR) solution in which each component had an analytical concentration of 0.04 mol L−1. Bidistilled deionized water was used in
preparations of all the solutions. All the chemicals were used as received.
Procedure
For voltammetric measurements, a known volume of ALS solution was pipetted into 10.0 mL selected
supporting electrolyte. Voltammetric measurements were carried out after degassing with nitrogen for 5 min. The voltammograms were then recorded by scanning the potential towards the positive direction on GCE (oxidation studies) and negative direction on HMDE (reduction studies) vs. reference electrode.
A three-electrode combination system for bulk electrolysis with mercury pool (55.4 cm2) and glassy sieve
as working electrode, coiled platinum wire as an auxiliary electrode (BAS MW-1033 (23 cm)) and Ag/AgCl reference electrode (BAS MF-2052 RE-5B in 3.0 mol L-1 KCl) was
used. In these studies, 25 mL of 1.0×10⁻⁵ mol L−1 solutions
were used for both electrodes.
Preparation of Rasilez® tablets
Rasilez® tablets (Novartis; S0087; EU/1/07/405/002)
were used as pharmaceutical dosage form which contains 150 mg ALS per tablet. Ten tablets were accurately weighed and crushed into a homogeneous fine powder in a mortar and mixed. Approximate weight of one tablet was calculated. A powder sample, equivalent to one tablet, was weighed and transferred into the calibrated flask containing ca. 100 mL of bidistilled water. Flask content was then sonicated for 10 min. After standing at room temperature for ca. 30 min, flask volume was completed to 250.0 mL with bidistilled water. Then, to prepare the final concentration, the required sample from the clear supernatant liquor was withdrawn and quantitatively diluted with the supporting electrolyte solution. Quantitations in all the proposed methods were performed by means of the calibration curve method from the related calibration equations.
Preparation of spiked human serum
Drug-free human serum samples were obtained from healthy volunteers and stored frozen until assay. After thawing, 2.0 mL of an aliquot volume of serum sample were spiked with ALS in BR buffer to maintain a 1 × 10⁻⁴ mol L–1
ALS concentration in serum, and acetonitrile was added to precipitate serum proteins. Then, the mixture was vortexed for 25 s and centrifuged for 10 min at 5000 rpm in order to eliminate serum protein residues. A volume of 2.0 mL from supernatant was taken and added into supporting electrolytes to attain the total volume of 10.0 mL. Sufficient volumes (25, 50, 75, 100, 200, 350, 500, 750 and 1000 µL) from this solution were taken and added to voltammetric cell containing 10.0 mL of supporting electrolyte. Quantitation was performed as described in the preparation of of Rasilez® tablets, section above.
Computational Methodology
Theoretical calculations were performed to support the proposed mechanism for the electrode processes. All the calculations were performed with the Gaussian 09 suite of programs.22 The geometry of ALS was fully optimized
at AM1 level. Frequency calculations were computed at the same level to verify that the optimized geometry is a real minimum on the potential energy surface without any imaginary frequency. Single point energy calculation was done using AM1-optimized geometry at DFT/B3LYP level of theory, with the popular polarized basis set, 6-31+G (d), which adds d functions on heavy atoms.
Results and Discussion
The electrochemical behavior, diffusion and adsorption properties of ALS were studied on HMDE on the reduction side and on GCE on the oxidation side. In these studies, the electrochemical methods such as cyclic voltammetry (CV), differential pulse voltammetry (DPV), square-wave voltammetry (SWV) and bulk electrolysis (BE) at constant potential were used.
Electrochemical behavior of ALS on HMDE
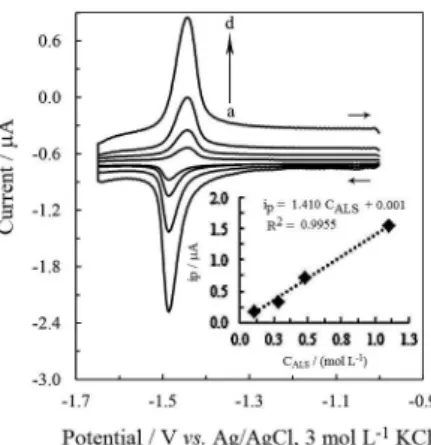
In CV studies on HMDE, a single well-defined reduction peak on negative scan and its oxidation on reverse scan at ca. −1.5 V in BR of pH 10.0 were observed (Figure 2). The height of these peaks increased with increasing ALS concentration (Figure 2 inset). Since anodic peak on reverse scan was observed and the ratio of anodic peak current to cathodic peak current was found to be around one, depending on ALS concentration, the reversible nature of reduction process could be suggested.2-4
Figure 2. Cyclic voltammograms of ALS solutions at different concentrations on HMDE in BR at pH 10.0, scan rate of 0.100 V s−1,
concentrations: (a) 0.15, (b) 0.35, (c) 0.50 and (d) 1.2 mmol L−1. Inset:
The electrochemical behavior was studied in detail. As a first step, the effect of pH on the peak potential and peak current were studied using CV between pH 2.0 and 12.0. As can be seen in Figure 3, the potential of the reduction-oxidation couple on HMDE shifted to more negative potentials with increasing pH between 8.0 and 12.0. This may be caused by the initial protonation of a functional group followed by electron transfer. The couple was not observed at pH values lower than 5.0. Following conclusions may be inferred based on the behavior of peak couple in solutions with lower pHs: (i) lack of electrochemical activity of ALS on such media, or (ii) existence of electrochemical activity having more negative potential than hydrogen evolution on HMDE.
Subsequently, the graph Ep vs. pH was constructed and the peak potential was found to change linearly with the pH obeying the equation: Ep (V) = −0.069 pH – 0.798
(R2 = 0.991) (Figure 3 inset). The slope of this graph
should be equal to 2.303RT(∂/nF)where ∂ is the number of protons involved in the electrode reaction, n is the number of electrons transferred and the rest are commonly known constants.6 In this study, the ∂/n values were calculated
as 1.16, which may be concluded that the exchange of electrons is accompanied by exchange of protons in reduction process. Peak current, peak shape and symmetry were taken into account and finally the optimum pH was selected as 10.0.
Afterwards, the effect of the scan rate on the peak potential was investigated while the ALS concentration was held constant at 0.6 mmol L−1. It is clear from Figure 4
that the potentials of the reduction-oxidation couple change slightly with the scan rate (i.e., the reduction peak potential shifts to 16 mV more negative values as the scan rate was increased 10-fold). The change of the potential with scan rate should be explained by quasi-reversible or irreversible
mechanism. However, as given in the figure inset, the slope of the graph of Ep vs. log ν is negligible, therefore, proposing of a reversible mechanism is more appropriate.
The effect of the scan rate on the peak current was also studied. The graph of peak current vs. square-root of scan rate was found to be linear at relatively high scan rates greater than 0.75 V s−1 (graph not shown). This observation
may be explained by the diffusion effect on the reduction mechanism. In addition, a plot of logarithm of the cathodic peak current (A) vs. logarithm of scan rate (V s−1) gave a
straight line with a slope of 0.77 (R2 = 0.996, Figure 5a). Since
this slope is between 0.5 and 1.0, which are the theoretical values for diffusion-controlled and adsorption-controlled mechanisms, respectively, both diffusion and adsorption contribute to the reduction mechanism.6,7,20 As shown in
Figure 5b, the cathodic and anodic peak currents change linearly as the scan rate increases, obeying the relations ip,c (µA) = −1.621 v (V s−1) − 0.350 (R2 = 0.981) and
ip,a (µA) = 2.276 v (V s−1) + 0.248 (R2 = 0.982), respectively.
Linear dependence of peak current upon the scan rate confirmed adsorption contributions on mass transport and mechanisms.2-5,20,23,24
Furthermore, the anodic peak on reverse scan is symmetric with cathodic peak that indicates adsorption
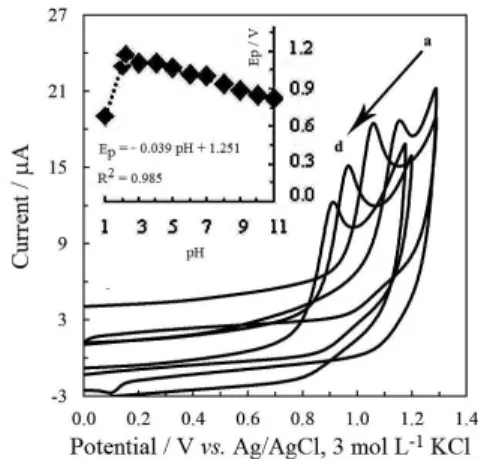
Figure 3. Effect of pH on the peak current and peak potential on HMDE. Inset: peak potential vs. pH.
Figure 4. Influence of the scan rate on the peak current and peak potential on HMDE in BR of pH 10.0 for CALS = 0.6 mmol L-1, scan rates: (a) 0.45,
(b) 0.50, (c) 0.55, (d) 0.60, (e) 0.70 and (f) 0.80 V s−1. Inset: peak potential vs. logarithm of scan rate.
effect.2,3,20 As mentioned before, reduction-oxidation
peak potentials were hardly affected by the scan rate and the ratio of anodic peak current to cathodic peak current was calculated as ca. 1.0. This ratio is concentration dependent and becomes smaller than 1.0 when the ALS concentration is lower than 0.6 mmol L−1. Thus, it may be
concluded that ALS forms a reversible reduction-oxidation couple on HMDE and this electrochemical reaction is controlled mainly by adsorption.
The BE studies at −1.60 V were carried out to find the number of electrons in the reduction-oxidation couple. Although remarkable current flow was observed by applying constant potential for several hours, the peak potential and peak current were not affected by BE. Also, the reduction and oxidation processes have almost the same potential. Thus, the number of electrons involved in the mechanism was not calculated by Faraday’s law. Instead, number of electrons was calculated following the approach and equation given in the literature.2,20 Following
equations for adsorption process in cyclic voltammetry were used:
(1)
and the relation
Q = nFAΓ (2)
where ip is the peak current (A); Q is the charge (C)
calculated by the integration of the area under the peak; n is the total number of electrons transferred in electrode reaction; Γ is the surface coverage of adsorbed substance (mol cm-2); A is the working mercury electrode area
(0.0145 cm2), F is the Faraday constant (96485 C mol-1) and
ν is the scan rate (V s-1). Reorganizing these two equations
gives the equation below:
(3)
In the scan rate studies, n was found between 1.8 and 2.1, hence n was taken as 2. As mentioned before, the ratio of proton to electron was found as 1.16, leading to the conclusion that the same number of protons and electrons are involved in reduction-oxidation cycle per ALS molecule.
Electrochemical behavior of ALS on GCE
An oxidation peak at ca. 1.0 V in BR of pH 8.0 was observed in the CV studies on GCE (Figure 6). Increase of peak current with ALS concentration (Figure 6 inset)
indicates that the oxidation peak should be caused by the ALS molecules. The absence of the cathodic peak on the reverse scan suggests the irreversible nature of oxidation process.
The effect of pH on peak potential and peak current were studied in the same way as on HMDE. The oxidation potential moved towards less positive potentials as pH increased, as depicted in Figure 7. This may be concluded as the initial deprotonation followed by electron transfer.
Peak current, peak shape and symmetry were taken into account and finally the optimum pH was selected as 8.0.
The effect of the scan rate on peak potential was then investigated. The concentration of ALS was held constant at 0.2 mmol L−1. It is clear from the Figure 8 that the oxidation
potential shifts to higher value with increasing scan rate. The relation between the logarithm of scan rate and peak potential was found as Ep (V) = 0.045 log ν + 1.05
(R2 = 0.996) between 10 and 90 mV s−1. This relation
Figure 6. Cyclic voltammograms of the ALS solutions at different concentrations on GCE in BR of pH 8.0, scan rate of 0.100 V s−1,
concentrations: (a) blank, (b) 0.09, (c) 0.30, (d) 0.65 and (e) 1.11 mmol L−1.
Inset: dependence of the peak current on the ALS concentration.
changes to Ep (V) = 0.055 log ν + 1.06 (R2 = 0.996) between
100 and 1500 mV s−1 (Figure 8 inset). The dependence
of the peak potential on the scan rate also supports the irreversible characteristic of the oxidation mechanism.2-5
The effect of the scan rate on the peak current was also studied. Consequently, the peak current (ipa) changes
linearly with the scan rate (Figure 9a) and the slope of the log ipavs. log ν graph was calculated as 0.91 (Figure 9b).
These findings reveal an adsorption effect.
BE at 1.50 V was carried out in triplicate in order to find out the number of electrons in the oxidation mechanism. The BE results were evaluated using Faraday’s law and the number of electrons was found to be 1.87 ± 0.1. Hence, the number of electrons involved in the mechanism was deduced as 2.
Theoretical investigation
An electron flows from the metal electrode into the lowest unoccupied molecular orbital (LUMO) of the molecule under study as the reduction takes place. When the oxidation occurs, an electron from the highest occupied molecular orbital (HOMO) is involved. Consequently,
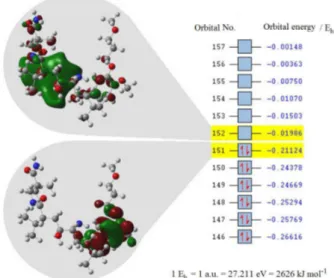
the arrangement of these frontier molecular orbitals is important to determine the most relevant part/atoms of the molecule for the redox reactions. It is therefore necessary to determine HOMO-LUMO of the molecule to support the reduction and oxidation mechanisms in more accurate way. For this reason, the ALS geometry was optimized first, using semi empirical methods (AM1), to predict HOMO and LUMO. These methods are fast but often fail to predict accurate energy values of compounds. Hence, a more accurate basis set was found necessary to obtain energy values that match the experimental accuracy. Accordingly, the single point energy calculations were performed at B3LYP/6-31+G (d). HOMO and LUMO together with their corresponding energies are depicted in Figure 10.
According to Figure 10, the less tightly held electrons in the molecule (HOMO) lie mainly at the benzyl ring, whereas LUMO, which will be the easiest route to the addition of electrons to the molecule, is located around amide centers. Alkoxybenzylic ethers are known to be oxidized to form benzaldehydes and the related mechanisms are postulated in the literature.25,26 The reported mechanisms
is an irreversible process which initiates by the removal of an electron from aromatic ring and involves a total of 2e/2H. Therefore, the oxidation of ALS is also expected to proceed in the same way, agreeing well with both theoretical and experimental findings. Several reduction mechanisms may be proposed for the fact that there are different functional groups on ALS that are available to be reduced. The first one is the protonation of one of the etheric oxygen followed by electron transfer and finally fragmentation into the
Figure 8. Influence of the scan rate on peak current and peak potential on GCE in BR of pH 8.0 for CALS = 0.2 mmol L-1. Inset: peak potential vs. logarithm of scan rate.
Figure 9. (a) Peak current vs. scan rate and (b) logarithm of peak current vs. logarithm of scan rate.
corresponding alcohol and saturated hydrocarbon. But this obviously would be an irreversible reaction which will not meet with our experimental findings. Another mechanism is the reduction of carbonyl groups into their corresponding alcohols without undergoing any fragmentation step. This mechanism is also supported by computational study which shows that the reduction centers are located around amide carbonyl groups. In this mechanism, prior to electron transfer, the protonation of carbonyl oxygen takes place first, indicating that this is a classical acid catalyzed reaction. Reduction of carbonyl group will be more favorable at low pH values. Similarly, protonation step will be more difficult in higher pH values and higher potential will be needed as investigated in the pH studies.
On the basis of CV, BE and ab initio calculations, the mechanism in Scheme 1 is proposed for the oxidation of ALS.
Voltammetric determination of ALS
In an effort to develop a voltammetric method for the ALS determination, the quantitation of peak current resulting from the reduction on HMDE and oxidation on GCE were examined. SWV and DPV techniques were applied first without using stripping mode. Then, due to the adsorptive behavior of ALS and to get more sensitive methods, square-wave cathodic adsorptive stripping voltammetry (SWCAdSV), differential pulse cathodic adsorptive stripping voltammetry (DPCAdSV),
square-wave anodic adsorptive stripping voltammetry (SWAAdSV) and differential pulse anodic adsorptive stripping voltammetry (DPAAdSV) techniques were applied.
The nature of the supporting electrolyte affects the peak response of ALS. Thus, various electrolytes such as BR, phosphate and acetate buffer solutions were examined to find the optimum conditions for quantification of ALS. BR gave the highest peak current and better peak shape than the other buffers. Therefore, BR was selected for further studies. The effect of pH was also investigated. Peak current, peak shape and peak symmetry were taken into account and then the optimum pH was selected as 10.0 and 8.0 for HMDE and GCE, respectively.
For all the techniques, the variations of the peak current and its shape with the instrumental conditions such as frequency (f), scan increment (∆Ei), pulse height (∆E),
accumulation time (tacc) and accumulation potential (Eacc)
were investigated using 0.7 µmol L–1 ALS in a BR under
optimum experimental conditions. As a result, the optimum instrumental parameters were found as follows: f = 25 Hz, ∆Ei = 2 mV and ∆E= 25 mV for SWV; ∆Ei = 5 mV, pulse
width 0.01 s and ∆E = 65 mV with and without stripping mode for DPV.
Accumulation potential and time for AdS techniques were also optimized for both electrodes using 0.5 µmol L−1
ALS. As a result, the values −0.65 V and 60 s were found optimal for HMDE and 0.40 V and 60 s for GCE.
Applying these optimized conditions, the applicability of the proposed voltammetric procedures for the determination
of ALS was investigated. Peak currents were measured as function of the ALS concentration in quintuplicate under the optimized operational parameters and the average of these five serial measurements was used as peak current. The calibration graphs for ALS were obtained to estimate the analytical characteristics of the methods. The results are given in Figure 11 for HMDE and Figure 12 for GCE.
Validation of proposed methods and determination of ALS in tablets and human serum
The proposed voltammetric methods were validated investigating the following parameters: linearityrange, limits of detection (LOD) and of quantitation (LOQ), accuracy, reproducibility and repeatability according to ICH.27
The linearity was checked by preparing standard solutions at more than ten different concentration levels for each proposed method. Five serial measurements were taken for each concentration and subsequent to evaluation of required statistical test (Q-test), the average was used as
peak current of the related concentration. The good linearity of the calibration graphs and the negligible scatter of the experimental points are clearly evident from the coefficient of determination (R2).
LOD and LOQ values of the proposed methods were calculated using equations given in the literature,20 and
results are given in Table 1. For the studies carried on HMDE, all the methods have R2 higher than 0.98.
Repeatability and reproducibility of peak current and peak potential were found satisfactory in all the methods. Among all, SWCAdSV is the most sensitive with low limit of detection, 0.01 µmol L−1. In case of GCE, all the
methods have R2 higher than 0.99 but the repeatability and
reproducibility of peak current were slightly less satisfactory compared to HMDE. Although sensitivity is higher in SWAAdSV, DPAAdSV standard deviation of intercept is lower. Hence, DPAAdSV has the lowest limit of detection (0.142 µmol L−1). For all the methods
on both HMDE and GCE, direct voltammetric methods are advisable to be used in pharmaceutical preparations containing relatively high ALS concentration compared
Figure 12. Calibration dependencies on GCE, (A) SWV, concentrations: (a) 3, (b) 8.6, (c) 12.2, (d) 17.3, (e) 23.7, (f) 38 and (g) 52.3 µmol L−1, and
(B) DPAAdSV, concentrations: (a) 0.23, (b) 0.54, (c) 0.89, (d) 1.42, (e) 3.33, (f) 5.42 and (g) 8.7 µmol L−1.
to biological fluids in which adsorptive stripping methods are applicable.
In order to evaluate the applicability of the proposed methods to pharmaceutical preparations and biological samples, ALS was determined in Rasilez® tablets and
spiked human serum samples.
When a portion of ALS in tablet solution was added to BR at optimum conditions, a cathodic peak on HMDE (ca. −1.4 V) and an anodic peak on GCE (ca. 0.9 V) were recorded. The currents of these peaks increased with
increasing concentration of the tablet solution (Figure 13). ALS was also determined in tablet solutions. As shown in Table 2, mean results of each application for both electrodes lie between 99.5-102.3% (relative standard deviation, RSD < 10.0%). These results indicate the validity of the proposed methods.
Recovery studies in spiked human serum samples were also performed. In these applications, voltammetric base line for ALS-free serum samples in BR solution were taken and no voltammetric signal in the potential
Table 1. Regression data of the calibration curve
Validation parameter HMDE GCE
DPV SWV SWCAdSV DPV DPAAdSV SWV SWAAdSV
Dynamic linearity range / (µmol L−1) 0.3 - 8.1 0.3 - 8.1 0.04 - 1.22 1.5 - 63.5 0.4 - 12.5 3.0 - 52.3 1.6 - 12.5
Slope / (A L mol−1) 0.0092 0.077 0.502 0.049 0.296 0.067 0.839
Intercept / µA 0.006 0.004 0.003 0.254 0.062 0.879 0.639
Coefficient of determination (R2) 0.9972 0.9988 0.9830 0.9947 0.9914 0.9963 0.9929
Standard deviation (SD) of slope 0.0002 0.001 0.027 0.002 0.0012 0.002 0.036
SD of intercept 0.0002 0.002 0.002 0.006 0.010 0.017 0.117
LOD / (µmol L−1) 0.063 0.075 0.012 0.36 0.11 0.75 0.42
LOQ / (µmol L−1) 0.21 0.25 0.04 1.2 0.35 2.5 1.4
Repeatability of peak current, RSD / %a 3.20 4.18 1.45 6.79 9.40 8.02 9.01
Repeatability of peak potential, RSD / %a 4.66 6.09 2.12 8.38 11.60 9.90 11.13
Reproducibility of peak current, RSD / %a 0.26 0.20 0.16 0.56 0.26 0.78 0.15
Reproducibility of peak potential, RSD / %a 0.39 0.29 0.23 0.70 0.32 0.98 0.18 aFor 5 serial measurements. RSD: relative standard deviation.
Figure 13. Voltammograms at various concentration of ALS in tablet solutions and serum samples, (A) DPV on HMDE and (B) SWAAdSV on GCE.
Table 2. Recovery of ALS from Rasilez® tablets
Method Labeled amount / mg Determineda / mg Recoverya / % RSD / %
HMDE DPV 150 153.3 ± 13.4 102.2 ± 8.9 7.0
SWV 150 152.0 ± 6.9 101.3 ± 4.6 3.7
GCE DPV 150 149.3 ± 18.4 99.5 ± 12.3 9.9
SWV 150 153.5 ± 8.2 102.3 ± 5.5 4.3
Table 3. Recovery of ALS from spiked human serum
Method Added / (µmol L-1) Determineda / (µmol L-1) Recoverya / % RSD / %
HMDE SWCAdSV 0.29 0.27 ± 0.01 91.72 ± 3.54 7.01
SWCAdSV 0.88 0.83 ± 0.06 93.63 ± 9.06 6.09
GCE SWAAdSV 1.95 1.91 ± 0.17 97.82 ± 10.91 7.01
DPAAdSV 5.25 5.21 ± 0.16 99.24 ± 3.85 2.44
avalue = average ± ts/√N (N = 5 and at 95% confidence level).
Table 4. Comparison of proposed methods to HPLC method
Compared methods t-value t-critic F-value F-critic
HMDE DPV-HPLC 1.67 2.45 5.43 9.01
SWV-HPLC 1.18 2.45 7.02 9.01 SWCAdSV-HPLC 2.01 2.57 3.12 6.59
GCE DPV-HPLC 1.01 2.45 6.19 9.01
SWV-HPLC 1.25 2.45 3.01 5.41 DPAAdSV-HPLC 0.56 2.57 3.54 6.59 SWAAdSV-HPLC 0.89 2.57 2.82 6.59 range of ALS was found. It was concluded that there is no interference effect of any potential species found in human serum. As can be seen in Table 3, recovery values are in the range of 91.7-99.2%. The differences between spiked and calculated concentrations are insignificant at 95% confidence level.
Tablet analysis results were examined using F and Student’s t-tests to compare the accuracy and precisions of the proposed methods with an independent method found in the literature (Table 4).16 According to F-test results, the
variances between methods were found to be insignificant at 95% confidence level regarding their precision. Besides, according to Student’s t-tests results, it could easily be concluded for all the proposed methods that there is no significant difference between proposed methods and the method found in literature. These results indicate that the content of ALS in the pharmaceuticals could be safely determined using these methods without interference from other substances in the tablet and serum.
Conclusion
Electrochemical characteristics of ALS on HMDE and GCE with the help of ab initio calculations were studied for the first time. Redox properties and electrochemical parameters of drug molecules may be of crucial importance in understanding the mechanism of action against their target/related organs. Combining CV, BE and theoretical calculations, the electrochemical reduction of ALS was proposed to occur at amide carbonyl groups whereas the oxidation is expected to occur at benzylic carbon.
T h e d e t e r m i n a t i o n o f d r u g m o l e c u l e s i n pharmaceuticals and biological samples are also of great importance. In the present study, precise, accurate, rapid and sensitive methods which require neither sophisticated instrumentation nor tedious extraction processes were proposed. Direct voltammetric methods without striping mode can be applied to the detection of ALS in pharmaceutical dosage forms. Besides, adsorptive stripping methods might be more suitable for the determination of ALS in biological media where the detection of lower concentration is required with an insignificant matrix effect.
There is no official method present in any pharmacopoeia related to the determination of ALS. Consequently, the proposed methods have the potential of a good analytical alternative for determining ALS in pharmaceutical formulations and human serum. Also, they can be adopted for pharmacokinetic studies as well as for quality control laboratory studies.
Acknowledgments
The authors are grateful to the financial support from the Ankara University Scientific Research Unit with Grant Number: 11B4240005.
References
1. Frampton, J. E.; Curran, M. P.; Drugs2007, 67, 1767. 2. Wang, J.; Analytical Electrochemistry, 2nd ed.; Wiley-VCH:
New York, USA, 2000.
3. Brett, C. M. A.; Brett, A. M. O.;InElectrochemistry, Principles, Methods and Applications, 3rd ed.; Oxford University Press:
Oxford, UK, 1996.
4. Bard, A. J.; Faulkner, L. R.; Electrochemical Methods,
Fundamentals and Applications, 2nd ed.; John Wiley & Sons
Inc.: Hoboken, USA, 2001.
5. Scholz, F. ; Electroanalytical Methods, 2nd ed.; Springer: Berlin,
Germany, 2010.
6. Taşdemir, İ. H.; Ece, A.; Kılıç, E.; Curr. Pharm. Anal.2012, 8, 339.
8. Gil, E. S.; Andrade, C. H.; Barbosa, N. L.; Braga, R. C.; Serrano, S. H. P.; J. Braz. Chem. Soc.2012, 23, 565.
9. Paiva, Y. G.; de Souza, A. A.; Lima Jr., C. G.; Silva, F. P. L.; Filho, E. B. A.; de Vasconcelos, C. C.; de Abreu, F. C.; Goulart, M. O. F.; Vasconcelos, M. L. A. A.; J. Braz. Chem. Soc.2012,
23, 894.
10. Wrasse-Sangoi, M.; Secretti, L. T.; Rolim, I. F. D. C. M. B.;
Quim. Nova 2010, 33, 1330.
11. Aydoğmuş, Z.; Sarı, F.; Ulu, S. T.; J. Fluoresc.2012, 22, 549. 12. Aydoğmuş, Z.; Luminescence2012, 27, 489.
13. Ashok, S.; Varma, M. S.; Swaminathan, S.; J. Chromatogr. Sci.
2012, 50, 799.
14. Sangoi, M. S.; Wrasse-Sangoi, M.; Renato de Oliveira, P.; Rolim, C.; Steppe M.; J. Sep. Sci.2011, 34, 1859.
15. Sangoi, M. S.; Wrasse-Sangoi, M.; Renato de Oliveira, P.; Todeschini, V.; Rolim, C. M. B.; J. Liq. Chromatogr. Relat. Technol.2011, 34, 1976.
16. Dousa, M.; Brichac, J.; Svoboda, J.; Kalvana, R.; J. Pharm. Biomed. Anal. 2012, 66, 359.
17. Wrasse-Sangoi, M.; Secretti, L. T.; Rolim, C. M. B.; Sangoi, M. S.; Oliveira, P. R.; J. Chromatogr. Sci.2011, 49, 170. 18. Nunes, R. S.; Cavalheiro, E. T. G.; J. Braz. Chem. Soc.2012,
23, 670.
19. Ghoneim, M. M.; Hassanein, A. M.; Salahuddin, N. A.; El-Desoky, H. S.; Elfiky, M. N.; J. Braz. Chem. Soc.2012, 23, 1594.
20. Taşdemir, İ. H.; Akay, M. A.; Erk, N.; Kılıç, E.; Electroanalysis
2010, 22, 2101.
21. Barek, J.; Peckova, K.; Veyskocil, V.; Curr. Anal. Chem.2008,
4, 242.
22. Gaussian 09, Revision C.01, Frisch, M. J.; Trucks, G. W.; Schlegel, H. B.; Scuseria, G. E.; Robb, M. A.; Cheeseman, J. R.; Scalmani, G.; Barone, V.; Mennucci, B.; Petersson, G. A.;
Nakatsuji, H.; Caricato, M.; Li, X.; Hratchian, H. P.; Izmaylov, A. F.; Bloino, J.; Zheng, G.; Sonnenberg, J. L.; Hada, M.; Ehara, M.; Toyota, K.; Fukuda, R.; Hasegawa, J.; Ishida, M.; Nakajima, T.; Honda, Y.; Kitao, O.; Nakai, H.; Vreven, T.; Montgomery, Jr., J. A.; Peralta, J. E.; Ogliaro, F.; Bearpark, M.; Heyd, J. J.; Brothers, E.; Kudin, K. N.; Staroverov, V. N.; Kobayashi, R.; Normand, J.; Raghavachari, K.; Rendell, A.; Burant, J. C.; Iyengar, S. S.; Tomasi, J.; Cossi, M.; Rega, N.; Millam, J. M.; Klene, M.; Knox, J. E.; Cross, J. B.; Bakken, V.; Adamo, C.; Jaramillo, J.; Gomperts, R.; Stratmann, R. E.; Yazyev, O.; Austin, A. J.; Cammi, R.; Pomelli, C.; Ochterski, J. W.; Martin, R. L.; Morokuma, K.; Zakrzewski, V. G.; Voth, G. A.; Salvador, P.; Dannenberg, J. J.; Dapprich, S.; Daniels, A. D.; Farkas, Ö.; Foresman, J. B.; Ortiz, J. V.; Cioslowski, J.; Fox, D. J.; Gaussian 09, Revision C.01; Gaussian, Inc.: Wallingford, CT, USA, 2009.
23. Erdoğan, D. A.; Taşdemir, İ. H.; Erk, N.; Kılıç, E.; Collect. Czech. Chem. Commun. 2011, 76, 423.
24. Ksinger, P. T; Heineman, W. R.; Laboratory Techniques in
Electroanalytical Chemistry, 2nd ed.; Marcel Dekker Inc.: New
York, USA, 1996.
25. Weinreb, S. M.; Epling, G. A.; Comi, R.; Reitano, M.; J. Org. Chem. 1975, 40, 1356.
26. Lukáč, M.; Smoláriková, E.; Lacko, I.; Devínsky, F.; Acta Facult. Pharm. Univ. Comenianae2005, 52, 31.
27. International Conference on Harmonisation of Technical Requirements for Registration of Pharmaceuticals for Human Use; Validation of Analytical Procedures: Text and Methodology Topic Q2(R1); ICH, Geneva, 2005.
Submitted: January 22, 2013