ASSESSING UNCERTAINTIES IN ACCURACY OF LANDUSE CLASSIFICATION
USING REMOTE SENSING IMAGES
Lin-Hsuan Hsiao and Ke-Sheng Cheng
Dept. of Bioenvironmental Systems Engineering, National Taiwan University, Taipei, Taiwan – [email protected]
KEY WORDS: Remote Sensing, Landuse Classification, Uncertainties, Bootstrap Resampling
ABSTRACT:
Multispectral remote sensing images are widely used for landuse/landcover (LULC) classification. Performance of such classification practices is normally evaluated through the confusion matrix which summarizes the producer’s and user’s accuracies and the overall accuracy. However, the confusion matrix is based on the classification results of a set of multi-class training data. As a result, the classification accuracies are heavily dependent on the representativeness of the training data set and it is imperative for practitioners to assess the uncertainties of LULC classification in order for a full understanding of the classification results. In addition, the Gaussian-based maximum likelihood classifier (GMLC) is widely applied in many practices of LULC classification. The GMLC assumes the classification features jointly form a multivariate normal distribution, whereas as, in reality, many features of individual landcover classes have been found to be non-Gaussian. Direct application of GMLC will certainly affect the classification results. In a pilot study conducted in Taipei and its vicinity, we tackled these two problems by firstly transforming the original training data set to a corresponding data set which forms a multivariate normal distribution before conducting LULC classification using GMLC. We then applied the bootstrap resampling technique to generate a large set of multi-class resampled training data from the multivariate normal training data set. LULC classification was then implemented for each resampled training data set using the GMLC. Finally, the uncertainties of LULC classification accuracies were assessed by evaluating the means and standard deviations of the producer’s and user’s accuracies of individual LULC classes which were derived from a set of confusion matrices. Results of this study demonstrate that Gaussian-transformation of the original training data achieved better classification accuracies and the bootstrap resampling technique is a very helpful tool for assessing uncertainties of LULC classification. The uncertainties in classification accuracies were also found to be affected by the sizes of class-specific training samples.
1. INTRODUCTION
Multispectral remote sensing images are widely used for landuse/landcover (LULC) classification. Many LULC applications have been conducted using the Gaussian-based maximum likelihood classifier which assumes multivariate Gaussian distribution for classification features. However, very often radiances or digital numbers of classification features are found to be non-Gaussian. Thus, the Box-Cox transformation has been used to multi-class classification features prior to application of Gaussian-based LULC Classification. Nishii and Morisaki (2001) found that such transformation can yield better classification accuracies. In addition, classification results are generally evaluated based on the classification accuracies (including the producer’s and user’s accuracies) derived from a set of preselected training data. Such evaluation is heavily dependent on the representativeness of the training data and thus inevitably involves certain degree of uncertainties. To address the uncertainties in LULC classification, the bootstrap resampling technique has been applied for assessing the uncertainties in LULC classification (Weber and Langille, 2007). In this study, we firstly demonstrate that Gaussian-transformation of classification features can significantly improve the classification accuracies of Gaussian-based maximum likelihood classifier (GMLC). Secondly, the bootstrap resampling technique was implemented to generate a large set of training data which were then used in Gaussian-based LULC classification. Uncertainties in LULC classification were then assessed by analyzing the confusion matrices derived from resampled training data set.
2. METHODS
2.1 Classification method
Gaussian-based maximum likelihood classifier (GMLC) is applied in this study. The GMLC assumes the classification features jointly form a multivariate Gaussian distribution. The likelihood that a pixel belonging to class i has values of feature vector x can be represented by the following multivariate Gaussian density:
(1)
where x represents the feature vector which is a vector of digital numbers (DNs) for a pixel, ωi represents the class i, k is the total
number of classes, d represents the dimension of feature space,
d=3 in the study (G, R, NIR bands), mi and Σi are mean vector
and covariance matrix of class i. Taking into account the a priori probabilities of individual classes, the probability that a pixel having feature vector x belongs to class i can be expressed by
(2)
By the decision rule in maximum likelihood classification with the assumption of multivariate Gaussian distribution, the discriminate function, Gi(x), can be stated as:
(3) A pixel with DN value x is then assigned to class ωi where Gi(x) is the maximum within all classes.
2.2 Transformation method
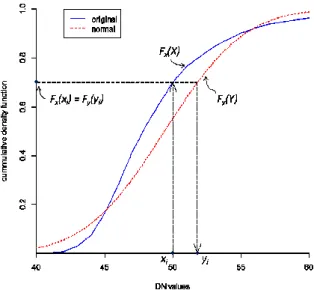
Whereas as, in reality, many features of individual classes have been found non-Gaussian distribution. Directly using original data for classification would certainly affect the results. To correspond to the assumption of multivariate Gaussian distribution and also retain the characteristics of each class, we transformed the original data to normal distribution with the same mean and standard deviation. In the sturdy, each class has three the marginal distributions. For each marginal distribution, the sample mean and standard deviation were calculated as the parameters to establish a normal distribution given the mean and standard deviation. Empirical cumulative density function (ECDF) of original data (Fx(x), blue line in Figure 1) and the CDF of the established normal distribution (Fy(Y), red dash line
in Figure 1) were used in transformation of training data. For a
specific sample from training data, we knew the class it belonged to, original DN value in specific band, for example, xi, and the corresponding ECDF, Fx(xi). We then find a transformed vales, yi whose corresponding CDF, Fy(yi) equals the ECDF,
Fx(xi). By this method, original training data set of each class (x1,
x2, …, xn) can be transformed to new data set (y1, y2, …, yn).
Figure 1. The way of transformation.
Figure 2 indicates the distributions of training data of Red band.
Five histograms in the left hand side are derived by original data and the histograms in the right hand side show distributions of the five classes after respective normalizing transformations. After transforming marginal distributions of individual class to normal distribution, jointly multivariate distribution of individual classes were reformed. Therefore, we can use transformed data which formed multivariate normal distribution to conduct LULC classification by GMLC.
Forest
DN value 40 45 50 55 60 65 70
0
6
0
0
Water
DN value 55 60 65 70 75 80 85
0
1
5
0
Building
DN value 50 100 150 200 250
0
2
0
0
Grass
DN value 60 70 80 90 100 110
0
1
0
0
Road
DN value 60 80 100 120 140 160 180
0
4
0
0
Forest
DN value 35 40 45 50 55 60 65
0
6
0
0
Water
DN value
50 60 70 80 90
0
1
5
0
Building
DN value 0 50100 200 300
0
3
0
0
Grass
DN value 40 50 60 70 80 90 100
0
1
5
0
Road
DN value 60 80 100 120 140
0
3
0
0
Figure 2. Histograms of Red band of original data(left) and transformed data(right) in the five classes: Forest, Water, Building, Grass and Road.
2.3 Bootstrap resampling to access uncertainty
The bootstrap method is an extensive computational approach to uncertainty estimation based on sampling and statistical estimation. In theory, resampling is done to generate distributions similar to popula tion sampling. It is a powerful tool, especially when only a small data set is used to predict the behavior of systems or processes.
The classification accuracies are heavily dependent on the representativeness of the training data set. It is difficult to have many training data s sets in practice to assess the uncertainty in classification. Therefore, to simulate the uncertainty result from sampling of training data, bootstrap technique was applied to the training data in order to generate a large set of multi-class resampled training data. We firstly selected one set of training data with 22010 samples including five classes (the numbers of individual class are forest=7005, water=2771, building=5956, grass=2445, and road=3924). To generate a new set of data, for each class, we randomly selected one sample point from the original training data set at one time and put it back after selecting. Repeat the experiment in time of the same numbers as training samples. For each iteration, a new resampled training data set can be generated, and the numbers of each class and total number were the same as original training data. After generating 1000 sets of training data, classification was implemented for each data set using the GMLC. Consequently, 1000 confusion matrices with user’s accuracies, producer’s accuracies and overall accuracies were gained and used to evaluate the uncertainty of performance in classification. International Archives of the Photogrammetry, Remote Sensing and Spatial Information Sciences, Volume XL-2/W1, 2013
3. STUDY AREA AND DATA
3.1 ALOS sensor system
The study conducted in Taipei City and its vicinity. Taipei is a highly developed metropolis. There are most residential area and office buildings, but there are mountains and hills in the northeast and the southeast of city. Figure 3shows true-color satellite image of the study area. The size of study area is about 362km2 (19km×19km). The satellite image was preprocessed for radiometric and geometric corrections by the Japan Aerospace Exploration Agency (JAXA).
The image of the study was acquired by the AVNIR-2 sensor onboard the ALOS satellite on 15-Feb-2009 and with a spatial resolution of 10m×10m. AVNIR-2 sensor is a visible and near infrared radiometer for observing land and coastal zones, and it provides multispectral images, respectively, in four spectral bands: blue (Band 1, 0.42- 0.50µm), green (Band 2, 0.52- 0.60µm), red (Band3, 0.61- 0.69µm), and near infrared (Band 4, 0.76- 0.89µm). In the study, the raw radiance or digital values (DN values) of imagery in three bands, green (G), red (R) and near infrared (NIR), are used as classification features.
Figure 3. ALOS satellite imagery and the area used in this study. © ALOS Imagery Copyright (15-Feb-2009)
3.2 Training data in Landuse/Landcover classification
For the purpose of landcover analysis, top-level major landcover classes are considered. In this study, five classes, including water, forest, grass, building and road, were set up for LULC classification. Among these classes, water represents rivers and ponds. Forest represents land covered by forest, trees, and shrubs. Grass includes areas cover by grass, vegetable crops and wetland. Building mainly includes official and commercial buildings and residences. Road represents paved road including highways and main roads in Taipei city and highways.
Training data of each class was chosen and corroborated using field observations or aerial imagery from Google Earth and Google Map. Total number of training data is 22101 pixels, and the numbers of each class were decided based on the area percentage of individual class in the study area: forest= 7005 (32%), water= 2771 (13%), building= 5956 (27%), grass= 2445 (11%), and road= 3924 (17%). Also, DN values of training data from three ALOS spectral bands (G, R and NIR bands) were chosen as classification features. By the mean vectors and covariance matrices of training data, the multivariate distribution of each class can be established and then be used in further classification.
4. RESULTS AND DISCUSSION
4.1 Classification of Transformation
Using the original data and transformed data, we analyzed the effect of normalizing transformation to classification accuracy. Table 1 and Table 2 summarize classification results of using original training data and transformed data. The confusion matrix demonstrates that the confusion mainly occur on classes between Building and Road and classes between Forest and Grass. The result illustrates a scenario where one or more classification features exhibit overlapping spectral signatures. Also, the producer’s accuracy of Building and the use’s accuracy of Grass and Road are worse than other classes.
Table 1. Confusion matrix of original training data
*overall accuracy
Table 2. Confusion matrix of transformed training data
*overall accuracy
By comparing the two matrices, the accuracies of transformed data became better in all classes. The overall accuracy increase from 90.24% to 95.58%, and the user’s accuracies of Grass increase most obviously from 77.1% to 90.46%. It is seen that the transformation of training data improve the performance of classification, especially the classes with worse accuracy originally.
4.2 Uncertainty assessment using Bootstrap resampling
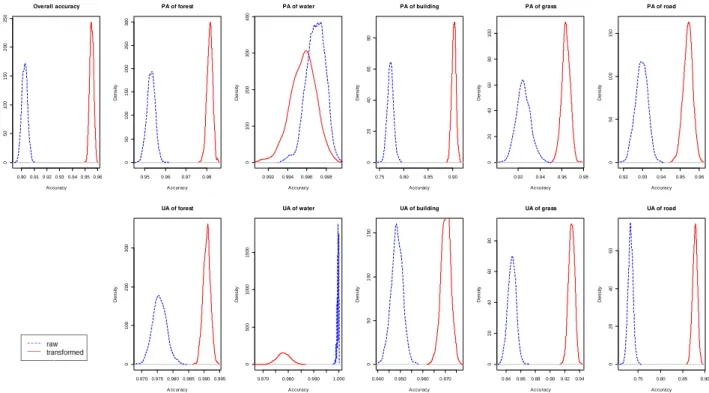
1000 sets of bootstapping resampled training data respectively from original data and transformed data are used to implement the GMLC. A set of producer’s and user’s accuracies of individual LULC classes which were derived from a set of confusion matrices. Figure 4 shows the difference between the distributions of accuracies before transformation and those after transformation. Besides of Water, the means of accuracies of all classes increased after transformation, and the standard deviations of all accuracies had no significant difference. It interprets that the performance of uncertainty of classification was not affected by transformation.
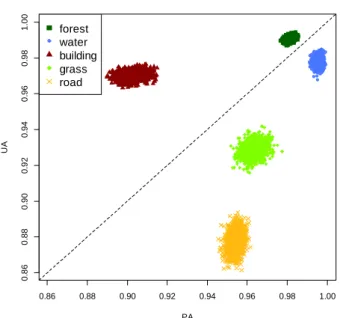
Figure 5 and Figure 6 present the producer’s and user’s accuracies of five individual classes after transformation. The accuracies of Water and Forest are greater than other classes’ and the uncertainties of these two classes are less. In contrast, the less means and greater standard deviations of accuracies of Building, Road and Grass since the characteristics of training data in these classes are more heterogeneous in the study area. Figure 7 shows the relation between producer’s and user’s accuracy of individual classes. We can easily realize the uncertainties in classification by the distributions. As same as the previous results, Building, Grass and Road have more significant uncertainties. In addition, by separating the classes by a line in slope of 1, it demonstrates that for Water, Grass and Road, producer’s accuracies are greater than user’s accuracies.
0.88 0.90 0.92 0.94 0.96 0.98
0 1 0 0 2 0 0 3 0 0 4 0 0 Producer's Accuracy(transformed) Accuracy d e n s it y
forest water building grass road
Figure 5.Distribution of producer’s accuracy with five classes
0.88 0.90 0.92 0.94 0.96 0.98
0 1 0 0 2 0 0 3 0 0 4 0 0 5 0 0 User's Accuracy(transformed) Accuracy d e n s it y
forest water building grass road
Figure 6.Distribution of user’s accuracy with five classes. Figure 4. Comparison of classification results, including overall accuracy(OA), producer’s accuracies(PA), and user’s accuracies(UA) of individual class between original data and transformed data.
0.90 0.91 0.92 0.93 0.94 0.95 0.96
0 5 0 1 0 0 1 5 0 2 0 0 2 5 0 Overall accuracy Accuracy D e n s ity
0.95 0.96 0.97 0.98
0 5 0 1 0 0 1 5 0 2 0 0 2 5 0 3 0 0
PA of forest
Accuracy D e n s ity
0.992 0.994 0.996 0.998
0 1 0 0 2 0 0 3 0 0 4 0 0
PA of water
Accuracy D e n s ity
0.75 0.80 0.85 0.90
0 2 0 4 0 6 0 8 0
PA of building
Accuracy D e n s ity
0.92 0.94 0.96 0.98
0 2 0 4 0 6 0 8 0 1 0 0
PA of grass
Accuracy D e n s ity
0.92 0.93 0.94 0.95 0.96
0 5 0 1 0 0 1 5 0
PA of road
Accuracy D e n s ity
0.970 0.975 0.980 0.985 0.990 0.995
0 1 0 0 2 0 0 3 0 0
UA of forest
Accuracy D e n s ity
0.970 0.980 0.990 1.000
0 5 0 0 1 0 0 0 1 5 0 0
UA of water
Accuracy D e n s ity
0.940 0.950 0.960 0.970
0 5 0 1 0 0 1 5 0
UA of building
Accuracy D e n s ity
0.84 0.86 0.880.90 0.92 0.94
0 2 0 4 0 6 0 8 0
UA of grass
Accuracy D e n s ity
0.75 0.80 0.85 0.90
0 2 0 4 0 6 0
UA of road
Accuracy D e n s ity
On the other hand, user’s accuracies are greater than producer’s accuracies of Building and Forest.
0.86 0.88 0.90 0.92 0.94 0.96 0.98 1.00
0
.8
6
0
.8
8
0
.9
0
0
.9
2
0
.9
4
0
.9
6
0
.9
8
1
.0
0
Producer's & User's Accuracy(transformed)
PA
U
A
forest water building grass road
Figure 7. Relation between user’s accuracy and producer’s accuracy with five classes.
5. CONCLUSIONS
Through the numerical results, a simple method for Gaussian-transformation of the original training data gave better performance in GLMC. This pre-processing approach for classification would be useful for any classification methods under the assumption of multivariate Gaussian distribution. By the bootstrap resampling technique, the uncertainties in classification accuracies were found to be affected by the sizes of class-specific training samples. Furthermore, assessing the uncertainties of classification requires a sufficient number of observations per class to be created that retain statistical power of analysis; thus, the bootstrap resampling technique can also be applied in this process and to improve the characterization of classification’s uncertainty by analyzing the overall, producer’s and user’s accuracies of each class generating from a set of confusion matrices.
6. REFERENCE
Strahler, Alan H., 1980. The use of prior probabilities in maximum likelihood classification of remotely sensed data.
Remote Sensing of Environment, 10.2: 135-163.
Nishii, R. and Morisaki, Y., 2001. Spatial discriminant analysis based on power-elliptic distributions and power transformations. Geoscience and Remote Sensing Symposium.
IGARSS'01. IEEE 2001 International, Vol. 7, pp. 2991-2993.
Albeanu, G., 2007. On using bootstrap approach for uncertainty estimation. In:G. Guslicov (ed.), Proceedings of the 1st
International Proficiency Testing Conference, pp. 221-229.
Weber, K.T. and Langille, L., 2007. Improving classification accuracy assessments with statistical bootstrap resampling techniques. GIS Science and Remote Sensing, 44 (3):237-250. Hung, W.C., Chen, Y.C. and Cheng, K.S., 2010. Comparing landcover patterns in Tokyo, Kyoto, and Taipei using ALOS multispectral image. Landscape and Urban Planning, vol. 97.2, pp.132 -145.