______________________________
Corresponding author: N. Deleti , University of Pristina, Faculty of Agriculture, Zubin Potok, [email protected], 028-461-108, 0642265279
UDC575:633.15 DOI: 10.2298/GENSR0902207D Original scientific paper
THE CHANGE OF GENETIC AND PHENOTYPIC VARIABILITY OF YIELD COMPONENTS AFTER RECURRENT SELECTION OF MAIZE
Nebojša DELETI , Slaviša STOJKOVI , Slaviša GUDŽI , and Milan BIBERDŽI
University of Priština, Faculty of Agriculture Kosovska Mitrovica – Zubin Potok
Deletic N., S. Stojkovi , S. Gudži , and M.Biberdži (2009): The change of genetic and phenotypic variability of yield components after
recurrent selection of maize.– Genetika, Vol. 41, No. 2, 207 - 214.
This paper deals with 31 SSD lines from ZP-Syn-1 C0 and 37
from ZP-Syn-1 C3 maize populations. After line selection and seed
can suggest indirectly to a total variability narrowing after three cycles of recurrent selection.
Key words: cluster analysis, genetic variance, maize, yield
components
INTRODUCTION
The crucial question of recurrent selection is how to reach selection progress together with conservation of genetic variability and without a loss of desirable alleles determining the most important traits? These processes are opposite each other by nature, so the solution ought to be a compromise between them. In order to reach an optimal level of the compromise, the ideal solution would be to explore quantitative-genetic parameters of every new population, and to follow them through the selection process, so the methods and intensity of selection can be properly chosen. Nothing ideal is real in practice, so each particular study can contribute to establishing of general rules. This is especially important in the terms of additive variance, because it has the highest effect to the most important traits, and often could be masked by dominant and epistatic effects (DELETI , 2003; DELETI et al., 2005; DELETI et al., 2006).
Recurrent selection is a long-term process, so the possibility of its duration reduction is often discussed. Advance in improvement of particular traits
per se and accumulation of desirable alleles for those traits are directly dependent
on selection intensity. However, there is a need to be cautious with application of a high selection pressure for getting better gain from selection, because genetic variability can be significantly decreased that way (HALLAUER and MIRANDA, 1988; ROŠULJ, 1999), and genetic drift also can be observed (GUZMAN and
LAMKEY, 1999; CEPADA et al., 2000). So the usual way is to apply lower selection intensity in earlier selection cycles, and to increase it after few selection cycles.
MATERIAL AND METHODS
The ZP Syn 1 maize population was used for the study. It was created by recombination of eight lines – five domestic ones from local populations, one from Lancaster germ-plasm, one Argentinian line from population Colorado, and one line from BS12C5 (ALPH) population. After line recombination and forming of
ZP-Syn1-C0 population, the three cycles of half-sib recurrent selection were done, with
selection intensity of 5%, and line A-632 was used as a narrow-base tester (former version of B-14 line from BSSS).
After 150 randomly chosen plants per each selection cycle (C0 and C3)
were selfed, selfing continued according to SSD (Single Seed Descent) method to a practically complete homozigousness (12-14 generations). Number of lines decreased during selfing process, mostly because of random factors related with the applied method, and, in some extent, because of the lethal effect of some recessive alleles, so the final number of the studied lines was 31 in C0 cycle and 37
Krusevac and Zemun Polje, in RCB design, with three replications. Genetic and phenotypic variances of the all studied traits and their standard errors were calculated.
Cluster analysis of the lines from both cycles was carried out according to four (grain yield, plant and ear height, as well as root and stalk lodged plants percent) and five (grain yield and yield components) traits. The analysis was based on mean values of the lines per years and locations. Clustering was done by single interconnectedness, and the distances were Euclidian, according to GOWER and ROSS (1969).
RESULTS AND DISCUSSION
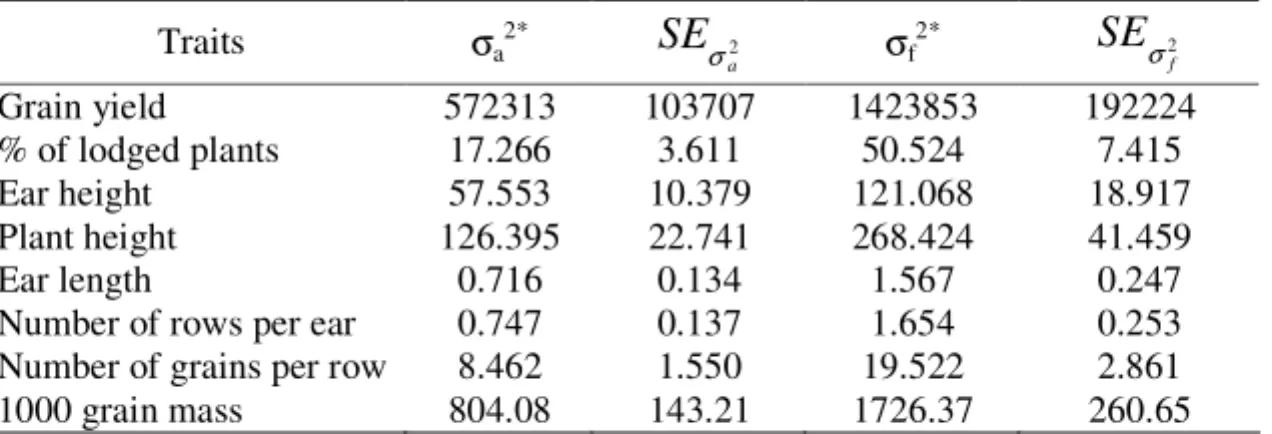
The all studied traits in lines from both cycles showed significant additive variances, because they were more than double greater regarding respective standard errors, which is, according to FALCONER (1989), the criterium of significance for genetic and phenotypic variance (tab. 1 and 2). Phenotypic variance showed similar tendency, so the all calculated values for lines from both cycles of recurrent selection were significant (tab. 2). It can be seen that both line groups represent a good material for creating new selection cycles from the best ones of them and proceeding process of maize recurrent selection.
Table 1. Components of variance in lines from ZP-Syn-1 C0 population
Traits σa2* 2
a
SE
σ σf
2*
2 f
SE
σGrain yield 670385 121744 1901875 1152585
% of lodged plants 73.212 14.090 207.989 137.108
Ear height 85.711 15.400 193.846 140.789
Plant height 187.544 33.406 410.226 304.115
Ear length 1.273 0.229 3.180 2.122
Number of rows per ear 1.757 0.313 3.886 2.853
Number of grains per row 10.835 1.945 27.201 17.989
1000 grain mass 600.90 108.38 1452.28 997.98
* - σg2 and σf2 are significant if have at lest double value than their standard errors.
Table 2. Components of variance in lines from ZP-Syn-1 C3 population
Traits σa2* 2
a
SE
σ σf
2*
2 f
SE
σGrain yield 572313 103707 1423853 192224
% of lodged plants 17.266 3.611 50.524 7.415
Ear height 57.553 10.379 121.068 18.917
Plant height 126.395 22.741 268.424 41.459
Ear length 0.716 0.134 1.567 0.247
Number of rows per ear 0.747 0.137 1.654 0.253
Number of grains per row 8.462 1.550 19.522 2.861
1000 grain mass 804.08 143.21 1726.37 260.65
However, among all quantitative-genetic parameters, we paid a special attention to a possible significant reduction of additive variance for yield components after three cycles of HS recurrent selection, with selection intensity of 5%. Hartley tests revealed that differences between the cycles, regarding both additive and phenotypic variances, were significant for ear length only, and highly significant for number of grain rows per ear and percent of root and stalk lodged plants. It means that only those three traits showed a significant reduction of additive and phenotypic variance, while the other traits did not changed significantly under selection.
After analysis of additive and phenotypic variability, we tried to reach a broader understanding of the investigated traits variability in lines from two cycles of recurrent selection. Thus, genotypes from the zero and the third selection cycles were clustered according to variation similarity of several traits by multivariate cluster analysis, and the distances among them were determined. Comparison of distances among the majority of lines between the cycles can provide useful information about general variability trends of the traits used for clustering, and group definition and distance between them could point to the existence of line random drift, which was expected here because of the applied SSD method of line creation.
Parameters used for clustering of genotypes ought to be carefully chosen. It is possible to observe variation of one or more traits in different environments, and it is also possible to observe variation similarity of several traits. By the rule, similarity in variation of larger number of traits provides more reliable clustering, but, because of increase of the experimental error, main clustering trends can be hardly visible. That was the reason we used four (% of root and stalk lodged plants, plant and ear height, grain yield) and five traits (grain yield and yield components) for clustering, and the results could be seen in graphs 1-4.
Graph 1. Cluster analysis of lines from ZP-Syn-1 C0 population on the basis of four
traits
Graph 2. Cluster analysis of lines from ZP-Syn-1 C3 population on the basis of four
traits
Mean value per year and location
Graph 3. Cluster analysis of lines from ZP-Syn-1 C0 population on the basis of five
traits
Graph 4. Cluster analysis of lines from ZP-Syn-1 C3 population on the basis of five
traits
Mean value per year and location
CONCLUSION
On the basis of the presented results one can conclude the following:
• Values of additive and phenotypic variances were significant for the all
studied traits in both selection cycles.
• After three cycles there was a significant reduction of additive variability
for percent of root and stalk lodged plants, ear length and number of grain rows per ear. Reduction of those values for the other traits was not significant. Phenotypic variances showed the same tendency.
• Cluster analysis showed roughly double distances between genotypes and
groups in the zero cycle, and better group definition in the third cycle. It indirectly points to a narrowing of total variability after three cycles of recurrent selection.
Received June 02tn, 2009
Accepted August 18th, 2009
REFERENCES
CEPEDA, M. C., C. L. DE SOUZA JR, S.PANDEY, L. N. LEON (2000): Genic and genetic drift effects associated with intrapopulation recurrent selection in SA3 maize population. Pesquisa Agropecuária Brasileira, 35, 8, 1585-1594.
DELETI , N. (2003): Promena aditivne varijanse komponenti prinosa nakon rekurentne selekcije kukuruza (Zea mays L.). Doktorska disertacija, Poljoprivredni fakultet, Univerzitet u Novom Sadu.
DELETI , N., S.STOJKOVI , V. URI , S.GUDŽI , M.BIBERDŽI (2005): The effect of a high selection intensity on the change of maize yield components' additive variance. Genetika, 37, 1, 71-76. DELETI , N., S.STOJKOVI , V. URI (2006): Uticaj komponenti prinosa na prinos zrna u razli itim
ciklusima rekurentne selekcije kukuruza. Selekcija i semenarstvo, 12, 3-4, 21-27. FALCONER, D. S. (1989): Introduction to quantitative genetics. Longman Inc., London and New York. GOWER, J. C, G. J. C. ROSS (1969): Minimum spanning trees and single linkage cluster analysis. Applied
Statistics, 18, 56-64.
GUZMAN, P. S., K. R. LAMKAY (1999): Effective population size and response to recurrent selection in maize. Philippine Journal of Crop Science, 24, 1, 5-6.
HALLAUER, A.R., J.B. MIRANDA (1988):Quantitative genetics in maize breeding. (2nd ed.). Iowa State
University Press, Ames, Iowa, USA.
PROMENA GENETSKE I FENOTIPSKE VARIJANSE KOMPONENTI PRINOSA NAKON REKURENTNE SELEKCIJE KUKURUZA
Nebojša DELETI , Slaviša STOJKOVI , Slaviša GUDŽI i Milan BIBERDŽI
Univerzitet u Prištini, Poljoprivredni fakultet Kosovska Mitrovica – Zubin Potok
I z v o d
U radu je ispitivana 31 SSD linija iz ZP-Syn-1 C0 i 37 iz ZP-Syn-1 C3
populacije kukuruza. Nakon odabira i umnožavanja semena linija u prvoj godini, ogledi su obavljeni tokom dve godine u Kruševcu i Zemun Polju, po RCBD metodi sa tri ponavljanja. Izra unata je aditivna i fenotipska varijabilnost komponenti prinosa, a ura ena je i procena suženja varijabilnosti na osnovu multivarijacione
cluster analize. Razlike izme u aditivnih i fenotipskih varijansi izme u ciklusa su
bile zna ajne samo za dužinu klipa, a visoko zna ajne za broj redova zrna i procenat poleglih i slomljenih biljaka. To zna i da je samo kod ova tri svojstva došlo do zna ajnog smanjenja aditivne i fenotipske varijanse, dok za ostala svojstva nije bilo zna ajnih promena pod uticajem selekcije. Cluster analiza je pokazala, po svim kriterijumima, dvostruko ve e distance izme u genotipova i grupa u nultom ciklusu, a bolju definisanost grupa u tre em ciklusu. Ovo nam na posredan na in ukazuje na suženje ukupne varijabilnosti nakon tri ciklusa reku-rentne selekcije.