Genetics of Type 2 Diabetes in a Colombian Population
Desmond D. Campbell1", Maria V. Parra1,2", Constanza Duque1,2", Natalia Gallego2
, Liliana Franco2, Arti Tandon3, Ta´bita Hu¨nemeier4, Ca´tira Bortolini4, Alberto Villegas2, Gabriel Bedoya2,
Mark I. McCarthy5,6,7, Alkes Price8, David Reich3,9, Andre´s Ruiz-Linares1*
1Department of Genetics, Evolution and Environment, University College London, London, United Kingdom,2Laboratorio de Gene´tica Molecular, Universidad de Antioquı´a, Medellı´n, Colombia,3Department of Genetics, Harvard Medical School, Boston, Massachusetts, United States of America,4Departamento de Gene´tica, Universidad Federal do Rio Grande do Sul, Porto Alegre, Brazil,5Oxford Centre for Diabetes, Endocrinology and Metabolism, University of Oxford, Churchill Hospital, Oxford, United Kingdom,6Wellcome Trust Centre for Human Genetics, University of Oxford, Oxford, United Kingdom,7Oxford NIHR Biomedical Research Centre, Churchill Hospital, Oxford, United Kingdom,8Department of Epidemiology, Harvard School of Public Health, Boston, Massachusetts, United States of America,9Broad Institute of Harvard and MIT, Cambridge, Massachusetts, United States of America
Abstract
The ‘‘thrifty genotype’’ hypothesis proposes that the high prevalence of type 2 diabetes (T2D) in Native Americans and admixed Latin Americans has a genetic basis and reflects an evolutionary adaptation to a past low calorie/high exercise lifestyle. However, identification of the gene variants underpinning this hypothesis remains elusive. Here we assessed the role of Native American ancestry, socioeconomic status (SES) and 21 candidate gene loci in susceptibility to T2D in a sample of 876 T2D cases and 399 controls from Antioquia (Colombia). Although mean Native American ancestry is significantly higher in T2D cases than in controls (32% v 29%), this difference is confounded by the correlation of ancestry with SES, which is a stronger predictor of disease status. Nominally significant association (P,0.05) was observed for markers in: TCF7L2, RBMS1, CDKAL1, ZNF239, KCNQ1andTCF1and a significant bias (P,0.05) towards OR.1 was observed for markers selected from previous T2D genome-wide association studies, consistent with a role for Old World variants in susceptibility to T2D in Latin Americans. No association was found to the only known Native American-specific gene variant previously associated with T2D in a Mexican sample (rs9282541 inABCA1). An admixture mapping scan with 1,536 ancestry informative markers (AIMs) did not identify genome regions with significant deviation of ancestry in Antioquia. Exclusion analysis indicates that this scan rules out,95% of the genome as harboring loci with ancestry risk ratios.1.22 (at P,0.05).
Citation:Campbell DD, Parra MV, Duque C, Gallego N, Franco L, et al. (2012) Amerind Ancestry, Socioeconomic Status and the Genetics of Type 2 Diabetes in a Colombian Population. PLoS ONE 7(4): e33570. doi:10.1371/journal.pone.0033570
Editor:Dennis O’Rourke, University of Utah, United States of America
ReceivedOctober 19, 2011;AcceptedFebruary 15, 2012;PublishedApril 17, 2012
Copyright:ß2012 Campbell et al. This is an open-access article distributed under the terms of the Creative Commons Attribution License, which permits unrestricted use, distribution, and reproduction in any medium, provided the original author and source are credited.
Funding:The authors are very grateful to the volunteers that contributed samples for this project. AP was supported by a Ruth Kirschstein National Research Service Award from the National Institutes of Health (NIH). This work was partially funded by discretionary funding from Harvard Medical School (to DR), NIH grants NS043538 (to AR-L) and DK073818 (to DR), Colciencias grants 1115-04-16451 and 1115-04-012986 (to GB and AV), and a Universidad de Antioquı´a grant [CODI/sostenibilidad 9889-E01321] (to GB and AV). The funders had no role in study design, data collection and analysis, decision to publish, or preparation of the manuscript.
Competing Interests:The authors have declared that no competing interests exist. * E-mail: a.ruizlin@ucl.ac.uk
"These authors are joint first authors on this work.
Introduction
The public health burden of T2D in Latin America is very high and increasing. About 6% of the adult population in the region (over 16 million people) suffers from the disease and this figure is expected to rise to about 33 million by 2025 [1–3]. A number of studies indicate that there is a higher prevalence of T2D in US Native Americans and ‘‘Latinos’’ (or ‘‘Mestizos’’, i.e. populations mostly of mixed Native American and European ancestry) than in European-Americans, and that disease risk increases with a higher proportion of Native ancestry [4–8]. These observations led to the proposal of the ‘thrifty genotype’ hypothesis which posits that metabolic adaptation to a low calorie intake in Native American s has made people with higher Native American ancestry especially prone to a range of metabolic disorders when exposed to a lifestyle including a high calorie diet and little exercise [9–]. Despite the
intense interest that this hypothesis has generated its proposed genetic basis remains undefined.
We recently evaluated the genetic ancestry of a sample of T2D cases and controls from a South American mestizo population (Antioquia, Colombia) [12]. Consistent with the existence of Native American-specific genetic susceptibility factors, Antioquian T2D cases show increased Native American ancestry relative to controls from the same population. However, accounting for socioeconomic status rendered this difference in ancestry non-significant, suggesting that environmental factors could at least partially explain the association of Native ancestry and T2D disease risk [12].
candidate region SNPs (chosen mostly from recent GWAS) and performed a genome-wide admixture mapping scan aimed at detecting loci carrying Native American T2D susceptibility alleles (as proposed by the thrifty genotype hypothesis). Our results: i) underline the high impact of SES on T2D susceptibility, ii) are consistent with an important role for Old World T2D genetic susceptibility variants in Latino/mestizo populations and iii) fail to provide support for the thrifty genotype hypothesis.
Results
Study Sample and Disease Covariates
The mean Native American ancestry of Antioquian cases/ controls was estimated as 32%/29% resulting in a significant association of ancestry with affection status (cLVS1 = 20.39 P = 1.6661027). SES is also strongly predictive of affection status
(cSES= 20.2 P = 8.461024), and shows a significant correlation with Native ancestry: (R = 20.19 P = 6.63610211, Figure 1). When both SES and ancestry are considered together the association of ancestry with disease is no longer significant (cLVS1 = 0.13 P = 0.58), while the significance of the disease association with SES increases (cSES = 20.46 P = 6.756102
9
). BMI is also strongly correlated with SES (Figure 2) but the association of BMI with disease remains highly significant even after accounting for SES and ancestry (cBMI = 0.09241, P = 1.3461026). One of the markers examined here (rs9939609) is located in the FTO gene region and has been robustly associated with BMI in previous studies[7]. The Antioquian sample showed a trend towards higher BMI with increasing number of copies of the previously reported associated allele, although not reaching statistical significance (TT: 26.35, AT:26.74, AA: 26.82; P = 0.14).
Candidate Marker Association
None of the markers examined was found to be monomorphic in Antioquia, but three have a reduced polymorphism with minor allele frequencies ,5% (rs1801282 in PPARG, rs9282541 in
ABCA1and the intergenic marker rs9300039; Figure 3). Based on the frequencies observed in Antioquian controls (Figure 3) and considering the risk alleles and ORs reported in the literature [13– 18], the sample examined here has an average power of 41% (range 9–97%) for detecting association at a 5% significance level. Logistic regression incorporating SES, BMI and ancestry as covariates finds nominally significant association (P,0.05) for six of the 21 markers typed (Table 1, Figure 3): rs7903146 (TCF7L2), rs6718526 (RBMS1), rs9465871 (CDKAL1), rs9326506 (ZNF239), rs2237892 (KCNQ1), and rs1169288 (TCF1). All these gene regions, except ZNF239, are now considered validated T2D disease loci[19]. P-values at two of these markers exceed thresholds for significance assuming a conservative Bonferroni correction for multiple testing (Table1): rs7903146 (TCF7L2) and rs6718526 (RBMS1). When considering the 20 markers selected from GWAS hits, 14 show ORs higher than 1 for the previously reported risk allele (Binomial P,0.05). The Native American-specific marker rs9282541 (ABCA1) had an OR below 1 for the allele associated with T2D in Mexicans and showed no evidence of significant association in Antioquia (P = 0.45), despite our sample having 97% power to detect the effect reported in Mexicans[20].
Admixture Mapping Scan
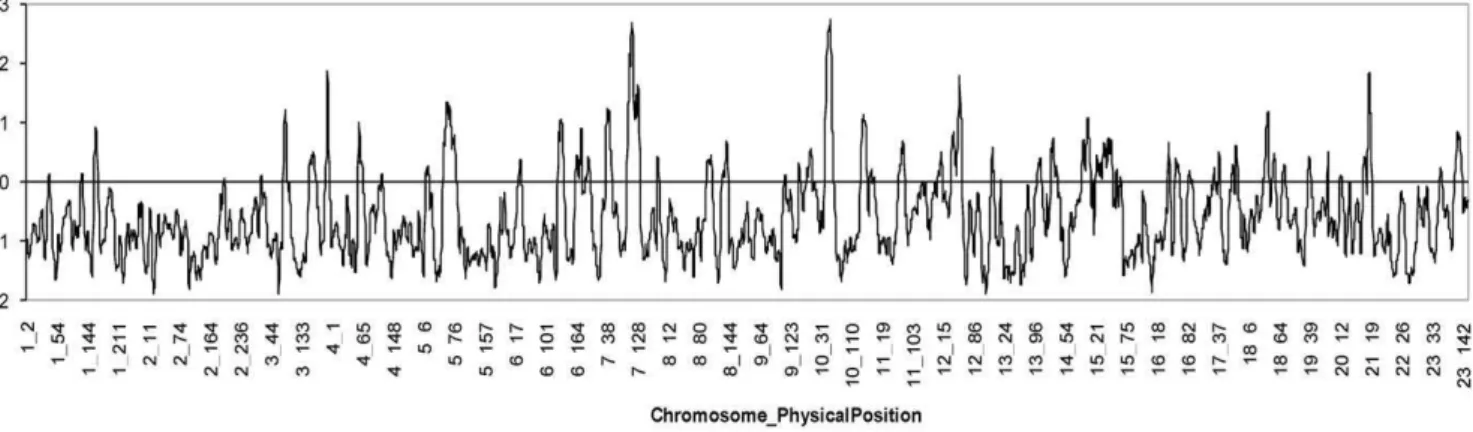
Figure 4 shows the distribution of LOD scores for admixture association in the genome scan of the Antioquian sample. A maximum local LOD-score of ,2.93 was obtained at positions
109 Mb on chromosome 7 and 58 Mb on chromosome 10. These two peaks do not reach the recommended thresholds for of
suggestiveness (LOD-score = 4) or significance (LOD-score = 5) of association [21] and are not located at any of the established TD2 susceptibility loci. A genome-wide LOD-score (obtained by averaging the evidence of association at equally spaced points across the genome) of 0.49 was obtained for the full admixture scan, again falling below the recommended cut-off values for suggestive (LOD-score = 1) or significant (LOD-score = 2) association. Exclusion analysis indicates that the admixture mapping scan of the Antioquian sample examined here rules out
,95% of the genome as harbouring loci with ancestry risk ratios
.1.22 (at P,0.05).
Discussion
This study illustrates some of the complexities of analysing the genetic basis of T2D in Latin American populations, characterized by high genetic and socioeconomic heterogeneity. For historical reasons Latin American individuals and populations show great variability in admixture ratios[22]. Latin America is also a region with high socioeconomic disparities, with Native and highly admixed populations having markedly higher poverty levels than populations with greater European ancestry[23]. The Antioquian population examined here has a history of geographic isola-tion[24–26] and is genetically more homogeneous than many other urban Latin American populations [12,22]. However, we still observe in Antioquia a highly significant correlation between Native ancestry and socioeconomic status, with higher SES being characterized by lower levels of Native American ancestry. Thus, although we find a significant correlation between Native ancestry and T2D in Antioquia (consistent with other studies [4– 8,12,27,28] and the thrifty genotype hypothesis) this correlation is strongly confounded by SES. In fact SES is a strong predictor of disease, with lower SES being associated with significantly higher disease risk [12]. There are a number of mechanisms that could explain the impact of SES on T2D risk, such as a less healthy diet and/or lower exercise levels, as suggested by the strong correlation between SES and BMI observed in Antioquia.
Overall, the data for the candidate loci examined are consistent with an important role for T2D variants identified in Old World populations in diseases susceptibility in Antioquia. Nominally significant association was found for nearly half the validated T2D risk loci tested and there is a significant skew towards values.1 of the OR distribution for the markers selected from published T2D GWAS. Most likely the excess frequency of the risk allele at many of the markers tested did not reach statistical significance due to insufficient power to detect the small effects associated with certain variants. Broadly, these results agree with: (i) a role for genetic variants identified in Old World populations in susceptibility to T2D in Latin American populations, (ii) that these variants arose prior to the initial settlement of the Americas and (iii) that they were contributed to admixed Latin Americans both by their Native American and their Old World ancestors. Interestingly, the frequency of the reported risk allele is higher in Europe than in Antioquia at five of the six markers showing nominal significant association (Figure 1), the largest difference (,20%) being
observed for rs7903146 in TCF7L2, which is the most robustly replicated T2D susceptibility locus and the one associated with the highest OR (,1.3) [19]. Typing of control Native American
disease prevalence in Native Americans and Latinos relative to Europeans. Our observations are consistent with a recent analysis indicating that differences in prevalence between various ethnic groups cannot be accounted for by population differences in risk allele frequencies at established T2D susceptibility loci[29]. Although a substantial fraction of the variation in prevalence across populations is likely to result from environmental (including socioeconomic) differences between them it is possible that unknown population-specific genetic variants also contribute to the increased diabetes prevalence observed in Native Americans and their descendants.
However, we were unable to find evidence of such variants in the Antioquian sample examined here. The admixture scan did not identify regions with significant variation in ancestry along the genome (Figure 1) and rules out ,95% of the genome as
harboring Native American variants of relatively high effect (ancestry risk ratios .1.22). Consistent with the results of this admixture scan, we could not replicate association to T2D for the only known variant private to Native Americans which has been implicated in disease in a Mexican sample (rs9282541 inABCA1) [20]. It is conceivable that improvements in the admixture mapping methodology, the analysis of larger study samples and of
populations with greater Native American ancestry than Antioquia might allow the identification of novel, Native American-specific T2D susceptibility loci. However, based on our results, if such loci are identified, they are likely to be responsible for a relatively small increase in disease risk. Our results thus cast some doubt on the thrifty genotype hypothesis as an explanation for increased T2D risk. Recent cross-cultural ethnographic studies have also ques-tioned the validity of the assumptions underlying the thrifty genotype model [30].
In conclusion, our findings underline the importance of socioeconomic status as a confounder in the association of genetic ancestry and T2D risk in Latin American populations. We provide evidence for the involvement of genetic variants identified in the Old World in susceptibility to T2D in Latin America, but find no evidence in support of the thrifty genotype hypothesis.
Materials and Methods
Ethics Statement
This research was approved by the BioEthics Committee of Universidad de Antioquia (Colombia), the National Health Service National Research Ethics Service, Central London Figure 1. Distribution of (A) Native American ancestry and (B) socioeconomic status (bands 1 to 6) in Antioquian T2D cases and controls.
Committee REC 4 (UK) and the Harvard Medical School Institutional Review Board (USA). Written informed consent was obtained from all participants following the principles of the Declaration of Helsinki. All DNA samples have been anonymized.
Study Sample
The sample examined here is an expansion of the one analysed in Florez et al. (2009)[12], which consisted of 499 T2D cases and 197 controls typed for 66 AIMs. Here we increased the sample size Figure 2. Box plots of (A) Native American ancestry and (B) BMI for socioeconomic status bands 1 to 6 in the Antioquian study sample.
doi:10.1371/journal.pone.0033570.g002
to 876 T2D cases and 399 controls. Other than the previously typed 66 AIMs, most of the samples were genotyped here for an additional 1,536 AIMs, in order to obtain refined estimates of Native American ancestry and enable an admixture mapping scan. Cases (61% women) were collected from diabetes monitoring clinics in the city of Medellı´n. Diagnostic criteria included fasting plasma glucose.110 mg/dl or 2-hour glucose.200 mg/dl after a 75-gram oral glucose tolerance test. The mean age of the cases was 63.0 years (SD = 10.5) and the mean BMI 27.1 (SD = 4.6). Exclusion criteria included secondary causes of diabetes, genetic syndromes associated with diabetes, and insulin therapy during the first two years after diagnosis. Individuals with no clinical diagnosis of T2D living in the same area as the cases were recruited as controls, restricting selection to individuals over 40 years of age (mean age 60.7, SD = 10.2) and with no family history of T2D. These strict selection criteria reduced the pool of controls mainly because it was difficult to identify individuals with no family history of diabetes. To ensure local ancestry, we confirmed that at least 6/8 great-grandparents for both cases and controls were born in Antioquia. The main indicator of socioeconomic status used was the banding of the place of residence of individuals assigned by the local government for the purpose of setting the cost of public services (1 being the lowest and 6 the highest).
T2D Candidate Locus SNP Genotyping
We typed 20 SNPs selected from amongst the most significant association findings of published T2D GWAS [13–18]. When several associated SNPs in a gene region with high LD were reported the marker with the smallest P-value was selected for genotyping. Of the 20 gene regions examined 14 are now considered definite T2D susceptibility loci based on recent large-scale meta-analyses [19]. We also typed marker rs9282541 in the
ABCA1 gene. This is a Native American-specific amino-acid changing variant which has been associated with T2D in Mexicans[20]. Markers were genotyped using SNPlex or a competitive allele-specific PCR assay (performed by KBios-ciences).
Ancestry Estimation
A panel of 66 AIMs was genotyped via Sequenom and a panel of 1,536 AIMs was genotyped using the Illumina Golden Gate assay. Details of the markers included in these panels and the genotyping approach have been provided elsewhere [12,31].The 1,536 AIMs panel is informative mainly for Native American v. Old World ancestry and was specifically designed for admixture mapping in Antioquia [31]. The program EIGENSTRAT [32] was used to identify the main axis of genetic variation. Individuals that were genotyped for the two AIMs panels were used to generate a latent variable (LVS1) as indicator of Native American
Figure 3. Frequency of the risk allele in Antioquian and in European controls for the marker (-gene region) typed.Markers have been
ordered left to right based on the P-value obtained when testing for T2D association in the Antioquian case/control sample (Table 1). Asterisks indicate significance (**,0.01; *,0.05).
versus Old World ancestry, which is comparable across the full dataset. This latent variable was derived using structural equation modelling as implemented in the program LAVASE [33].
Association Testing
Disease association to the candidate SNPs typed was tested via logistic regression, using the R computer package [34], incorpo-rating selected covariates. We denoteccovto represent the estimate of the regression coefficient for covariatecov. Admixture mapping was performed using ANCESTRYMAP [21]. This program calculates a statistic for association at every position in the
genome, assuming two parental populations, corresponding to the likelihood of the data at the locus under an average of disease models versus the likelihood of the data if the locus is not associated with the disease. A LOD-score is calculated by taking the log-base-10 of the likelihood ratio. An exclusion map was obtained by establishing the 95% confidence interval for the ancestry risk ratio (R) at each location in the genome (defined as increased risk for T2D per copy of Native American ancestry). To obtain the confidence interval we ran ANCESTRYMAP 141 times, in each case testing a single risk model ofR(fromR= 0.2 to R = 3.00 at 0.02 intervals). At each locus, ANCESTRYMAP
Figure 4. Distribution of LOD-scores for disease association along the genome in the Antioquian T2D admixture mapping scan. doi:10.1371/journal.pone.0033570.g004
Table 1.Association test results for 21 candidate markers (accounting for SES, ancestry and BMI) in Antioquian T2D cases and controls.
Marker Chromosome Gene Risk/Non-Risk Allelea P-value ORb(95% c.i.)
rs7903146 10 TCF7L2 T/C 0.00012 2.28 (1.50, 3.47)
rs6718526 2 RBMS1 C/T 0.0019 1.76 (1.23, 2.51)
rs9465871 6 CDKAL1 C/T 0.016 1.42 (1.07, 1.90)
rs9326506 10 ZNF239 A/C 0.021 1.32 (1.04, 1.67)
rs2237892 11 KCNQ1 C/T 0.022 1.42 (1.05, 1.91)
rs1169288 12 TCF1 G/T 0.042 1.34 (1.01, 1.79)
rs9939609 16 FTO A/T 0.062 1.30 (0.99, 1.71)
rs564398 9 CDKN2B A/G 0.085 1.32 (0.96, 1.81)
rs9300039 11 Intergenic C/A 0.15 1.60 (0.84, 3.03)
rs4402960 3 IGF2BP2 T/G 0.16 1.18 (0.94, 1.50)
rs2903265 15 ZFAND6 G/A 0.22 0.83 (0.62, 1.12)
rs17044137 4 FLJ39370 A/T 0.23 1.21 (0.89, 1.64)
rs5015480 10 HHEX C/T 0.23 1.17 (0.90, 1.53)
rs13266634 8 SLC30A8 C/T 0.43 0.89 (0.66, 1.19)
rs9282541 9 ABCA1 A/G 0.45 0.80 (0.45, 1.42)
rs1801282 3 PPARG G/C 0.48 0.76 (0.36, 1.62)
rs3740878 11 EXT2 A/G 0.51 1.09 (0.85, 1.39)
rs10509645 10 IDE C/A 0.86 0.98 (0.75, 1.27)
rs7480010 11 LOC3777761 G/A 0.94 0.99 (0.77, 1.28)
rs5215 11 KCNJ11 C/T 0.96 0.99 (0.76, 1.31)
rs10506625 12 TSPAN8 C/G 1 1.01 (0.71, 1.41)
Notes: The gene regions considered established T2D susceptibility loci in Old World populations [19] are shown in bold. (a) Risk allele identified in previous reports. (b) OR for the previously reported risk allele.
doi:10.1371/journal.pone.0033570.t001
produced a LOD-score for the tested risk model versus the null model of R = 1. For each evenly spaced marker in the genome, we identified the maximum likelihood risk model (the one with the highest LOD-score). We then defined the 95% confidence interval forRas all other risk models that had a LOD-score within 0.834 of this maximum. This number is justified by the fact that a log-likelihood ratio test states that two times the natural logarithm of the likelihood ratio for the best fitting model to a tested model is expected to have a chi-square distribution with one degree of freedom and thus a value of 3.84 corresponds to a P-value of 0.05 (that is, a log-base-10 of the likelihood ratio equal to 0.834).
Acknowledgments
We are very grateful to the volunteers that participated in this project. We would also like to thank Barbara Kremeyer for helpful discussions.
Author Contributions
Conceived and designed the experiments: DDC CB AV GB MM AP DR AR-L. Performed the experiments: MVP CD NG LF TH. Analyzed the data: DDC MVP CD AT DR AR-L. Wrote the paper: DDC AR-L.
References
1. Stumvoll M, Goldstein BJ, van Haeften TW (2005) Type 2 diabetes: principles of pathogenesis and therapy. Lancet 365: 1333–1346.
2. Aschner P (2002) Diabetes trends in Latin America. Diabetes Metab Res Rev 18 Suppl 3: S27–31.
3. King H, Aubert RE, Herman WH (1998) Global burden of diabetes, 1995– 2025: prevalence, numerical estimates, and projections. Diabetes Care 21: 1414–1431.
4. Gardner LI, Jr., Stern MP, Haffner SM, Gaskill SP, Hazuda HP, et al. (1984) Prevalence of diabetes in Mexican Americans. Relationship to percent of gene pool derived from native American sources. Diabetes 33: 86–92.
5. Chakraborty R, Ferrell RE, Stern MP, Haffner SM, Hazuda HP, et al. (1986) Relationship of prevalence of non-insulin-dependent diabetes mellitus to Amerindian admixture in the Mexican Americans of San Antonio, Texas. GenetEpidemiol 3: 435–454.
6. Burrows NR, Geiss LS, Engelgau MM, Acton KJ (2000) Prevalence of diabetes among Native Americans and Alaska Natives, 1990–1997: an increasing burden. Diabetes Care 23: 1786–1790.
7. Williams RC, Long JC, Hanson RL, Sievers ML, Knowler WC (2000) Individual estimates of European genetic admixture associated with lower body-mass index, plasma glucose, and prevalence of type 2 diabetes in Pima Indians 1. AmJHumGenet 66: 527–538.
8. Knowler WC, Bennett PH, Hamman RF, Miller M (1978) Diabetes incidence and prevalence in Pima Indians: a 19-fold greater incidence than in Rochester, Minnesota. Am J Epidemiol 108: 497–505.
9. Neel JV (1962) Diabetes mellitus: a ‘‘thrifty’’ genotype rendered detrimental by ‘‘progress’’? AmJHumGenet 14: 353–362.
10. Pollard TM (2008) Western diseases : an evolutionary perspective. Cambridge; New York: Cambridge University Press. xi, 223 p. p.
11. Diamond J (2003) The double puzzle of diabetes. Nature 423: 599–602. 12. Florez JC, Price AL, Campbell D, Riba L, Parra MV, et al. (2009) Strong
association of socioeconomic status with genetic ancestry in Latinos: implications for admixture studies of type 2 diabetes. Diabetologia 52: 1528–1536. 13. Zeggini E, Weedon MN, Lindgren CM, Frayling TM, Elliott KS, et al. (2007)
Replication of genome-wide association signals in UK samples reveals risk loci for type 2 diabetes. Science 316: 1336–1341.
14. Scott LJ, Mohlke KL, Bonnycastle LL, Willer CJ, Li Y, et al. (2007) A genome-wide association study of type 2 diabetes in Finns detects multiple susceptibility variants. Science 316: 1341–1345.
15. Saxena R, Voight BF, Lyssenko V, Burtt NP, de Bakker PI, et al. (2007) Genome-wide association analysis identifies loci for type 2 diabetes and triglyceride levels. Science 316: 1331–1336.
16. Unoki H, Takahashi A, Kawaguchi T, Hara K, Horikoshi M, et al. (2008) SNPs in KCNQ1 are associated with susceptibility to type 2 diabetes in East Asian and European populations. Nat Genet 40: 1098–1102.
17. Yasuda K, Miyake K, Horikawa Y, Hara K, Osawa H, et al. (2008) Variants in KCNQ1 are associated with susceptibility to type 2 diabetes mellitus. Nat Genet 40: 1092–1097.
18. Zeggini E, Scott LJ, Saxena R, Voight BF, Marchini JL, et al. (2008) Meta-analysis of genome-wide association data and large-scale replication identifies additional susceptibility loci for type 2 diabetes. Nat Genet 40: 638–645.
19. Voight BF, Scott LJ, Steinthorsdottir V, Morris AP, Dina C, et al. (2010) Twelve type 2 diabetes susceptibility loci identified through large-scale association analysis. Nature genetics 42: 579–589.
20. Villarreal-Molina MT, Flores-Dorantes MT, Arellano-Campos O, Villalobos-Comparan M, Rodriguez-Cruz M, et al. (2008) Association of the ATP-binding cassette transporter A1 R230C variant with early-onset type 2 diabetes in a Mexican population. Diabetes 57: 509–513.
21. Patterson N, Hattangadi N, Lane B, Lohmueller KE, Hafler DA, et al. (2004) Methods for high-density admixture mapping of disease genes. AmJHumGenet 74: 979–1000.
22. Wang S, Ray N, Rojas W, Parra MV, Bedoya G, et al. (2008) Geographic patterns of genome admixture in Latin American Mestizos. PLoS Genet 4: e1000037.
23. De Ferranti D, Perry G, Ferreira F, Walton M (2004) Inequality in Latin America: Breaking with History? Washington D.C.: World Bank Publications. 24. Carvajal-Carmona LG, Soto ID, Pineda N, Ortiz-Barrientos D, Duque C, et al.
(2000) Strong Amerind/white sex bias and a possible Sephardic contribution among the founders of a population in northwest Colombia. Am J Hum Genet 67: 1287–1295.
25. Carvajal-Carmona LG, Ophoff R, Service S, Hartiala J, Molina J, et al. (2003) Genetic demography of Antioquia (Colombia) and the Central Valley of Costa Rica. Hum Genet 112: 534–541.
26. Bedoya G, Montoya P, Garcia J, Soto I, Bourgeois S, et al. (2006) Admixture dynamics in Hispanics: a shift in the nuclear genetic ancestry of a South American population isolate. Proc Natl Acad Sci U S A 103: 7234–7239. 27. Parra EJ, Hoggart CJ, Bonilla C, Dios S, Norris JM, et al. (2004) Relation of
type 2 diabetes to individual admixture and candidate gene polymorphisms in the Hispanic American population of San Luis Valley, Colorado. Journal of Medical Genetics 41.
28. Martinez-Marignac VL, Valladares A, Cameron E, Chan A, Perera A, et al. (2007) Admixture in Mexico City: implications for admixture mapping of type 2 diabetes genetic risk factors. HumGenet 120: 807–819.
29. Waters KM, Stram DO, Hassanein MT, Le Marchand L, Wilkens LR, et al. (2010) Consistent association of type 2 diabetes risk variants found in europeans in diverse racial and ethnic groups. PLoS Genet 6.
30. Benyshek DC, Watson JT (2006) Exploring the thrifty genotype’s food-shortage assumptions: a cross-cultural comparison of ethnographic accounts of food security among foraging and agricultural societies. Am J Phys Anthropol 131: 120–126.
31. Price AL, Patterson N, Yu F, Cox DR, Waliszewska A, et al. (2007) A genomewide admixture map for Latino populations. Am J Hum Genet 80: 1024–1036.
32. Price AL, Patterson NJ, Plenge RM, Weinblatt ME, Shadick NA, et al. (2006) Principal components analysis corrects for stratification in genome-wide association studies. NatGenet 38: 904–909.
33. Campbell DD, Rijsdijk FV, Sham PC (2007) Computation of individual latent variable scores from data with multiple missingness patterns. Behav Genet 37: 408–422.