www.atmos-chem-phys.org/acp/5/2155/ SRef-ID: 1680-7324/acp/2005-5-2155 European Geosciences Union
Chemistry
and Physics
Is there a trend in cirrus cloud cover due to aircraft traffic?
F. Stordal1,2, G. Myhre1,2, E. J. G. Stordal2, W. B. Rossow3, D. S. Lee4, D. W. Arlander2,*, and T. Svendby2 1Department of Geosciences, University of Oslo, Norway
2Norwegian Institute for Air Research, Kjeller, Norway
3NASA/Goddard Institute for Space Studies, New York, New York, USA
4Department of Environment and Geographical Sciences, Manchester Metropolitan University, UK *now at: Bureau of Patents, Oslo, Norway
Received: 20 September 2004 – Published in Atmos. Chem. Phys. Discuss.: 13 October 2004 Revised: 23 June 2005 – Accepted: 12 July 2005 – Published: 11 August 2005
Abstract. Trends in cirrus cloud cover have been estimated based on 16 years of data from ISCCP (International Satel-lite Cloud Climatology Project). The results have been spa-tially correlated with aircraft density data to determine the changes in cirrus cloud cover due to aircraft traffic. The cor-relations are only moderate, as many other factors have also contributed to changes in cirrus. Still we regard the results to be indicative of an impact of aircraft on cirrus amount. The main emphasis of our study is on the area covered by the ME-TEOSAT satellite to avoid trends in the ISCCP data resulting from changing satellite viewing geometry. In Europe, which is within the METEOSAT region, we find indications of a trend of about 1–2% cloud cover per decade due to aircraft, in reasonable agreement with previous studies. The positive trend in cirrus in areas of high aircraft traffic contrasts with a general negative trend in cirrus. Extrapolation in time to cover the entire period of aircraft operations and in space to cover the global scale yields a mean estimate of 0.03 Wm−2 (lower limit 0.01, upper limit 0.08 Wm−2)for the radiative forcing due to aircraft induced cirrus. The mean is close to the value given by IPCC (1999) as an upper limit.
1 Introduction
Condensation trails (contrails) from jet aircraft are visible in many industrialized regions and constitute one of several mechanisms that could influence the Earth’s radiative bal-ance. Contrails can often disappear quickly, but sometimes they persist for longer time periods and even evolve into cir-rus clouds. Minnis et al. (1998) used information from a geostationary satellite to follow three events where contrails were converted into cirrus clouds. These contrail systems lasted up to 17 h. Duda et al. (2004) used a combination
Correspondence to:F. Stordal ([email protected])
of flight data, meteorological data and satellite remote sens-ing to study development of contrails over the Great Lakes, demonstrating the formation of aircraft contrails with subse-quent spreading. From surface observations it would be diffi-cult to distinguish cirrus clouds evolving from contrails from natural cirrus. Although the possibility of contrails evolving into cirrus clouds was pointed out several years ago (Machta and Carpenter, 1971; Changnon, 1981), the extent of such cirrus clouds and their climate effect remain highly uncer-tain.
Boucher (1999) used synoptic cloud reports from land and ship stations to derive trends of cirrus clouds and further re-lated these trends to fossil fuel consumption by aircraft traf-fic. He found an increase in the occurrence of cirrus clouds that could be related to aircraft traffic. Over the continen-tal regions with the most aircraft traffic he determined the trend in cirrus to be almost as large as 3% cloud cover over a 10-year period, after correcting for a negative trend in cir-rus “amount when present”. Zerefos et al. (2003) analyzed trends in cirrus cloud cover based on data from ISCCP (In-ternational Satellite Cloud Climatology Project). After re-moving variations associated with ENSO, QBO and NAO they found a trend in cirrus cloud cover over northern mid-latitudes, which, to a large extent, paralleled increases in fuel consumption by aircraft, leading to their conclusion that there is evidence of a possible aviation effect on cirrus cloud cover. Minnis et al. (2004) analysed surface observations of clouds and cloud data from ISCCP in combination with up-per tropospheric humidity (from National Centers for Envi-ronmental Prediction, NCEP), finding that positive trends in cirrus in certain regions were most likely due to air traffic (e.g. the US).
affect the diurnal temperature because during the night their longwave effect inhibits cooling. On the other hand, dur-ing the day the longwave effect and shortwave effects are rather similar but opposite in sign: the shortwave effect could even dominate and yield a cooling (Myhre and Stordal, 2001; Ponater et al., 2002). The Travis et al. (2002) study showed a larger than 1 degree increase in the diurnal temperature range compared to the three day periods before and after the grounding of the aircraft traffic. This is clearly larger than what would be expected from contrails alone, pointing to-wards cirrus clouds evolving from contrails as a potentially significant effect in affecting the diurnal temperature range.
The present study is based on satellite observations of cir-rus and seeks to identify trends that can possibly be related to aircraft traffic. In our study we use ISCCP data over a 16 year period. Although we take a global approach we focus on the region viewed by METEOSAT, where spurious contribu-tions to trends in cirrus due to variacontribu-tions in satellite viewing geometry are minimal.
2 Data and analysis method
2.1 ISCCP data
The ISCCP project was established in the early 1980s. One of the aims was to produce global calibrated and normal-ized radiance dataset for the infrared (IR) and visible (VIS) from which cloud parameters could be derived. The IS-CCP cloud analysis procedure contains three principal parts: cloud detection, radiative model analysis, and statistical anal-ysis (Rossow and Schiffer, 1991; Rossow and Garder, 1993). Although there are several factors introducing uncertainties in the ISCCP data, the long and continuous data record makes it one of the best products in studies of long term trends in cirrus clouds.
The primary data products of ISCCP are a collection of VIS and IR radiation images from the operational constella-tion of weather satellites that have been normalized to a stan-dard reference calibration (Schiffer and Rossow, 1985). Data are taken from the geostationary satellites METOSAT (Me-teorological Satellite), GMS (Geostationary Me(Me-teorological Satellite), GOES (Geostationary Operational Environmental
monthly mean D2 data product (Rossow and Schiffer, 1999) on a 2.5◦equal area grid for the 16 year period 1984–1999.
We use the ISCCP datasets for cirrus clouds in an attempt to study the formation of cirrus from aircraft contrails. The dataset is derived from a combination of visible and IR infor-mation (denoted as ISCCP VIS/IR), with results only during the day. The VIS radiances are used to determine the optical thickness, which is a basis for a correction of the cloud top temperature, resulting in a better classification of thin cirrus clouds.
High clouds (ISCCP VIS/IR) have been compared (see Rossow and Schiffer, 1999) to SAGE (Stratospheric Aerosol and Gas Experiments) data (Liao et al., 1995) and two dif-ferent analyses of HIRS (High-Resolution Infrared Sounder; Jin et al., 1996; Stubenrauch et al., 1999). In summary, those comparisons showed that the ISCCP VIS/IR high cloud amounts are lower than the other datasets by at least 0.05– 0.10. The discrepancies include uncertainties in all the datasets but are consistent with the lower detection sensitivity of ISCCP, which limits it to clouds with optical depths>0.3. Nevertheless these studies also show that the geographic and time variations of the cirrus in these datasets are well corre-lated. Although ISCCP does not recognize cirrus over other clouds, these cirrus have less radiative effect due to the cold and bright underlaying surfaces. Thus, although ISCCP may underestimate the total amount of cirrus change, this has little effect on the radiative forcing.
Fig. 1.Global map of average cirrus cover based on ISCCP VIS/IR data for the period 1984–1999 (in % cloud cover).
of an optically thin cloud is larger than the nadir path effect, more thin cirrus is detected at slant views (as can be seen in the region pointed to above in the Indian Ocean). This feature is important when it comes to determining trends in cirrus, as will be discussed below.
2.2 Trend estimation
We have determined temporal trends in the ISCCP dataset. Trends have been established in two different ways. First, the dataset was divided into two 8 year periods, 1984–1991 and 1992–1999. Trends were taken as the difference between the two periods (in % cloud cover/yr). Results are shown in Fig. 2a.
The satellite zenith angle dependence in the detection of cirrus described in the previous section suggests that great care must be taken when patterns in derived trends are to be studied. This effect, combined with the changing satellite positions and numbers of satellites operating over the years, produces spatial discontinuities in trends in cloud amount, even more clearly than what is the case in the data for cloud amount itself. Essentially they result from a change over the years in the viewing angle for each location. This puts a con-straint on the use of trends from ISCCP, especially in inves-tigations of geographical patterns. However, information on satellite viewing geometry and identity are provided in the ISCCP dataset, helping reduce and overcome the problems raised above.
To reduce the problems we have focused our trend analy-sis on regions which are covered by only one satellite each in the ISCCP data. A particular emphasis has been on the ME-TEOSAT region. MEME-TEOSAT has not moved in the whole period of record, so that drifts in the zenith angle dependence are avoided. In the METOSAT region the strongest positive trends are found over central Africa. It is important to notice that there are large areas with negative trends.
Second, trends were established from linear regression of the yearly mean data in the 16 years period. Figure 2b shows
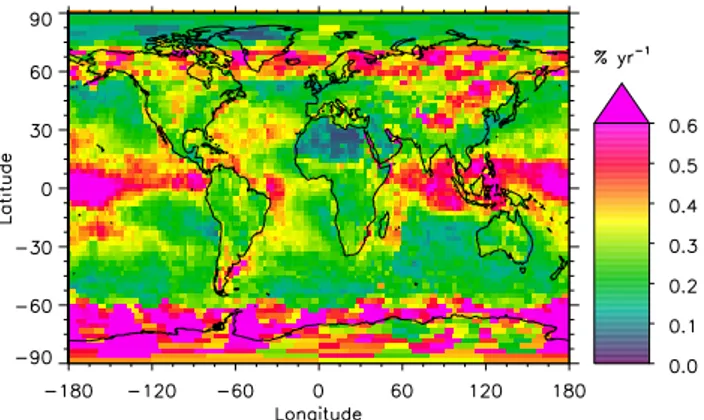
Fig. 2a.Changes in cirrus from ISCCP VIS/IR based on differences between the two periods 1992–1999 and 1984–1991 (in % cloud cover per year).
Fig. 2b. Changes in cirrus from ISCCP VIS/IR based on linear regression (in % cloud cover per year).
that the trends derived from linear temporal regression are similar to those derived from the differences between the lat-ter and the former years of cirrus, although some differences have been found. Both trends are used in the following.
The uncertainty in the estimated trends has been quanti-fied in terms of the 95% confidence interval. The results are shown in Fig. 3 for the two methods. There is a substantial spatial variability in the confidence interval. However, the in-terval is relatively small in the METEOSAT region. Finally, the confidence intervals calculated for the two different trend estimating methods are rather similar, though with generally smaller intervals for the regression method. In general the confidence intervals for the two trends overlap.
Fig. 3a. Confidence interval (95%) in the calculation of changes in cirrus from ISCCP VIS/IR based on differences between the two periods 1992–1999 and 1984–1991 (in % cloud cover per year).
Fig. 3b.Confidence interval (95%) in the calculation of changes in cirrus from ISCCP VIS/IR based on linear regression (in % cloud cover per year).
sector. Changes in cloud cover in this region could be due to aircraft activity, but certainly also to high natural variabil-ity in this region. They could possibly also be caused by a climate change over the period of investigation. The large changes in cirrus cloud cover over Africa are certainly not due to aircraft. A few recent studies have pointed out that changes in anthropogenic aerosol emissions could have af-fected cloud cover in this region (Rotstayn and Lohmann, 2002; Kristjansson, 2002). To reduce the impact of phenom-ena other than aircraft, we have selected the 10 regions of further investigation so that they broadly cover either land or ocean areas.
3 Aircraft impact on cirrus cover
In this section we correlate the estimated trends in cirrus with aircraft flight data with the aim to quantify the impact of air-craft on the cirrus coverage.
Fig. 4.Global map of distance flown with aircraft (km km−2yr−1) in year 2000 in altitude layer 17–19 (9760–11 590 m altitude). Also shown are 10 regions used for trend analysis.
3.1 Aircraft data
Global fuel usage, NOx emissions and kilometres travelled
were determined within the TRADEOFF project for the years 1992 and 2000 using the FAST model. FAST calculates in-ventories of fuel consumption, NOx emissions and distance
travelled on a global grid, which is variable in horizontal and vertical dimensions as a user-specified input. For the TRADEOFF simulations, the inventories were generated at a vertical discretization of 610 m, equivalent to one flight level. The FAST model has its origins in the ANCAT/EC2 emis-sions inventory (Gardner et al., 1997, 1998) and uses the same movement database for 1991/92. Aircraft were mod-elled using 16 representative types and engine fuel-flow data for these 16 types were modelled using the PIANO aircraft performance model (Simos, 2003). Unlike previous inven-tories, the distance travelled per grid cell was also calcu-lated for the months of January, April, July and October. The variation in total global distance is rather small com-pared with the average, with a maximum variation of approx-imately 3%. The regional differences are, however, larger. The total distance travelled by civil traffic in 1991/92 was 17.4×10⁹km yr−1.
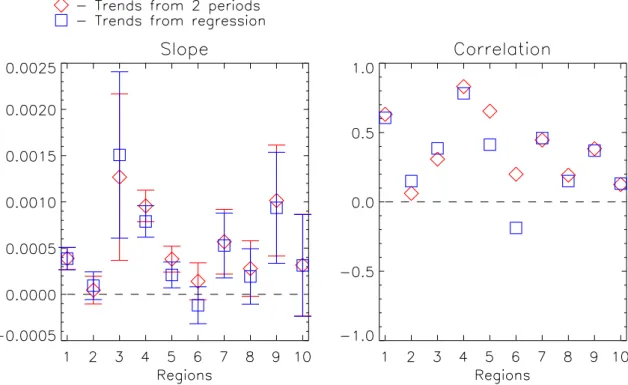
Fig. 5.Results of spatial regression analysis between trends in cirrus cloud amount from ISCCP VIS/IR and aircraft traffic density, for the slope in (% yr−1)/(km km−2yr−1) and the correlation coefficient. Temporal trends have been determined from differences between two 8
year periods, and from linear regression, and traffic data are taken from the region encompassing layers 17–19 (9760–11 590 m altitude).
was 33%, whereas the increase in total distance was approx-imately 44%.
The distance flown is believed to be the parameter that most closely relates to the ability of aircraft to form con-trails that later can develop into cirrus clouds, given that the environment is suitable for forming contrails. This param-eter is thus used in the following analysis. Figure 4 shows a global map of the area density of the distance flown (km km−2yr−1) at an altitude favourable of contrail and cirrus
formation, taken to be the region 9760–11 590 m (layer 17– 19).
3.2 Correlation between cirrus trends and aircraft data Our basic assumption is that a change in the area covered by cirrus in a region (dA, in km2) is proportional (factorb) to the change in aircraft flight distance (dL, in km yr−1) over a
unit of time:
dA=bdL. (1)
We integrate this equation over the 16 years of our investiga-tion (beginning of 1984 to end of 1999 or beginning of 2000), and divide by the length of the time period (1t=16 yr) to in-troduce the trend in cirrus as a convenient quantity. Next we introduce the factorf=(L2000−L1984)/L2000and arrive at
the equation
(A2000−A1984)/1t =cL2000, (2)
where the constant
c=bf/1t. (3)
We have spatially correlated trends in cirrus with aircraft flight data within each of the 2.5◦×2.5◦ grid cells in each of the 10 regions. Rather than using Eq. (2) directly we have used data for the area densities ofA(multiplied by 100) and
L, denoted asC (% cloud fraction) andD(km km−2yr−1),
respectively:
(C2000−C1984)/1t =100cD2000. (4)
To eliminate natural fluctuation in areas with very little air-craft activity we have introduced a cut-off limit for airair-craft density, below which we exclude the data from the analy-sis. The results for the correlation coefficients and the slopes 100care shown in Fig. 5, with slightly different results for the two different methods to determine the cirrus trends. The results are shown for the layer 9760–11 590 m (layer 17– 19). The 95% confidence interval for the spatial regression is shown in the figure. Regressions have been tested for in-dividual 610 m layers in the region above 8540 m and below 11 590 m, which encompasses the altitude range of the cruise level of most commercial flights, with very similar results. We have also tested various cut-off levels (a factor 5 higher and 2 lower than our standard value of 30 km km−2), again
no. 1 (western US), no. 4 (part of the North Atlantic Flight Corridor) and no. 5 (western Europe). These regions have in common a generally high aircraft density, also with some contrasting areas with lower traffic density. In the regions east of two of the regions discussed above (area no. 2, east-ern US, and area no. 6, easteast-ern Europe and part of Asia) the correlation is weak. One possible explanation is advection (as discussed by Minnis et al., 2004). For example some of the cirrus resulting from air traffic in areas no. 1 and 5 could be advected, predominantly eastward, into the neighbouring regions no. 2 and 6, thus confusing any spatial relationship between the traffic there and cirrus induced locally by air-craft.
3.3 Extrapolation to global scale
Based on the results presented in the previous section, the correlation between trends in cloud amount and aircraft traf-fic suggests that aircraft may have influenced cirrus. The correlations with aircraft density are above 0.5 in certain re-gions. In order to declare an undisputed relationship between cirrus and air traffic, one would need to have a higher correla-tion coefficient. However, natural variability in cirrus clouds would mask such a relationship and weaken the correlation. We regard the results that we have found to be indicative of an impact of aircraft on cirrus amount as there are significant positive slopes in many regions with high aircraft density.
In order to assess the potential global impact of aircraft on cirrus formation we extrapolate the above results to a global scale. Based on the results presented above this can only be done in a relatively crude manner. We estimate the impact of aircraft on cirrus formation by estimating increases in cirrus areas in each of the 10 regions, adding the contributions and dividing by the area of the Earth’s surface (a), after integra-tion of Eq. (1) from the time when aircraft traffic started until year 2000:
X
100(A2000−A0)/a=100b/a X
L2000. (5)
The left hand side of this equation equals the increase in % cloud cover due to all aircraft in year 2000.
Notice that we need to scale the slope 100cfrom the spa-tial regression according to Eq. (3) to find the constantbused in Eq. (5). The scaling factor includesf which is the increase
analysis we use the lower value to be conservative in our es-timates of aircraft induced cirrus.
To derive a global estimate, we need to include all parts of the world in solving Eq. (5). We have only made correlations between cirrus and aircraft in 10 regions. They cover 56% of the global aircraft traffic. To arrive at a global estimate, we have scaled our results from Eq. (5) in the 10 regions by 1/0.56, assuming thus that the cirrus-aviation relation is sim-ilar to the aircraft-traffic weighted average of the 10 regions outside those regions. The results are summarized in Table 1. As our derived cirrus trends in the METEOSAT region are considered to be least uncertain we have also used the sub-set of regions in the METOSAT in an additional global es-timation. In this case we cover 21% of the global aircraft traffic, and we scale our result to global scale accordingly. These results are also included in Table 1, where also lower and upper limits according to the 95% confidence interval are given. In both cases we have found with 95% certainty that aircraft have induced a positive change in global cirrus cover. As expected the confidence interval is slightly narrower in the case where only data from the METEOSAT region were used, but both in the mean and in the lower and upper limits the two approaches (METEOSAT regions vs. all 10 regions) yield rather similar results.
Our global estimates in Table 1 are a result of spatial cor-relations adopting cirrus trends from the two different meth-ods. The numbers in Table 1 are based on averages of slopes 100cand confidence intervals derived in the two cases. In the METOSAT case the ratio of the mean values derived from the two trend methods is 1.6, in the global case this ratio is only 1.1.
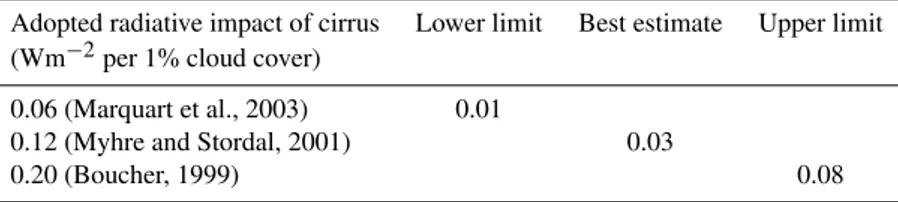
Table 2.Radiative forcing (Wm−2)due to aircraft induced cirrus (year 2000), adopting the global cirrus cover derived from the METEOSAT
regions (in Table 1).
Adopted radiative impact of cirrus Lower limit Best estimate Upper limit (Wm−2per 1% cloud cover)
0.06 (Marquart et al., 2003) 0.01
0.12 (Myhre and Stordal, 2001) 0.03
0.20 (Boucher, 1999) 0.08
in each region equals the low or the high estimate has a rather modest impact on the results for the slopes in the spatial re-gression (estimated to be within about 10% relative).
Europe is the area within the region covered by ME-TEOSAT which has the highest aircraft density. We have used the two European regions (no. 5 and 6) to estimate the change in cirrus due to aircraft by adopting Eq. (4). We found a trend in cirrus due to aircraft of 1–2%/decade (note that this is in absolute % point units for cirrus cloud coverage; 1% is the average for the two regions in the case of trends based on two time periods, 2% from trends based on temporal re-gression). The amount of cirrus that we have attributed to aircraft traffic in Europe is 3–5% cloud cover, approaching half of the present cirrus amount. Our results are similar to those derived for Europe by Zerefos et al. (2003), who also based their analysis on the same ISCCP data, but used a dif-ferent statistical approach. Zerefos et al. (2003) found an increase in cirrus cover in high air traffic areas of Europe of +1.3%/decade, contrasted by a decrease of 0.2%/decade in low air traffic areas, which can be interpreted as a 1.5%/yr trend in cirrus due to aircraft. Boucher (1999) found a some-what stronger increase in cirrus, almost 3%/decade, over con-tinental regions with high aircraft traffic, resulting from an even stronger trend in occurrence of cirrus but correcting for a negative trend in cirrus “amount when present”. Zerefos et al. (2003) also included an analysis of trends in the North Atlantic Flight Corridor (NAFC), but their results are proba-bly less reliable in this case as their area of investigation was based on trends in cirrus derived from several satellites.
Downward trends in cirrus in low traffic regions found in Zerefos et al. (2003) and in this work are consistent with a general decrease in upper level clouds which was found over mid-latitude continental regions in the Northern Hemisphere by Norris et al. (2005).
4 Climate impact of aircraft induced cirrus
To find the radiative forcing we multiply the global aircraft induced cirrus cover calculated in the previous section with the radiative impact of cirrus. We combine the mean estimate of change in cirrus with a mid range value of 0.12 Wm−2per
1% cloud cover (see e.g. Myhre and Stordal, 2001, and
ref-erences therein, assuming that the radiative forcing change is the same per unit of cloud cover for aircraft induced cir-rus and contrails). We then arrive at a global mean radia-tive forcing change due to an aircraft effect on cirrus that is 0.03 Wm−2. We have here used a radiative impact of
con-trails for aircraft induced cirrus which is likely lower than the one for cirrus on a global scale, as cirrus in the tropics have a larger LW radiative effect. To explore the range of diative forcing we have used also two other estimates for ra-diative impact of cirrus, namely a lower one, 0.06 Wm−2per 1% cloud cover, by Marquart et al. (2003), and a higher one, 0.20 Wm−2per 1% cloud cover, from Boucher (1999). We have combined the low and high values, respectively, with the lower and higher estimates of changes in aviation induced cirrus (using the numbers based on the METEOSAT region in Table 1). The lower and upper limits are estimated to 0.01 and 0.08 Wm−2, respectively (see Table 2).
5 Conclusions
In this study we have found indications that cirrus cloud amount increases have accompanied an increase in air traf-fic in the 16 year period 1984–1999 contrasting with a gen-eral negative trend. However, the relationship between cirrus cloud amount and aircraft density is uncertain and we cannot draw firm conclusions or quantify the effect with high cer-tainty. We find that the strongest influence on cirrus clouds, as manifested in the ISCCP VIS/IR dataset, occurs in parts of the regions with the highest aircraft traffic. Our results may still be influenced by natural variability, climate change, and other anthropogenic impacts.
Our mean estimate of the radiative forcing (0.03 Wm−2)is close to the number given in the IPCC (1999) (upper limit in their assessment is 0.04 Wm−2), and rather similar to the up-per limit estimated by Minnis et al. (2004), for the total effect of cirrus and contrails, of 0.026 Wm−2in the mid 1990s. It is significant compared to the total radiative forcing due to air-craft from all effects other than cirrus, which was estimated to be 0.1 Wm−2(IPCC, 1999).
project TRADEOFF and by the NASA REASON program. We thank K. Shine and R. Sausen for valuable discussions.
Edited by: U. Lohmann
References
Boucher, O.:Air traffic may increase cirrus cloudiness, Nature, 397, 30–31, 1999.
Chagnon, S. A.: Midwestern cloud, sunshine and temperature trends since 1901 – Possible evidence of jet contrail effects, J. Appl. Meteorol., 20, 496–508, 1981.
Chen, T., Rossow, W. B., Zhang, and Y-C.: Radiative effects of cloud-type variations, J. Climate, 13, 264–286, 2000.
Duda, P. D., Minnis, P., Nguyen, L., and Palikonda, R.: A case study of the development of contrail clusters over the Great lakes, J. Atmos. Sci., 61, 1132–1146, 2004.
Gardner, R. M., Adams, K., Cook, T., Ernedal, S., Falk, R., Fleuti, E., Herms, E., Johnson, C. E., Lecht, M., Lee, D. S., Leech, M., Lister, D., Mass´e, B., Metcalfe, M., Newton, P., Schmitt, A., Vandenbergh, C., and van Drimmelen, R.: The ANCAT/EC global inventory of NOxemissions from aircraft, Atmospheric
Environment, 31, 1751–1766, 1997.
Gardner, R. M. (Ed.): ANCAT/EC2 aircraft emissions inventories for 1991/92 and 2015: Final Report.EUR-18179, ANCAT/EC Working Group, 84 pp. plus appendices, ISBN-92-828-2914-6, 1998.
IPCC: Aviation and the Global Atmosphere, A Special Report of IPCC (Intergovernmental Panel on Climate Change), edited by: Penner, J. E., Lister, D. H., Griggs, D. J., Dokken, D. J., and McFarland, M., Cambridge University Press, Cambridge, UK, 373 pp., 1999.
IPCC: Intergovernmental Panel on Climate Change 2001: The Sci-entific Basis, edited by: Houghton, J. T., Ding, Y., Griggs, D. J., Noguer, M., van der Linden, P. J., Dai, X., Maskell, K., and John-son, C. A., Cambridge University Press, Cambridge, UK, 881 pp., 2001.
Jin, Y., Rossow, W. B., and Wylie, D. P.: Comparison of the clima-tologies of high-level clouds from HIRS and ISCCP, J. Climate, 9, 2850–2879, 1996.
Kristjansson J. E.: Studies of the aerosol indirect effect of sul-phate and black carbon aerosols, J. Geophys. Res., 107, No. D15, doi:10.1029/2001JD000887, 2002.
SUCCESS, Geophys. Res. Lett., 25, 1157–1160, 1998. Minnis, P., Schumann, U., Doelling, D. R., Gierens, K. M., and
Fahey, D. W.: Global distribution of contrail radiative forcing, Geophys. Res. Lett., 26, 1853–1856, 1999.
Minnis, P., Kirk Ayers, J., Palikonda, R., and Phan, D.: Contrails, Cirrus Trends, and Climate, J. Climate, 17, 1671–1685, 2004. Myhre, G. and Stordal, F.: On the tradeoff of the solar and thermal
infrared radiative impact of contrails, Geophys. Res. Lett., 28, 3119-3122, 2001.
Norris, J. R.: Multidecadal changes in near-global cloud cover and estimated cloud cover radiative forcing, J. Geophys. Res., 110, doi:10.1029/2004JD005600, 2005.
Ponater, M., Marquart, S., and Sausen, R.: Contrails in a comprehensive global climate model: Parametriza-tion and radiative forcing results, J. Geophys. Res.,107, doi:10.1029/2001JD000429, 2002.
Rossow, W. B. and Garder, L. C.: Cloud detection using satellite measurements of infrared and visible radiances for ISCCP, J. Cli-mate, 6, 2341–2369, 1993.
Rossow, W. B. and Schiffer, R. A.: ISCCP Cloud data products, Bull. Amer. Meteor. Soc., 72, 2–20, 1991.
Rossow, W. B. and Schiffer, R. A.: Advances in understanding clouds from ISCCP, Bull. Amer. Meteor. Soc., 80, 2261–2287, 1999.
Rotstayn, L. D. and Lohmann, U.: Tropical rainfall trends and the indirect aerosol effect, J. Climate, 15, 2103–2116, 2002. Schiffer, R. A. and Rossow, W. B.: ISCCP global radiance data set:
A new resource for climate research, Bull. Amer. Meteor. Soc., 66, 1498–1505, 1985.
Simos: PIANO Project Interactive Analysis and Optimisation air-craft performance tool, http://www.lissys.demon.co.uk, 2003. Stubenrauch, C. J., Rossow, W. B., Cheruy, F., Chedin, A., and
Scott, N. A.: Clouds as seen by satellite sounders (3I) and im-agers (ISCCP). Part 1: Evaluation of cloud parameters, J. Cli-mate, 12, 2189–2213, 1999.
Travis, D. J., Carleton, A. M., Lauritsen, R. G., Contrails reduce daily temperature range, Nature, 418, 601, 2002.
Zerefos, C. S., Eleftheratos, K., Balis, D. S., Zanis, P., Tselioudis, G., and Meleti, C.: Evidence of impact of aviation on cirrus cloud formation, Atmos. Chem. Phys., 3, 1633–1644, 2003,