www.atmos-chem-phys.net/11/6961/2011/ doi:10.5194/acp-11-6961-2011
© Author(s) 2011. CC Attribution 3.0 License.
Chemistry
and Physics
Large methane releases lead to strong aerosol forcing and reduced
cloudiness
T. Kurt´en1,2, L. Zhou1, R. Makkonen1, J. Merikanto1, P. R¨ais¨anen3, M. Boy1, N. Richards4, A. Rap4, S. Smolander1, A. Sogachev5, A. Guenther6, G. W. Mann4, K. Carslaw4, and M. Kulmala1
1Department of Physics, University of Helsinki, P.O. Box 64, 00014, Helsingin Yliopisto, Finland
2Department of Chemistry, University of Copenhagen, Universitetsparken 5, 2100, København Ø, Denmark 3Finnish Meteorological Institute, P.O. Box 503, 00101, Helsinki, Finland
4Institute for Climate and Atmospheric Science, School of Earth and Environment, University of Leeds, Leeds, LS2 9JT, UK 5Wind Energy Division, Risø National Laboratory for Sustainable Energy, Technical University of Denmark, Building 118,
P.O. Box 49, 4000, Roskilde, Denmark
6Atmospheric Chemistry Division, NESL/NCAR, Boulder CO, USA
Received: 11 February 2011 – Published in Atmos. Chem. Phys. Discuss.: 16 March 2011 Revised: 5 July 2011 – Accepted: 13 July 2011 – Published: 18 July 2011
Abstract. The release of vast quantities of methane into the atmosphere as a result of clathrate destabilization is a po-tential mechanism for rapid amplification of global ing. Previous studies have calculated the enhanced warm-ing based mainly on the radiative effect of the methane itself, with smaller contributions from the associated car-bon dioxide or ozone increases. Here, we study the ef-fect of strongly elevated methane (CH4) levels on oxidant
and aerosol particle concentrations using a combination of chemistry-transport and general circulation models. A 10-fold increase in methane concentrations is predicted to sig-nificantly decrease hydroxyl radical (OH) concentrations, while moderately increasing ozone (O3). These changes lead
to a 70 % increase in the atmospheric lifetime of methane, and an 18 % decrease in global mean cloud droplet num-ber concentrations (CDNC). The CDNC change causes a ra-diative forcing that is comparable in magnitude to the long-wave radiative forcing (“enhanced greenhouse effect”) of the added methane. Together, the indirect CH4-O3and CH4
-OH-aerosol forcings could more than double the warming effect of large methane increases. Our findings may help explain the anomalously large temperature changes associated with historic methane releases.
Correspondence to:T. Kurt´en ([email protected])
1 Introduction
Among the various worst-case scenarios for catastrophic cli-mate change suggested over the past decades, the so-called clathrate-gun hypothesis (Kennett et al., 2000) is one of the most dramatic. In this scenario, a rise in temperatures leads to the destabilization and subsequent release of methane clathrates in the Arctic permafrost and seabed into the at-mosphere, vastly amplifying the initial warming. This type of mechanism has been suggested as a possible reason for millennial-scale warming during the last ice age, as well as the Paleocene – Eocene Thermal Maximum (PETM; see e.g. Kennett et al., 2000), though the evidence so far is inconclu-sive (Clark et al., 2008; Sowers, 2006). One criticism of the hypothesis is that the amount of methane estimated to have been released during the PETM is not sufficient to explain the observed warming, at least if only the longwave radiative forcings of CH4and its oxidation product CO2are accounted
for. For example Higgins and Schrag (2006) suggest that a large additional (non-methane) source of carbon is required to explain the PETM.
Although the growth rate of methane concentrations in the atmosphere has decreased markedly in the past decade (Clark et al., 2008; Rigby et al., 2008), methane concentrations are predicted to rise significantly on a hundred-year timescale (Riahi et al., 2007). Moreover, recent observations (Hill et al., 2004; Shakova et al., 2010) of large methane emissions in Arctic areas have heated up the discussion on the “clathrate gun” hypothesis, at least in popular media. It is still uncer-tain whether these measurements represent a new source of atmospheric methane, and thus a potential feedback mecha-nism, or a previously unknown part of the natural cycle. In any case, even though a massive release of methane from clathrate reservoirs during this century is currently thought to be improbable, the potential implications of such a sce-nario warrant careful assessment of all potential effects, as well as consideration of possible CH4-related mitigation or
geoengineering options (Boucher and Folberth, 2010). In addition to the direct radiative effects of the methane itself, large methane emissions will have several indirect effects on the radiative balance. A large increase in the methane loading would increase the concentration of tro-pospheric ozone and stratospheric water vapor, while sig-nificantly decreasing the concentration of hydroxyl radicals (OH) in the troposphere (Schmidt and Shindell, 2003; Clark et al., 2008; Shindell et al., 2009). The increased O3 and
stratospheric water vapor concentrations lead (Schmidt and Shindell, 2003; Shindell et al., 2009) to an additional pos-itive radiative forcing that is on the order of a few tens of percent of the direct longwave (“greenhouse-gas”) forcing of methane itself. The decrease in OH concentrations reduces the oxidation rate, and thus increases the lifetime, of many pollutants and trace gases – including methane itself (Hig-gins and Schrag, 2006; Shindell et al., 2009). Furthermore, lower OH concentrations will reduce the formation rate of nucleating and condensing vapors (though this may partly be compensated by increased oxidation of some organic va-pors by ozone), and lead to lower aerosol and cloud droplet number concentrations (CDNC). This will lower the average cloud albedo, decrease cloud lifetimes and cloudiness, and thus further warm the climate.
In a recent study (Shindell et al., 2009) the CH4
-OH-aerosol – forcing was estimated to increase the global warm-ing potential of present-day methane by approximately 40 % (with large error bars) on a 100-yr time scale. However, since the different effects (direct CH4, CH4-O3, CH4-OH-aerosol)
all depend nonlinearly on the CH4concentration, the relative
magnitudes of the different forcings may be very different in a catastrophic clathrate release scenario. Schmidt and Shin-dell (2003) have assessed the CH4-O3and stratospheric H2O
– related forcings over a wide range of methane emission and concentration scenarios in a prehistoric scenario, but to our knowledge this has not been done for the potentially more significant CH4-OH-aerosol forcing.
In this study, we have investigated the magnitude of the CH4-OH-aerosol forcing, and compared it to the direct
long-wave CH4 and CH4-O3 – forcings, for scenarios where the
methane concentration increases by factors of 10 and 100. We also investigated the effect of increasing NOx
concentra-tions by a factor of 2 in a scenario where CH4
concentra-tions were increased by a factor of 10. The CH4-OH-aerosol
forcing has been computed with two different global mod-els: GLOMAP (Mann et al., 2010), which accounts only for the 1st indirect (cloud-albedo) aerosol effect, and ECHAM5-HAM (Stier et al., 2005), which accounts for both the 1st and 2nd (cloud-lifetime) indirect effects. We also inves-tigated the atmospheric chemistry changes associated with large methane increases using the 1-D chemistry – transport model SOSA (Boy et al., 2011).
2 Computational details
2.1 Global models
Oxidant fields were generated with the TOMCAT chemi-cal transport model (Chipperfield, 2006), with CH4
concen-trations fixed at different values (present-day, 10×present and 100×present). Emission estimates for year 2000 were used for all other chemical species. TOMCAT is a three-dimensional off-line chemical transport model (CTM). The model is forced using pre-defined large-scale trans-port and meteorology specified from 6-h European Centre for Medium-Range Weather Forecasts (ECMWF) analyses. TOMCAT includes a detailed tropospheric chemistry scheme (Arnold et al., 2005). In the applied version of TOMCAT, an additional isoprene chemistry scheme was added to the model. The model was run for the year 2005 with a 1-yr spin up, using T42 spectral resolution, which corresponds to a horizontal resolution of about 2.8◦by 2.8◦, with 31 vertical levels up to 10 hPa.
given byJ=2×10⁻⁶s−1[H
2SO4]. The binary nucleation
scheme of Vehkam¨aki et al. (2002) was used in ECHAM runs and the scheme of Kulmala et al. (1998) in GLOMAP runs. Both models also include a representation of secondary or-ganic aerosol based on monoterpene emissions. ECHAM5-HAM and GLOMAP apply prescribed monthly emissions of monoterpenes (Guenther et al., 1995) to estimate emissions of biogenic precursors for SOA. In ECHAM5-HAM, a fixed fraction of 0.15 of emitted BVOCs is assumed to form con-densable SOA immediately after emission. The SOA pro-duction in ECHAM5-HAM is independent of oxidant fields. In GLOMAP, monoterpenes are oxidised to SOA in reactions with O3, OH and NO3with fixed yields of 0.13 for each
reac-tion. In GLOMAP, changes in oxidant fields affect the rate at which monoterpenes are transformed to SOA, but total SOA yields are nearly unaffected in different runs. Both models assume zero saturation vapor pressure for SOA products, so that SOA is partioned on the seven aerosol modes according to the relative condensation sinks of the modes.
The main difference between GLOMAP and ECHAM5-HAM models is that ECECHAM5-HAM5-ECHAM5-HAM generates its own winds and temperatures using climatological values for sea-ice concentration and sea surface temperatures, while GLOMAP uses a pre-defined large-scale transport and mete-orology using ECMWF analyses. Since the ECHAM5-HAM model climate is not fixed, we ran the model for 5 yr for a representative average of CDNC and radiative fluxes, while GLOMAP runs covered 1 yr with 4 month spin-up with re-sults based on the year 2005 climate. The two models also use different approaches for the calculations of cloud droplet number concentrations (CDNC) and cloud radiative forcings: in GLOMAP, boundary layer CDNC is post-processed from aerosol fields using the parameterization of Nenes and Sein-feld (2003), while in ECHAM5-HAM, aerosols are activated to cloud droplets according to the parameterization by Lin and Leaitch (1997), and reported CDNC values are analyzed at cloud-top height.
The indirect aerosol radiative forcing was evaluated as the change in the cloud radiative effect (defined as the dif-ference between all-sky and clear-sky fluxes) at the top-of-atmosphere (TOA). For GLOMAP, only the first indirect aerosol effect was considered and it was evaluated using the offline Edwards and Slingo (1996) (E-S) radiative transfer model with cloud data from the International Satellite Cloud Climatology Project archive (Rossow and Schiffer, 1999) and a monthly averaged climatology based on the ECMWF reanalysis data (Rap et al., 2010). For ECHAM5-HAM, the simulated radiative fluxes are influenced by changes in CDNC as well as cloud fraction and condensate amounts; hence both the 1st and 2nd aerosol indirect effect are in-cluded. For aerosol-related forcings, the difference between TOA and tropopause values is likely negligible, so these val-ues are comparable to the tropopause-level forcings calcu-lated for CH4and O3.
We also calculated the first indirect (cloud-albedo) forcing using ECHAM CDNC fields and the analysis methods of the GLOMAP and E-S models in order to assess the sensitivity of the results toward the details in the forcing calculations.
2.2 1-D chemistry – transport models
The 1-D chemistry – transport model SOSA (a model to sim-ulate the concentrations of organic vapors and sulfuric acid) was used for detailed atmospheric chemistry simulations, with data from the field measurement station in Hyyti¨al¨a, Finland. The model builds upon an atmosphere bound-ary layer model SCADIS (Sogachev et al., 2002; Sogachev, 2009), which includes the vertical transport for moisture, heat, and for other compounds of interest. The chemistry was calculated with the Kinetic PreProcessor (KPP) with more than 2000 reactions generated by the Master Chemi-cal Mechanism (MCM). Emissions of organic vapours (iso-prene, monoterpene, etc.) were predicted by the model MEGAN. A detailed description of the model and initial-ization can be found in Boy et al. (2011). The initial con-centration for methane was first set to mean concon-centration measured in Hyyti¨al¨a (1.8 ppm) to represent the current CH4
concentration scenario. By multiplying this initial value by 10 and 100 times we could then carry out the simulations un-der different CH4concentration scenarios. The same
proce-dure was applied to NOxto get different NOxconcentration
scenarios.
The effect of methane concentration increases on decreas-ing OH concentrations predicted by the SOSA model was very similar to that predicted by TOMCAT for the grid cell and column containing Hyyti¨al¨a, indicating that the lesser chemical detail of the global model is not a significant error source. On the other hand, the effect of increased NOxon
OH concentrations was much greater in the SOSA simula-tions than in TOMCAT.
2.3 CH4and O3radiative forcing calculations
The radiative forcing due to increased methane concentra-tions was estimated in two phases. First, an estimate for the clear-sky radiative forcing was derived using the highly ac-curate (algorithmic accuracy approximately 0.5%) Line-by-Line-Radiative Transfer Model (LBLRTM; Clough and Ia-cono, 1995). Calculations for five McClatchey et al. (1971) standard atmospheres (tropical, midlatitude summer, midlat-itude winter, subarctic summer and subarctic winter) yielded an estimate of 3.14 Wm−2 (8.20 Wm−2) for the average
ECHAM5.4 simulation suggested that clouds reduce the CH4 radiative forcing on average by ∼20 %. Therefore,
we multiplied the clear-sky forcings from LBLRTM by 0.8, which yields all-sky radiative forcings of 2.51 Wm−2 and
6.56 Wm−2for 10-fold and 100-fold CH
4concentration,
re-spectively. Note that the ECHAM5.4 scheme has not been designed to work well for such high CH4 concentrations.
Therefore, we do not directly use the all-sky forcing for this scheme; it is only used to provide a rough estimate of how much clouds influence the forcing.
The net (longwave + shortwave) radiative forcing due to changed O3concentration was estimated in off-line
calcula-tions with the ECHAM5.4 radiation scheme, using the afore-mentioned global dataset. The forcing was evaluated as the difference between calculations for (1) the scenarios with en-hanced methane (10×and 100×CH4) and (2) the reference
scenario. In the reference scenario, O3concentrations were
kept at their present-day values. In the 10×and 100×CH4
scenarios,the O3concentration in each grid cell (x, y, z) was
multiplied by the annual mean fractional change in the O3
concentration predicted by the TOMCAT model for the loca-tion, while everything else was kept unchanged.
2.4 CH4lifetime estimation
The lifetime of methane under different OH concentrations, τCH4([OH]), was computed as follows. First, the lifetime
under present-day OH concentrations, τCH4,present was
as-sumed to be 12 yr, as given in the IPCC 4th assessment report (Solomon et al., 2007). Next, the total contribu-tion of stratospheric and soil sinks given current OH levels ([OH]present)was assumed to be 12 % of the total methane
removal (Schmidt and Shindell, 2003; Solomon et al., 2007). The soil sink very likely does not depend on atmospheric OH, O3or NOxconcentrations, and variations in the stratospheric
sink due to tropospheric chemistry perturbations (and their effects in the stratosphere) are not likely to play a large role in the final lifetime of methane. Therefore, the rate constant as-sociated with the combined non-tropospheric sinks (denoted kother)was assumed to remain constant. The total removal
rate,R, of methane then becomes:
R=kother[CH4] +kOH[OH][CH4] (1)
wherekOH is the average rate constant for removal by OH,
and we have assumedkother=(0.12/0.88)kOH[OH]present=
0.137kOH[OH]present. The lifetime is equal to the methane
concentration divided by the removal rate: τCH4([OH])=
1/(kother+kOH[OH]). Given these assumptions, the lifetime
as a function of OH concentration can be expressed as: τCH4([OH])=τCH4,present×(kother+kOH[OH]present)
/(kother+kOH[OH])
=τCH4,present×1.137kOH[OH]present
/(0.137kOH[OH]present+kOH[OH])
=τCH4,present×1.137
/(0.137+ [OH]/[OH]present) (2) Thus, for example a halving of the atmospheric OH con-centration would lead to a lifetime increase of a factor of about 1.8. The ratio [OH]/[OH]present was assumed to be
roughly equal to the ratio of the average atmospheric con-centrations of OH below 13 km in the simulation runs. (Us-ing the total atmospheric average includ(Us-ing stratospheric OH would tend to underestimate the changes, while us-ing ground-level concentrations would tend to overestimate them.)
3 Results and discussion
The results of this study are summarized in Table 1. The di-rect CH4and CH4-O3forcings are comparable to those
pub-lished previously (Schmidt and Shindell, 2003; Shindell et al., 2009), with the CH4-O3 – forcing amounting to about
20 % of the direct CH4forcing in both scenarios. This is in
agreement with the result of Shindell et al. (2009), who found that roughly one-fourth of the total present-day methane forc-ing (estimated to be 0.99 Wm−2) is due to an increase in
tro-pospheric ozone. Forcing from increased stratospheric H2O
(due to CH4oxidation in the stratosphere) was not assessed
in this study, but is likely of the same order of magnitude – Schmidt and Shindell (2003) found the stratospheric H2O
forcing to be between 23 and 29 % of the total CH4forcing
for a range of paleoclimate scenarios.
Our modeling suggests that in a scenario where methane concentrations increase by a factor of 10, the total indi-rect aerosol-related positive radiative forcing may be around 80 % of the direct CH4 forcing. (Test calculations
indi-cate that the direct aerosol forcing is negative, but below 0.1 Wm−2in absolute value.) The ECHAM5-HAM –
simu-lations predict relatively large changes in global cloud cover and cloud water content, implying a strong secondary indi-rect aerosol effect. The difference between the GLOMAP and ECHAM5-HAM results, which occurs in spite of similar reductions in cloud droplet number concentration (CNDC) in the two models, suggests that cloud-albedo forcing accounts for somewhat less than half of the total aerosol forcing, with the (considerably more uncertain) cloud-lifetime forcing ac-counting for the rest. This ratio is similar to that obtained by Lohmann and Feichter (2005).
The relative ratios of the different forcings are similar for a 100-fold methane increase, though the absolute values of the CDNC and cloudiness changes and the corresponding forcings are naturally much larger. These results indicate that the total radiative forcing associated with large methane increases (including CH4-O3 CH4,-OH-aerosol and
strato-spheric H2O forcings) may be around twice as large as the
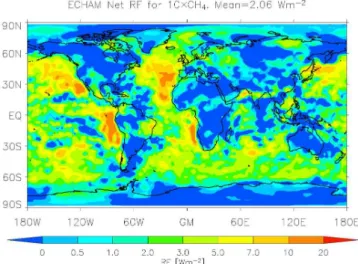
Fig. 1. Predicted aerosol radiative forcing (in Wm−2)(evaluated as a difference in cloud radiative forcing) associated with a CH4 concentration increased by a factor of 10, using ECHAM5-HAM.
Fig. 2. Predicted total aerosol radiative forcing (in Wm−2) (eval-uated as a difference in cloud radiative forcing) associated with a CH4concentration increased by a factor of 100, using ECHAM5-HAM.
resolve the discrepancy between estimated methane releases and warming during the PETM.
The aerosol-related forcings are caused mainly by pertur-bations to the sulfur cycle. In the high-methane scenarios, the oxidation of sulfur dioxide (SO2)by OH into sulfuric
acid (H2SO4)in the gas phase becomes much less effective.
This leads to smaller H2SO4 nucleation and condensation
rates, and to 48 % and 78 % reductions in global Aitken mode sulfate masses in the 10-fold and 100-fold methane scenar-ios, respectively. However, in the high-methane scenarios a significantly larger fraction of SO2is oxidized in the liquid
phase (e.g. by O3), increasing the accumulation mode sulfate
Fig. 3.Predicted percentage decrease in cloud droplet number con-centration (CDNC) when the CH4concentration is increased by a factor of 10, using ECHAM5-HAM.
Fig. 4.Predicted percentage decrease in cloud droplet number con-centration (CDNC) when the CH4concentration is increased by a factor of 100, using ECHAM5-HAM.
masses by 9 % and 15%, respectively. Overall, the changes in Aitken mode aerosols dominate the changes in CDNC, and in the high-methane scenarios the aerosols that can act as cloud condensation nuclei are less numerous but larger. In con-trast to H2SO4, the production rates of gaseous secondary
organics remain nearly unaffected, while the fraction of or-ganics oxidized by O3increases relative to that oxidized by
OH in the high-methane scenarios. It should be noted that the SOA formed by the different oxidants is assumed to be iden-tical in the models. Also, while GLOMAP dynamically cal-culates the sources and sinks of H2O2, an important
liquid-phase oxidant of SO2, ECHAM5-HAM assumes fixed
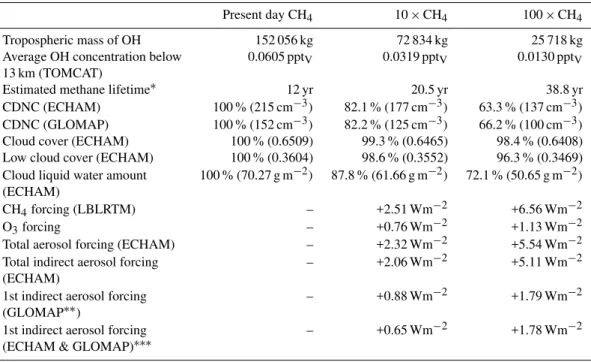
Table 1. Average tropospheric OH concentration, estimated methane lifetime, global mean cloud droplet number concentration (CDNC), changes in the global-mean total and cloud cover and liquid water path, and various radiative forcing components (computed with respect to the present-day atmosphere) associated with three different methane concentrations. For CDNC and other cloud parameters, numbers shown in brackets are absolute values. O3and CH4forcings are computed at the tropopause, and aerosol-related forcings at the top of the atmosphere. LBLRTM=Line By Line Radiative Transfer Model. See the Computational Details – section for details.
Present day CH4 10×CH4 100×CH4
Tropospheric mass of OH 152 056 kg 72 834 kg 25 718 kg
Average OH concentration below 0.0605 pptV 0.0319 pptV 0.0130 pptV
13 km (TOMCAT)
Estimated methane lifetime∗ 12 yr 20.5 yr 38.8 yr
CDNC (ECHAM) 100 % (215 cm−3) 82.1 % (177 cm−3) 63.3 % (137 cm−3)
CDNC (GLOMAP) 100 % (152 cm−3) 82.2 % (125 cm−3) 66.2 % (100 cm−3)
Cloud cover (ECHAM) 100 % (0.6509) 99.3 % (0.6465) 98.4 % (0.6408)
Low cloud cover (ECHAM) 100 % (0.3604) 98.6 % (0.3552) 96.3 % (0.3469)
Cloud liquid water amount 100 % (70.27 g m−2) 87.8 % (61.66 g m−2) 72.1 % (50.65 g m−2)
(ECHAM)
CH4forcing (LBLRTM) – +2.51 Wm−2 +6.56 Wm−2
O3forcing – +0.76 Wm−2 +1.13 Wm−2
Total aerosol forcing (ECHAM) – +2.32 Wm−2 +5.54 Wm−2
Total indirect aerosol forcing – +2.06 Wm−2 +5.11 Wm−2
(ECHAM)
1st indirect aerosol forcing – +0.88 Wm−2 +1.79 Wm−2
(GLOMAP∗∗)
1st indirect aerosol forcing – +0.65 Wm−2 +1.78 Wm−2
(ECHAM & GLOMAP)∗∗∗
∗Present-day lifetime taken from the IPCC 4th assessment report, other lifetimes scaled using the ratio of OH concentrations as described in the Computational Details – section.
∗∗Includes only the cloud-albedo (1st indirect) aerosol effect.∗∗∗Cloud-albedo (1st indirect) aerosol effect computed with GLOMAP, using CDNC fields from ECHAM.
change significantly in the increased methane scenarios, the ECHAM-HAM5 results can not be considered to be realistic for liquid-phase oxidation.
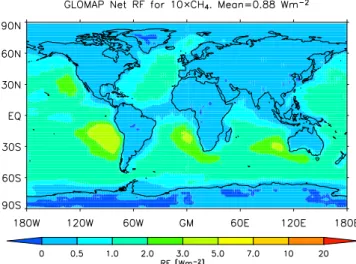
Figures 1 and 2 show the regional distribution of the aerosol-related radiative forcing predicted by ECHAM5-HAM following 10-fold and 100-fold increases in methane, respectively. Figures 3–4 show the corresponding CDNC changes, while Figs. 5 and 6 show the regional distribution of the cloud-albedo radiative forcings from the GLOMAP runs using the E-S radiation model. Figures 7 and 8 show the regional distributions of the cloud-albedo radiative forc-ings computed using ECHAM CDNC fields together with the GLOMAP and E-S analysis tools. The predicted effects of a large CH4increase on aerosol forcings are largest over ocean
areas, especially the eastern parts of the Atlantic and Pacific. This is due to three main reasons. First, the simulated frac-tional changes in CDNC are relatively large in these regions (Figs. 3–4), which implies relatively large changes in cloud optical depth and cloud albedo. Second, these regions fea-ture abundant low cloudiness, which makes changes in cloud albedo particularly important for the radiation budget. Third, the lower albedo of the oceans compared to land areas leads to a greater total forcing for a similar change in cloud prop-erties. The negative forcing observed in some equatorial
re-gions in ECHAM5-HAM (but not in GLOMAP) is due to increase of cloud cover in these areas. While GLOMAP uses prescribed cloud fields of 2005, ECHAM5-HAM simulates changes in cloud cover between different experiments.
The computed forcings, especially the 2nd indirect aerosol effects, are associated with significant uncertainties. In addi-tion to uncertainties in the actual cloud parameterizaaddi-tions, the aerosol microphysics models use a fairly simplistic nu-cleation parameterization, which assumes that the formation of new particles is mainly related to sulfuric acid concen-trations. If organic ozonolysis products also participate in new-particle formation, this would tend to decrease the dif-ferences between present-day and high-methane scenarios, as methane emissions decrease OH but increase O3. This
would weaken the total CH4-OH-aerosol forcing compared
Fig. 5.Predicted cloud-albedo aerosol radiative forcing (in Wm−2) associated with a CH4concentration increased by a factor of 10, using GLOMAP and E-S.
Fig. 6.Predicted cloud-albedo aerosol radiative forcing (in Wm−2) associated with a CH4concentration increased by a factor of 100, using GLOMAP and E-S.
We caution that the applicability of these results to explain prehistoric events (such as the PETM) is hampered by the difference between present industrial-age atmospheric chem-istry and prehistoric conditions, as well as differences in the positions of the continents. For example, the overall ratio of new-particle formation to primary particle sources, and thus the effect of oxidant concentrations on cloud albedo, may have been very different during the PETM than today.
The prospect of methane-related feedback mechanisms has promoted a recent interest in the artificial removal of methane via geoengineering techniques (Boucher and Fol-berth, 2010). Even though the concentration of methane is much less than that of carbon dioxide, its much larger global
Fig. 7.Predicted cloud-albedo aerosol radiative forcing (in Wm−2)
associated with a CH4 concentration increased by a factor of 10, using GLOMAP and E-S with ECHAM CDNC fields.
Fig. 8.Predicted cloud-albedo aerosol radiative forcing (in Wm−2) associated with a CH4concentration increased by a factor of 100, using GLOMAP and E-S with ECHAM CDNC fields.
warming potential (especially after the O3 – and
aerosol-related forcings are accounted for) makes methane removal an attractive option.
We have assessed the feasibility of perturbing tropospheric chemistry artificially in order to increase methane removal. As a proof-of-concept study, we have considered the cat-alytic effect of reactive nitrogen oxides (NOx)on methane
oxidation. In most conditions, increasing the concentration of NOx leads to an increased OH concentration, and thus
a more rapid CH4 oxidation, though at the expense of
in-creased O3 levels. There probably exist potential CH4
addition would include health and ecosystem damage due to air pollution and acidification, so NOxaddition can thus not
be recommended as a real-life mitigation measure.) How-ever, we have conducted our simulations using NOxas a test
case since the NOx-OH-CH4chemistry is well known, and
already included in atmospheric chemistry models.
Preliminary studies using the 1-D chemistry model SOSA (Boy et al., 2011) indicated that in a scenario with 10 times present methane concentration, e.g. a doubling of NOx
lev-els would reduce the methane lifetime significantly (by al-most 40 %). However, global chemistry model (TOMCAT) simulations for the same scenario indicated only a modest in-crease in tropospheric OH (from 0.0319 pptv to 0.0361 pptv), which corresponds to a reduction of the methane lifetime by only 9 % (from 20.5 to 18.6 yr). The corresponding cloud-albedo related cooling associated with the NOx doubling
computed by GLOMAP is only around 0.1 Wm−2. The
dis-crepancy between the 1-D model and the global model in the predicted OH-regeneration through increased NOx
concen-trations (about 50 %) is likely related to the more detailed chemistry included in SOSA. However, other factors like the different emission scenarios for organic vapors and the se-lected assumption of cloud-free conditions in the 1-D model could also be important factors.
4 Conclusions
Using a combination of atmospheric models, we show that the total radiative forcing associated with a large methane in-crease may be around twice as large as the direct greenhouse effect enhancement of the added methane. The main indirect forcing component is the decrease in cloud droplet number concentration, cloud fraction and condensate amount caused by a strong decrease in OH concentrations. We also investi-gated the effect of doubling atmospheric NOxlevels in order
to regenerate OH, but found this hypothetical drastic geo-engineering technique to be ineffective.
Acknowledgements. We thank the Academy of Finland for funding (project numbers 127210, 1127372 and 1118615). N. R. is funded by the NERC National Centre for Earth Observation (NCEO). We thank the CSC IT Centre for Scientific Computing in Espoo, Finland for computer resources.
Edited by: D. Shindell
References
Arnold, S. R., Chipperfield, M. P., and Blitz, M. A.: A three-dimensional model study of the effect of new temperature-dependent quantum yields for acetone photolysis, J. Geophys. Res., 110, D22305, doi:10.1029/2005JD005998, 2005.
Boucher, O. and Folberth, G. A.: New Directions: Atmospheric methane removal as a way to mitigate climate change, Atmos. Environ., 44, 3343–3345, 2010.
Boy, M., Sogachev, A., Lauros, J., Zhou, L., Guenther, A., and Smolander, S.: SOSA - a new model to simulate the concen-trations of organic vapours and sulphuric acid inside the ABL – Part 1: Model description and initial evaluation, Atmos. Chem. Phys., 11, 43–1, doi:10.5194/acp-11-43-2011, 2011.
Cagnazzo, C., Manzini, E., Giorgetta, M. A., Forster, P. M. De F., and Morcrette, J. J.: Impact of an improved shortwave radia-tion scheme in the MAECHAM5 General Circularadia-tion Model, At-mos. Chem. Phys., 7, 2503–2515, doi:10.5194/acp-7-2503-2007, 2007.
Chipperfield, M.: New version of the TOMCAT/SLIMCAT off-line chemical transport model: intercomparison of stratospheric tracer experiments, Q. J. Roy. Meteorol. Soc. 132, 1179–1203, 2006.
Clark, P. U., Weaver, A. J., Brook, E., Cook, E. R., Delworth, T. L., and Steffen, K: Abrupt Climate Change. A report by the U.S. Cli-mate Change Science Program and the Subcommittee on Global Change Research, US Geological Survey, Reston, VA, 459 pp., 2008.
Clough, S. A. and Iacono, M. J.: Line-by-line calculations of atmo-spheric fluxes and cooling rates II: Application to carbon dioxide, ozone, methane, nitrous oxide, and the halocarbons, J. Geophys. Res., 100, 16519–16535, 1995.
Dentener, F., Kinne, S., Bond, T., Boucher, O., Cofala, J., Generoso, S., Ginoux, P., Gong, S., Hoelzemann, J. J., Ito, A., Marelli, L., Penner, J. E., Putaud, J.-P., Textor, C., Schulz, M., van der Werf, G. R., and Wilson, J.: Emissions of primary aerosol and pre-cursor gases in the years 2000 and 1750 prescribed data-sets for AeroCom, Atmos. Chem. Phys., 6, 4321–4344, doi:10.5194/acp-6-4321-2006, 2006.
Edwards, J. M. and Slingo, A.: Studies with a flexible new radiation code I: choosing a configuration for a large-scale model, Q. J. Roy. Meteorol. Soc., 122, 689–719, 1996.
Guenther, A., Hewitt, N. C., Erickson, D., Fall, R., Geron, C., Graedel, T., Harley, P., Klinger, L., Lerdau, M, Mckay, W. A., Pierce, T., Scholes, B., Steinbrecher, R., Tallamraju, R., Tay-lor, J., and Zimmerman, P.: A global model of natural volatile organic compound emissions, J. Geophys. Res., 100(D5), 8873– 8892, doi:10.1029/94JD02950, 1995.
Higgins, J. A. and Schrag, D. P.: Beyond methane: Towards a the-ory for the Paleocene–Eocene Thermal Maximum, Earth Planet. Sci. Lett., 245, 523–537, 2006.
Hill, T. M., Kennett, J. P., and Spero, H. J.: High-resolution records of methane hydrate dissociation: ODP Site 893, Santa Barbara Basin, Earth Planet. Sci. Lett., 223, 127–140, 2004.
Kennett, J. P., Cannariato K. G., Hendy, I. L., and Behl, R. J.: Car-bon Isotopic Evidence for Methane Hydrate Instability During Quaternary Interstadials, Science, 288, 128–133, 2000. Kulmala, M., Laaksonen, A., and Pirjola, L..: Parameterizations
for sulfuric acid/water nucleation rates, J. Geophys. Res.-Atmos., 103(D7), 8301–8307, 1998.
Lin, H. and Leaitch, W. R.: Development of an in-cloud aerosol activation parameterization for climate modelling, Proc. WMO Workshop on Measurement of Cloud Properties for Forecasts of Weather, Air Quality and Climate, Geneva, Switzerland, World Meteorology Organization, 328–355, 1997.
Mann, G. W., Carslaw, K. S., Spracklen, D. V., Ridley, D. A., Manktelow, P. T., Chipperfield, M. P., Pickering, S. J., and Johnson, C. E.: Description and evaluation of GLOMAP-mode: a modal global aerosol microphysics model for the UKCA composition-climate model, Geosci. Model Dev., 3, 519–551, doi:10.5194/gmd-3-519-2010, 2010.
McClatchey, R. A., Fenn, R. W., Selby, J. E. A, Volz, F. E, and Garing, J. S.: Optical properties of the atmosphere, Report AFCRL-71-0279, Available from Air Force Geophysics Labo-ratory, Hanscom Air Force base, MA 01731, USA, 1971. Mlawer, E. J., Taubman, S. J., Brown, P. D., Iacono, M. J., and
Clough, S. A.: Radiative transfer for inhomogeneous atmo-spheres. RRTM, a validated correlated-k model for the longwave, J. Geophys. Res., 102, 16663–16682, 1997.
Nenes, A. and Seinfeld, J.H.: Parameterization of cloud droplet for-mation in global climate models., J. Geophys. Res., 108, 4415, doi:10.1029/2002JD002911, 2003.
Rap, A., Forster, P. M., Jones, A., Boucher, O., Haywood, J. M., Bellouin, N., and De Leon, R. R.: Parameterization of contrails in the UK Met Office Climate Model., J. Geophys. Res., 115, D10205, doi:10.1029/2009JD012443, 2010.
Riahi, K., Gruebler, A., and Nakicenovic, N.: Scenarios of long-term socio-economic and environmental development un-der climate stabilization, Technological Forecasting and Social Change, 74(7), 887–935, 2007.
Rigby, M., Prinn, R. G., Fraser, P. J., Simmonds, P. G., Lan-genfelds, R. L., Huang, J., Cunnold, D. M., Steele, L. P., Krummel, P. B., Weiss, R. F., O’Doherty, S., Salameh, P. K., Wang, H. J., Harth, C. M., M¨uhle, J., and Porter, L. W.: Re-newed growth of atmospheric methane, Geophys. Res. Lett., 35, L22805, doi:10.1029/2008GL036037, 2008.
Rossow, W. B. and Schiffer, R. A.: Advances in understanding clouds from ISCCP, B. Am. Meteorol. Soc., 80, 2261–2288, 1999.
Schmidt, G. and Shindell, D. T.: Atmospheric composition, radia-tive forcing, and climate change as a consequence of a massive methane release from gas hydrates, Paleoceanography, 18, 1004, doi:10.1029/2002PA000757, 2003.
Shakhova, N., Semiletov, I., Salyuk, A., Yusupov, V., Kosmach, D., and Gustafsson, ¨O.: Extensive Methane Venting to the At-mosphere from Sediments of the East Siberian Arctic Shelf, Sci-ence, 327, 1246–1250, 2010.
Shindell, D. T., Faluvegi, G., Koch, D. M., Schmidt, G. A., Unger, N., and Bauer, S. E.: Improved Attribution of Climate Forcing to Emissions, Science, 326, 716–718, 2009.
Sihto, S.-L., Kulmala, M., Kerminen, V.-M., Dal Maso, M., Pet¨aj¨a, T., Riipinen, I., Korhonen, H., Arnold, F., Janson, R., Boy, M., Laaksonen, A., and Lehtinen, K. E. J.: Atmospheric sulphuric acid and aerosol formation: implications from atmospheric mea-surements for nucleation and early growth mechanisms, At-mos. Chem. Phys., 6, 4079–4091, doi:10.5194/acp-6-4079-2006, 2006.
Sogachev, A.: A note on two-equation closure modelling of canopy flow, Bound. Lay. Meteorol., 130, 423–435, 2009.
Sogachev, A., Menzhulin, G., Heimann, M., and Lloyd, J.: A simple three dimensional canopy – planetary boundary layer simulation model for scalar concentrations and fluxes, Tellus, 54B, 784– 819, 2002.
Solomon, S., Qin, D., Manning, M., Marquis, M., Averyt, K., Tig-nor, M. M. B., Miller Jr., H. L., and Chen, Z.(Eds.): Contribu-tion of Working Group I to the Fourth Assessment Report of the Intergovernmental Panel on Climate Change, 2007, Cambridge University Press, Cambridge, United Kingdom and New York, NY, USA, 2007.
Sowers, T.: Late Quaternary Atmospheric CH4 Isotope Record Suggests Marine Clathrates Are Stable, Science, 311, 838–840, 2006.
Stier, P., Feichter, J., Kinne, S., Kloster, S., Vignati, E., Wilson, J., Ganzeveld, L., Tegen, I., Werner, M., Balkanski, Y., Schulz, M., Boucher, O., Minikin, A., and Petzold, A.: The aerosol-climate model ECHAM5-HAM, Atmos. Chem. Phys., 5, 1125– 1156, doi:10.5194/acp-5-1125-2005, 2005.
Vehkam¨aki, H., Kulmala, M., Napari, I., Lehtinen, K. E. J., Timm-reck, C., Noppel, M., and Laaksonen, A.: An improved pa-rameterization for sulfuric acid/water nucleation rates for tropo-spheric and stratotropo-spheric conditions, J. Geophys. Res. 107(D22), doi:10.1029/2002JD002184, 2002.