Westward moving dynamic substorm features observed
with the IMAGE magnetometer network
and other ground-based instruments
H. LuÈhr1,*, A. Aylward2, S. C. Bucher1**, A. PajunpaÈaÈ3, K. PajunpaÈaÈ4, T. Holmboe5, S. M. Zalewski6
1Institut fuÈr Geophysik und Meteorologie, Technische UniversitaÈt Braunschweig, Mendelssohnstraûe 3, D-38106 Braunschweig, Germany 2
Atmospheric Physics Laboratory, University College London, 67 Riding House St., London, W1P 7PP, United Kingdom
3Finnish Meteorological Institute, Geophysical Research Division, P O Box 503, FIN-00101 Helsinki, Finland 4
Finnish Meteorological Institute, NurmijaÈrvi Geophysical Observatory, FIN-05100 RoÈykkaÈ, Finland
5
University of Tromsù, Auroral Observatory, N-9037 Tromsù, Norway
6Polish Academy of Sciences, Institute of Geophysics, Ks. Janusza 64, PL-01-452 Warsaw, Poland
Received: 30 April 1997 / Revised: 20 October 1997 / Accepted: 22 October 1997.
Abstract. We present the ground signatures of dynamic substorm features with particular emphasis on the event interpretation capabilities provided by the IMAGE magnetometer network. This array covers the high latitudes from the sub-auroral to the cusp/cleft region. An isolated substorm on 11 Oct. 1993 during the late evening hours exhibited many of well-known features such as the Harang discontinuity, westward travelling surge and poleward leap, but also discrete auroral forms, known as auroral streamers, appeared propagat-ing westward along the centre of the electrojet. Besides the magnetic ®eld measurements, there were auroral observations and plasma ¯ow and conductivity mea-surements obtained by EISCAT. The data of all three sets of instruments are consistent with the notion of upward ®eld-aligned currents associated with the mov-ing auroral patches. A detailed analysis of the electro-dynamic parameters in the ionosphere, however, reveals that they do not agree with the expectations resulting from commonly used simplifying approximations. For example, the westward moving auroral streamers which are associated with ®eld-aligned current ®laments, are not collocated with the centres of equivalent current vortices. Furthermore, there is a clear discrepancy between the measured plasma ¯ow direction and the obtained equivalent current direction. All this suggests that steep conductivity gradients are associated with the transient auroral forms. Also self-induction eects in the ionosphere may play a role for the orientation of the plasma ¯ows. This study stresses the importance of multi-instrument observation for a reliable interpretat-ion of dynamic auroral processes.
Keywords. Ionosphere (Auroral ionosphere; Electric ®elds and currents; Ionosphere-magnetosphere interactions).
1 Introduction
Ground-based magnetic ®eld measurements have been used for more than a century to investigate the electrodynamics of ionospheric current systems (e.g. Birkeland, 1908; Chapman, 1935). Now new ground-based measurement techniques such as coherent and incoherent radars or imaging riometers that observe the ionosphere remotely, have become available. These new facilities together with space-born instrumentation have made it possible to draw a unique picture of the three dimensional current systems connecting the magneto-sphere and ionomagneto-sphere, thus resolving the ambiguity arising when current systems are derived solely from ground-based magnetic ®eld observations (Fukushima, 1976). In spite of that limitation magnetometer arrays have proved to be a very powerful tool for character-ising the types of auroral phenomena and for determin-ing their temporal and spatial developments. A great number of useful techniques for utilising magnetic ®eld data when interpreting auroral phenomena have been developed in association with the International Magne-tospheric Studies (IMS) (see Untiedt and Baumjohann, 1993 for a review). One of the most recent famous discoveries made with magnetometer arrays is the identi®cation of travelling convection vortices (TCV) (Friis-Christensen et al., 1988; Glaûmeieret al., 1989).
In this study we investigate a substorm period in the pre-midnight sector showing many of the classical features. Well-known in this respect are the westward travelling surges (WTS) (Akasofuet al. 1965). The WTS is a spectacular and highly dynamic phenomenon. At a pre-existing stable arc the intensity suddenly increases and it expends poleward and westward. The shape of
*Present address:GeoForschungsZentrum Potsdam,
Telegrafenberg, D-14473 Potsdam, Germany
**
Present address:Solar Terrestrial Environment Laboratory, Nagoya University, Honohara 3-13, Toyokawa, 442 Japan
westward propagating auroral band resembles that of a surge on the ocean running onto the beach. Observed velocities of WTS range from several to ten kilometers per second (e.g. Opgenoorth et al., 1983). In the magnetogrammes their appearance mark the onset of a substorm. In the surge head, a strong upward ®eld-aligned current ¯ows, which is believed to divert the westward electrojet at its western end into the magne-tosphere. A comprehensive description of the electrody-namics in the ionospher associated with a WTS has been given by Opgenoorthet al. (1983). Subsequent to a WTS sometimes less spectacular auroral bright spots show up which also propagate westward but at a speed of the order of 1 km/s (see Nakamura et al., 1993 or Elphin-stone et al., 1996 for a review). These features, named auroral streamers, have received only a little attention in the literature up to the present.
In the magnetogrammes the auroral streamers gen-erate a variation predominantly in the eastward com-ponent when passing by. Because of the fast motion of the features, information obtained by a single magne-tometer is of limited value. More suitable are arrays of stations, since the drift velocity of the structure can be inferred from the date of two or more suciently widely separated magnetometers. Furthermore, magnetometer data can be used to construct maps of equivalent ionospheric currents. These equivalent current patterns are not easy to interpret, if the conductivity exhibits spatial gradients, as expected in the presence of discrete auroral forms. Here incoherent scatter radar data can complement the picture. With tristatic systems like EISCAT, the electric ®eld vector and the conductivity distribution at a single point can be determined simul-taneously, thus allowing us to separate the observed ionospheric currents into their Hall and Pedersen components. Data from magnetometer arrays, on the other hand, are vital for radar observers in order to distinguish between temporal variations in the radar-derived quantities and those caused by auroral struc-tures moving through the radar beam.
In a study ofW-bands LuÈhr and Schlegel (1994) have
demonstrated the value of combined magnetic ®eld and radar data sets. Special attention was paid in that study to the precise phasing of the measurements at the dierent sites with respect to the moving current structures. We make use of the same technique in order to ®nd out for the westward drifting auroral structures the spatial relationships between peaks in ionospheric currents, electric ®elds, conductivities and auroral lumi-nosity.
In the following we will ®rst present a short introduction of the IMAGE magnetometer network and then describe the All-Sky-Camera (ASC) and EISCAT data used in this study. In Sect. 3 the observations obtained by all three sets of instruments during our event on 11 October 1993 are presented. Subsequently we combine the measurements of the various facilities trying to achieve a picture of the phenomenon that is as comprehensive as possible. Finally we make an attempt to ®t our observations in the global picture of a substorm.
2 Instrumentation and data sets
The magnetic ®eld observations used in this study have been obtained by the International Monitor for Auroral Geomagnetic Eects (IMAGE) magnetometer network. Within this project there are 15 ground-based magne-tometers covering the range from sub-auroral through auroral latitude, up to cusp/cleft regions in the Europe-an sector. Figure 1 shows the location of the stations and their names, co-ordinates of the sites are listed in Table 1. Key features of the IMAGE magnetometer network have earlier been published in STEP Interna-tional (LuÈhr, 1994).
The IMAGE project is a joint venture of six European institutions. The tasks to be covered by the groups include: supplying the instruments and ensuring their maintenance; retrieving, pre-processing and cor-recting the data; distributing plots and data tapes among the members. The ®nal data are stored in a common ASCII format which has been described earlier (IAGA News, 20, 112, 1981).
The magnetometers deployed in this project are not all of the same type. The groups providing hardware have installed those kinds of instruments they are most
familiar with. All magnetometers meet, however, certain standards in calibration, stability and frequency re-sponse ensuring that a homogeneous set of data emerges from the measurements. Samples are taken at 10 s intervals and the resolution of the instruments is 1 nT or better. Special attention is paid to a precise timing of the readings. This is particularly important when velocities of current structures are deduced from propagation delays between stations.
The instruments in the northern part of the Scandi-navian mainland [Sùrrùya (SOR), Masi (MAS), Kevo (KEV), KilpisjaÈrvi (KIL), Muonio (MUO) and Pello (PEL)] were supplied by the Technical University of Braunschweig. They formerly constituted the ``EISCAT Magnetometer Cross'' which was in continuous opera-tion from October 1982. The devices that sense the magnetic ®elds are three orthogonal ¯uxgate sensors of the double rod type. Output voltages are digitised to 12 bit words providing a dynamic range of 2000 nT at a resolution of 1 nT. The internal sampling rate is 3.2 Hz, but readings are averaged over 10 s before recording. Once per day an automatic self-check is initiated which allows us to assess the performance of critical compo-nents and which also includes a calibration of the sensitivity. The results of the test are recorded and analysed during the data processing. Highly stable quartz crystal oscillators guarantee a time accuracy to a few seconds throughout the year. Stations are powered generally by line power, but back-up batteries are installed which can bridge power breaks up to 24 hours. A detailed description of these stations base been given by LuÈhret al. (1984).
The three southernmost stations NurmijaÈrvi (NUR), Hankasalmi (HAN) and OulujaÈrvi (OUJ) joined the IMAGE network in Autumn 1992. NUR is identical with the NurmijaÈrvi Geophysical Observatory of the
Finnish Meteorological Institute and HAN is its ®eld station. OUJ is run by the Geophysical Observatory of Oulu University. They all are equipped with ¯uxgate magnetometers (FGM) made by the Danish Meteoro-logical Institute. For redundancy purposes NUR is also running a Polish torsion photo-electric magnetometer (TPM), as at Hornsund. The magnetometers have dynamic ranges 3000 nT and the resolution is 0.1 nT. The sensors are in temperature stabilised rooms and the baseline stability of the magnetometers is better than 5 nT per year. Accurate timing is provided by GPS or Omega receivers. Data are collected on com-puter hard discs and transferred via telephone lines from HAN and OUJ to the NurmijaÈrvi observatory for processing.
At the Polish Polar Station Hornsund on Spitsber-gen, continuous recordings of the Earth's magnetic ®eld have been carried out by means of a portable magne-tometer station since 1978. The sensing elements are three quartz torsion variometers of Bobrov type, utilis-ing photo-electric converters which transform the vari-ations of three geomagnetic elements into voltage changes. Starting from July 1985 data have been stored digitally on magnetic tapes. In August 1993 a redundant set of new data recorders were installed, which provide a four times better resolution (0.1 nT). The data are read out from the internal memory with a PC. Floppy disks are the medium on which the data are transported back to base. On joining the IMAGE project in October 1993, the sampling was changed from 30 s to 10 s and furthermore the orientation of the sensor elements were aligned to geographic directions (X, Y, Z). The timing of the recordings is controlled by the precise station clock. Absolute measurements of the magnetic elements D, I, F are performed frequently to check and improve the stability of the base lines.
Table 1.Locations of the magnetometer stations IMAGE (International Monitor for Auroral Geomagnetic Eects)
Station name Code Geographic AACGM magnetica Approximate
Latitude Longitude Latitude Longitude L-value
Ny AÊlesund NAL 78.92 11.95 75.9 112.7 ±
Longyearbyen LYR 78.20 15.82 75.0 113.4 ±
Hornsund HOR 77.00 15.60 73.9 110.8 15.8
Hopen Island HOP 76.51 25.01 72.7 116.2 11.5
Bear Island BJN 74.50 19.20 71.2 109.2 10.3
Sùrùya SOR 70.54 22.22 67.0 106.9 7.1
Tromsù TRO 69.66 18.94 66.3 103.6 6.7
Andenesb AND 69.30 16.03 66.1 101.1 6.5
Kevo KEV 69.76 27.01 65.9 109.8 6.4
Masi MAS 69.46 23.70 65.8 107.1 6.4
KilpisjaÈrvi KIL 69.02 20.79 65.5 104.5 6.3
Muonio MUO 68.02 23.53 64.3 105.8 5.7
Kirunab KIR 67.83 20.42 64.3 103.2 5.7
SodankylaÈb SOD 67.37 26.63 63.5 107.8 5.4
Pello PEL 66.90 24.08 63.1 105.4 5.2
OulujaÈrvi OUJ 64.52 27.23 60.5 106.5 4.3
Hankasalmi HAN 62.30 26.65 58.2 104.9 3.7
NurmijaÈrvi NUR 60.50 24.65 56.4 102.5 3.4
a
Altitude Adjusted Corrected Geomagnetic coordinates (Baker and Wing, 1989)
bAdded to the IMAGE data set from mid 1996
In addition, since October 1993 the four stations on the Svalbard archipelago Bear Island (BJN), Hopen Island (HOP), Longyearbyen (LYR), Ny AÊlesund (NAL) and the station Tromsù (TRO) have been part of the IMAGE magnetometer network. All of them are operated by the University of Tromsù. The instruments are ¯uxgate magnetometers fabricated by the University of Tromsù. The sensors are of the double rod/Vacquier type. An electronics unit with internal A/D-converter and a standard PC for data recording are used. The signals are digitised to a resolution of 1 nT and the dynamic range is 8000 nT. The internal sampling rate is 2.5 Hz, but only averages over 10 s are recorded. The timing accuracy of the recordings is continuously improved. By September 1995 the stations NAL, LYR, BJN and TOR were equipped with a GPS clock receiver assuring an accuracy better than a second. HOP was upgraded in summer 1996. Absolute measurements are performed once or twice a year. The stability of the base lines is 1±2 nT/y, except for HOP, due to problems with permafrost there.
By the time of publication, data from three more observatories (Andenes, Kiruna and SodankylaÈ) are being routinely added to the IMAGE network. Coor-dinates of these sites are included in Table 1. For checking the actual status of the network we recom-mended readers to visit the WWW-site (http:// www.geo.fmi.®./image/).
The Finnish Meteorological Institute is operating four All-Sky-Cameras (ASCs) in the Scandinavian sector (KEVo, KILpisjaÈrvi, MUOnio, SODankylaÈ) and one on Spitsbergen (HORnsund). Pictures are taken by a 16 mm Paillard Bolex camera looking into a spherical mirror from above. The mirror re¯ects the whole sky into the camera. In this way auroras appear as seen from above. In addition each picture contains a digital time display on the east-side and radioactive lights as standards for the colours. A crystal clock controls the time of exposure to within a second. The interval between the pictures can be selected from 20 s to 1 h (1 min in this case) and the exposure time can be set from 2 to 16 s (2 s in this case). The camera is installed in the centre of the image blacking out a cone of 30°. This black spot can be used to estimate spatial scales of auroras.
On 11 October 1993, from 1200 UT until 1900 UT, the EISCAT radars were running the UK Special Programme MTVU. This was intended primarily for topside studies. Both UHF and VHF systems were in operation. The VHF was running a variant of Common Programme 7, measuring vertically above Tromsù. This data is not used in the current study, and so will not be described further. Intended as a means of mapping the magnetic ®eld lines intersecting the VHF beam at various heights, the UHF ran a 4-point elevation scan in a vertical plane oset 2.5°east of north. It measured
for approximately 1 minute each at 43.6°, 55°, 70°and 90° elevation, taking 5-min for the cycle allowing for movement time. The Tromsù UHF made full spectral measurements from 200 km range to 956 km range in increments of 31.5 km (though the gates overlap to
some extent). It also measured a power pro®le from 75 km to 447 km range in 2.1 km increments. The dierence between ``spectral measurements'' and ``pow-er pro®le'' measurements is that a ®t for the full set of plasma parameters can only be made on the former, the power pro®le gives only a pro®le of returned power with range. The power pro®le is, however, primarily a measure of electron density, and so can be used, with some assumptions, to give a range pro®le of electron density, to within about 20±30% accuracy.
The ¯ow velocity vectors have been derived from the simultaneous measurements at the three sides Tromsù, Kiruna and SodankylaÈ from a common volume at 280 km altitude. Vector velocities derived from the position furthest north are more noisy than desirable. Because of the close alignment of the Tromsù and Kiruna beam, the uncertainty is mainly con®ned to the east-west component.
3 Observations
The event we are going to study occurred on 11 October 1993. This day was moderately active with Kp ranging between 3.0 and 5.3. There are unfortunately no interplanetary magnetic ®eld (IMF) data available for that day. We therefore do not have direct information on the energy input into the magnetosphere. Some indirect information may be obtained from the readings of globally distributed magnetometers, as published in ``Provisional Geomagnetic Data Plots'' by Kyoto Uni-versity. At 1415 UT we ®nd, globally, a sudden enhancement in the ionospheric plasma convection which is probably caused by an elevated solar wind input to the magnetosphere. Also in the Scandinavian sector 1415 UT marks the onset of enhanced activity, especially at Svalbard stations (see Fig. 2).
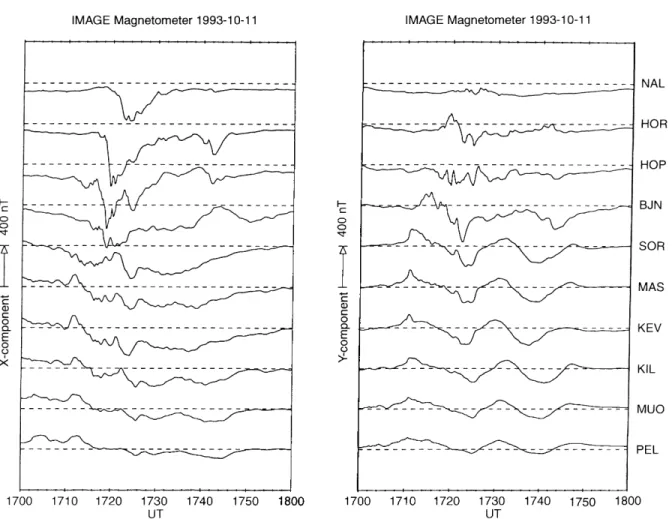
The event studied in some detail is the substorm commencing at 1710 UT (Fig. 2). Scandinavia was located at the westward end of the electrojet during this event. There was no indicating of a negative bay at Iceland stations. Worth mentioning are the peculiar variations in the Y (eastward) component between 1700 and 1800 UT right in the middle of the substorm (Fig. 2). These wave-like structures are at the focus of this study.
3.1 Magnetic ®eld observations
Fig. 2. Magnetograms obtained along the meridian from Svalbard to Finland. Of special interest for this study is the hour 17 to 18 UT
becomes negative, ®rst at SOR then at BJN and it continues to be progressively delayed at stations further north. The lifetime of the negative bay is, in the north, relatively short (10 min at NAL) compared to that at southern stations. By about 1750 UT the ®eld compo-nents at all stations are back to undisturbed levels.
A remarkable feature in the Y (eastward) compo-nents at all stations south of BJN is a sinusoidal variation comprising two full cycles. The period of these waves starting at 1720 UT is about 17 min. A compar-ison of the stations on the ¯anks reveals that the signature appears delayed by about 3 min at KIL, located to the west of the chain, with respect to KEV which is some 250 km further east. Such a propagation delay implies a moving current system as the cause for these variations in Y.
The Z (vertical) component (not shown here) is in¯uenced both by the westward electrojet evident in the X component and by the moving current structures revealed from the variations in Y. On average we ®nd a positive de¯ection of the Z component at stations north of BJN and a negative excursion south of it. This implies an average location of the electrojet close to BJN. At the time of the sinusoidal waves in Y we see similar variations in Z but the latter lead the former by about 60° in phase. This relation favours also the idea of a
westward propagation of some current features.
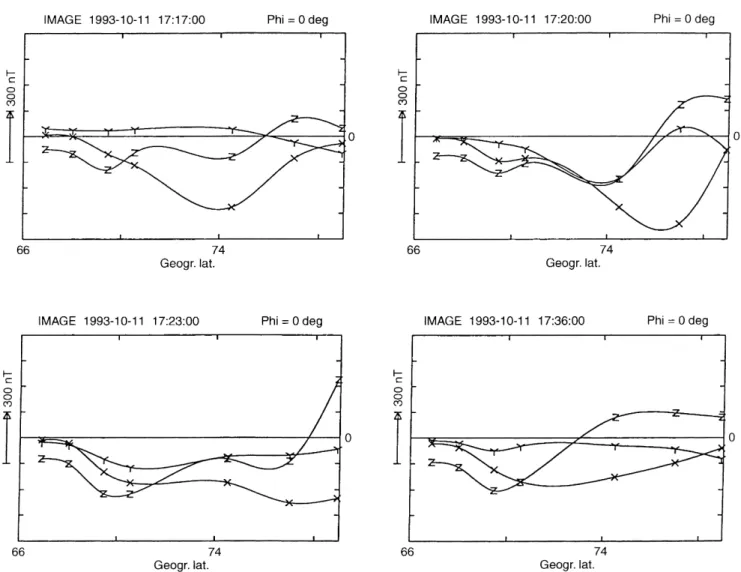
We stated already that the westward electrojet ®rst appeared at station SOR and subsequently propagated poleward. The dynamics of the electrojet can best be assessed when looking at latitude pro®les, which give a synoptic view of the magnetic de¯ections along a magnetic meridian. Figure 4 shows magnetic pro®les for four dierent times. The X (northward) component can be regarded as a ®rst order measure for the electrojet intensity and its north/south extent, Y (eastward) should be zero everywhere for an electrojet ¯owing due east/west. Z is expected to be negative in the south and positive in the north of a westward electrojet. The ®rst three frames in Fig. 4 show the situation after the substorm onset. In all cases we have a negative de¯ection of X, which is indicative of a westward electrojet. The peak amplitude propagated northward at a rate of about 2° in latitude per 3 min.
At 1723 UT the jet had reached its northernmost position with the centre close to 78° geographical latitude (75° magnetic latitude). Just after the onset at 1712 UT the electrojet centre was near SOR (70.5°
geographic latitude). It hence propagated poleward about 800 km at an almost constant speed of 1.2 km/s. The intensity of the electrojet increased until it reached the peak amplitude just before 1720 UT (see Fig. 4, Frame 2) and decayed gradually until 1730 UT.
At the time of Frame 3 (1723 UT) a new electrojet formed further south near SOR. This one persisted until 1745 UT and did not move much in latitude. The last frame in Fig. 4 shows that we had a clear single electrojet con®guration around 1736 UT. The interpr-etation of the Y and Z components in these latitude pro®les is not straight forward, since there were, in addition to the electrojet smaller-scale current structures moving overhead the stations.
A more appropriate way of visualising the moving current structures is to plot the distribution of equiva-lent currents. These are pseudo currents in the iono-sphere which could be the cause for the observed magnetic ®eld variations. Assuming that the scale size of the current structure is much larger than the ionospheric height, we may write for the equivalent currents.
JX ÿ2=l0BY; JY 2=l0BX 1
wherel0is the permeability of free space andBXandBY are the magnetic ®eld de¯ections on the ground.
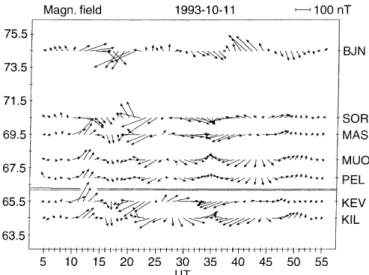
The purpose of the equivalent current plot in Fig. 5 is to assess the features of the smaller-scale current structures. For that reason the data have been
high-pass ®ltered by subtracting a running average over 20 min prior to plotting. In this way we get rid of the dominating contributions from the electrojet. Figure 5 shows the traces of equivalent currents plotted along the latitude of the various stations. Exceptions are KEV and KIL on the ¯anks which have been included for reference at the bottom.
The ®rst prominent feature in Fig. 5 appeared at 1710 UT with strong southward currents. During the subsequent minutes these turned towards west at SOR and towards east at all stations south of SOR. A feature like this has previously been identi®ed by Opgenoorth
et al. (1983) as the ground signature of a westward travelling surge (WTS). The surge head is suggested from these signatures at a latitude close to SOR.
Prominent features at later times are a sequence of current vortices with alternating directions of rotation. The ®rst, centred at 1726 UT, rotated clockwise, the next at 1735 UT anti-clockwise and the last, another 8 min later, clockwise again. These vortices were also observed at the stations on the ¯anks. There is a remarkable similarly between the signatures at the two sites, but variations show up 3 min earlier at KEV, in Fig. 4.Latitudinal pro®les of the magnetic de¯ections. The westward electrojet, indicated by the minimum, in X propagates poleward in the®rst three frames. By the time of thethird framea new electrojet forms which is more or less stationary for the subsequent 30 min
the east, than at KIL. These characteristics imply that the sinusoidal variations in the Y component were caused by current vortices, varying only little in time, but drifting westward overhead the stations.
The drift velocity can be estimated by determining the signal propagation delay between KEV and KIL. With the help of a cross-correlation analysis we obtained a time delay of 20 s for the WTS and 170 s for the drifting vortices. Considering the distance of 250 km between KEV and KIL these times convert to 12 km/s and 1.5 km/s for the WTS and vortices, respectively. Because of the 10-s-sampling the relative uncertainty in the velocity is considerably larger for the WTS. Fur-thermore, since we have only a two-point measurement, it is impossible to decide whether the surge really travelled at this high speed or whether the short delay is caused by a combined eect of expanding and travelling. Knowing the velocity of the current vortices we can estimate their spatial scales. The centres are separated in the time series by 8 to 9 min which converts to a diameter of 750 km in east/west direction. For estimat-ing the north/south extent it seems to be reasonable to take the latitude where the currents have reached half their amplitude which occurs at PEL. With this convention we again get a scale size of more than 700 km for the diameter in this direction. Thus, the equivalent currents seem to form a fairly circular pattern.
Vortices of equivalent currents tend to surround ®eld-aligned current ®laments reaching into the iono-sphere. Due to the current continuity, the FACs have to be closed in the ionosphere
j
00 divJ 2
where J is the height integrated current density in the ionosphere. With a homogeneous conductivity distribu-tion only Pedersen current contributes to the current closure. Under those conditions the electric ®elds, which are aligned with the Pedersen currents form, convergent
patterns around upward-directed FACs and a divergent pattern around downward FACs.
The magnetic ®eld de¯ections on the ground are caused in the ®rst case by ionospheric Hall currents. For large-scale currents and homogeneous conductivities the simple relation holds
bl0= 2B0JHB01=2l0RHE 3
wherebis the magnetic de¯ection on the ground,JHthe height integrated Hall current density, B0 the ambient
magnetic ®eld, RH the height integrated Hall
conduc-tivity and E the ionospheric electric ®eld. It is evident from Eq. (3) that under these simplifying conditions the magnetic ®eld de¯ections on the ground are co-aligned with the ionospheric electric ®elds.
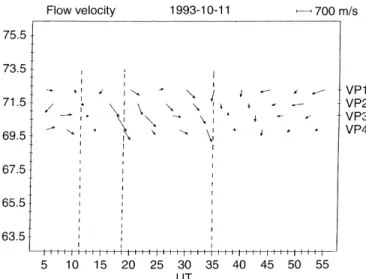
Figure 6 shows the horizontal component of the magnetic ®eld de¯ection. Here again we have used the high-pass ®ltered data. Therefore the contribution of the prevailing electrojet is suppressed. As stated already these vectors can in the ®rst instance be interpreted as the electric ®eld distribution.
Quite prominent in this ®gure are two regions of diverging vectors around 1726 and 1743 UT. Clearly converging vectors appear at 1735 UT and are a little less clear at 1718 UT. The two traces at the bottom show again the time delay between the stations KEV and KIL. According to the electric ®eld signature mentioned our measurements suggest a sequence of upward, down-ward, updown-ward, and downward FAC ®laments between 1718 and 1743 UT. The de¯ection vectors just after 1711 UT which are associated with the WTS, are hard to interpret in terms of electric ®elds, since steep conduc-tivity gradients are known to exist in the vicinity of a WTS (Kirkwoodet al., 1988).
From these presented observations we deduced the dynamics of the electrojet, determined the size and velocity of embedded smaller-scale current systems, and localised the centres of FAC ®laments. For all these assessments assumptions had to be made. Observations from other facilities are required for validation.
Fig. 5.Map of equivalent ionospheric currents (northto thetop,east to theright). A running average over 20 min has been subtracted from the data before plotting
3.2 Auroral observations
To back up the magnetic ®eld observations presented in the previous section we present here the all-sky camera photos taken at the stations KIL and KEV. Since this substorm occurred quite early in the evening, light conditions were not too favourable at KIL until 1730 UT. At KEV, 5°further east, good auroral images
could be obtained from about 1700 UT onward. Individual stages of the auroral development are shown in Fig. 7. In the beginning from 1700 to 1710 UT there is a relatively stable discrete arc running from east to west through the zenith of KEV. As an example three consecutive frames from 1703 to 1705 UT are shown. An auroral bulge formed at 1710 UT to the east of KEV and on the poleward boundary of the pre-existing discrete arc. One minute later it passed north of KEV (see Fig. 7) and at 1712 UT the bulge has reached already KIL (not shown here because of low contrast). Another auroral feature showed up to the east of KEV at 1714 UT. This one also moved westward but at slower speed. Around 1715 UT it passed the zenith of KEV (Fig. 7). The daylight was still too bright at KIL to determine the arrival time of the auroral form there.
A last auroral patch formed again northeast of KEV at 1730 UT. One minute later it passed overhead KEV on its way to the west. At this time conditions were better at KIL and we can identify the arrival time at KIL (1734 UT) from the last three frames in Fig. 7. The rest of the hour until 1800 UT was completely void of auroral activity.
The auroral observations made during the hour of interest (1700±1800 UT) can be summarised as follows. Immediately after sunset there was a stable arc at the
zenith of KEV running from east to west. At 1710 UT an auroral bulge formed poleward of the arc and travelled at high speed westward. This auroral feature is consistent with our interpretation of the magnetic signatures at that time being caused by a WTS. At 1715 and again at 1731 UT north-south elongated auroral features passed overhead KEV on their way to the west. The last one at least was observed 3 min later over KIL. Here again we ®nd a convincing match between the appearance of the auroral forms and the formation of upward FACs, as deduced from magnetic ®eld observations. Also the westward propagation speed found with both systems is identical. A direct compar-ison of the times when the auroras passed overhead with the prediction of the FAC centres from Fig. 6 reveals, however, a systematic dierence. The auroral features were in the zenith of KEV at 1715 and 1731 UT while the estimates from the magnetic measurements give 1717 and 1733 UT. At KIL we reveal 1734 and 1736 UT from the optical and magnetic measurements, respectively. The aurora appeared systematically 2 min earlier than expected from magnetic variations. A discussion of this apparent discrepancy will be presented in a later section.
3.3 EISCAT measurements
A clue towards understanding of the slight but system-atic discrepancy between optical and magnetic observa-tions regarding the position of upward directed FACs might be oered by the EISCAT measurements. Before going into these details we present the two parameters, plasma velocity and ionospheric conductances which were obtained by EISCAT.
Fig. 7.Series of all-sky photos showing the prominent auroral features studied. The light conditions at KIL allow for reproducible pictures only after 1730 UT
Plasma velocities have been acquired at four posi-tions northward of Tromsù. The ionospheric footprints of the common volumes ranged from overhead Tromsù to a location 3.5° further north (see Fig. 1). Figure 8 shows the two, northward and eastward, components of the plasma velocity at the four beam positions. VP1 denotes the position furthest north and VP4 the one just north of Tromsù.
At the beginning, just after 1500 UT, we had extremely high westward ¯ows reaching almost 3 km/s in the south. Later on they were lower but still westward in general. Only during 1700 to 1800 UT, the hour of interest, were the ¯ow directions predominantly east-ward. This is consistent with the ®rst appearance of a westward electrojet over Scandinavia. Later on west-ward ¯ows again dominated. The northwest-ward component of the ¯ow varied about zero. During the hour under study it showed, however, a persistent southward component.
The other parameters obtained by EISCAT are the height integrated Hall and Pedersen conductivities, hereafter termed conductances. Raw densities integrated along the Tromsù beam have been used for their calculation, since the pulse code used was not well suited to determine the E-region electron temperature. Figure 9 shows the Hall conductances obtained at the four beam positions. The latitude dierence between
position P4, vertically above Tromsù, and position P1, furthest north, amounts to a little more than 1°. It has to
be kept in mind that conductances were not sampled continuously. Due to beam swinging only an average, over about a minute, was taken at each position during the 5 min cycle period.
The conductances in the four panels of Fig. 9 re¯ect quite nicely all the dierent events which have been identi®ed in the other data sets. Before the WTS the conductances are rather low except for the position P3. This is also the latitude where the largest conductances during the passage of the WTS RH 50 S were
observed. Toward the north the WTS associated ampli-tudes became smaller and in the south (P4) there was no response at all.
The next prominent feature appeared around 1735 UT. Enhanced conductances coincided with the time when the second auroral feature passed the longitude of Tromsù. Largest amplitude are found here at highest latitudes. The conductance gradually levelled o within the next 10 min. A correlation with the ®rst auroral feature which would be expected at 1719 UT is not so obvious.
The RH=RP ratio also shown in Fig. 9 can be
considered as a measure for the mean energy of the precipitating electrons (Robinsonet al., 1987). The ratio tends to approach 1 during periods of low conductances
and 2 for more active periods. The fairly low elevation beams (positions P1: 43.6°, P2: 55°) were gathered over a range of latitudes thus RH and RP are no longer
collocated. In the case of P1 they are separated by about 20 km. In particular, at the time of the WTS, when there are large conductivity gradients, the ratio shows quite a scatter (Fig. 9).
For a more direct comparison between magnetic ®eld and EISCAT measurements Fig. 10 shows the horizontal component of the plasma velocity in a latitude versus time frame at the same scale as Figs. 5 and 6. During the hour following 17 UT we had a dominant southwesterly ¯ow. Very clearly marked in the ¯ow data is the WTS. Here the velocities at all positions approach zero. Also during the passage of the second auroral feature velocities become very small. Enhanced conductances seem to correlate with low velocities and vice versa. It has to be kept in mind, however, that the four conductivity measurements cover only the latitude band between the two southern velocity positions.
In the case of a homogeneous conductivity distribu-tion in the ionosphere the plasma should ¯ow in the opposite direction to the Hall current. Under the same conditions our equivalent currents, deduced from mag-netic ®eld de¯ections would represent the Hall current pattern. Hence, in that case, plasma ¯ow and current vectors should point in opposite directions. A compar-ison between Figs. 5 and 10 clearly reveals that this condition is not ful®lled for most of the time. This situation is particularly obvious around the time of the second auroral feature (1735 UT). Before the event, both ¯ows and currents have strong southward compo-nents and afterward the ¯ows are small or weakly southward while there are strong northbound currents. All that suggests that there are steep conductivity gradients present prohibiting a simple interpretation of the equivalent currents.
4 Interpretation
In the previous section we presented the observations instrument by instrument. Now we will look at the data in a more event-orientated way. By combining the measurements from all instruments we hope to produce a picture that is as comprehensive as possible for dierent phenomena.
4.1 Harang discontinuity
Auroral images taken at KEV during the early minutes after 17 UT show a rather narrow luminous band running from east to west across the sky (see Fig. 7). Such auroral features appearing in the late evening Fig. 9.Ionospheric conductivities obtained by EISCAT at four positions. Theshort vertical barsconnected bydotted linesgive the Hall conductance.Crossesmark the obtained Hall/ Pedersen conductance ratio. Passage of the auroral forms is marked byvertical lines
Fig. 10.Map of ¯ow velocities obtained by EISCAT. Same format as Fig. 5, but no average ¯ows subtracted
hours have often been associated with the Harang discontinuity (HD) (Koskinen and Pulkkinen, 1995) which is the boundary between poleward and equator-ward electric ®elds. The term Harang discontinuity has recently been controversially discussed concerning its de®nition. In spite of this debate we would like to use this term in its traditional sense, keeping in mind that it does not describe a plasma discontinuity but just the night-side ¯ow reversal. In the magnetic ®eld recordings the HD manifests itself as the zero crossing of the X component. In Fig. 3 we see that there is a zero crossing of X at SOR around 1704 UT and at KEV the X component varies around zero for several minutes. The same is true for TRO (not shown here). All this is consistent with associating the auroral band with the HD.
The conductance measurements obtained by EI-SCAT show elevated values up to RH30 S only at
the P3 position, which is about 35 km north of the station TRO. Conductance values of this order have earlier been reported for the HD by Inhesteret al. (1992) and Amm (1995). The fact that the conductivity is only enhanced in one of the beam positions which are separated by 40 km, places narrow bounds on the width of the conductive strip. The north/south extent of the auroral band, estimated from Fig. 7 amounts to about 50 km. For comparison, the diameter of the black circle in the centre of the all-sky pictures (30°) corresponds to 55 km at an altitude of 110 km. This is another piece of evidence for the close relationship between luminosity and conductivity in the HD.
Well-developed HDs occur generally during the growth phase of a substorm. The subsequent expansion phase will be discussed in the next section.
4.2 Westward travelling surge
Westward travelling surges (WTS) have been studied for many decades. The reason why we include them here is that there are only a few examples of EISCAT measurements of a WTS in the literature.
The most convincing way to identify a WTS are auroral images. In Fig. 7 we see the rapid passage of an auroral bulge over KEV between 1710 and 1712 UT forming poleward of the pre-existing stable arc which we associated with the Harang discontinuity.
In the magnetic recordings WTSs exhibit positive de¯ections at all latitudes in the Y component whereas X shows negative de¯ections in the north and positive south of the surge head (see Fig. 3). A fast phase propagation particularly evident in the Y component implies a westward travel speed of the order of 10 km/s for this event. The equivalent currents in the surge head are predominantly southward-oriented with eastward components in the south and westward in the north (see Fig. 5). This signature is very much the same as that reported by Opgenoorth et al. (1983).
Of particular interest for the study of this feature are the EISCAT measurements. Figure 9 shows a dramatic increase of the Hall conductance in the beam positions
P2 and P3 after the passage of the WTS. The peak value
RH50 S is observed at P3, the latitude of the
pre-existing Harang discontinuity. Only one beam position south of the maximum (40 km), at P4, there is no sign of any conductivity enhancement. These observations are fully compatible with EISCAT measurements of Kirkwoodet al. (1988) who found the maximum of the Hall conductance (up to 75 S) close to the southern edge of the surge. Conductivity gradients are very steep at the southern edge. Towards the north the conductivity slopes o more gradually (see Fig. 9). It should be stressed here that the WTS expended only poleward of the HD.
The plasma velocity is very low in the vicinity of the WTS (Fig. 10). At the latitude of the conductivity maximum we ®nd velocities of only 80 m/s correspond-ing to electric ®elds of E = 4 mV/m. This again ®ts the value of E = 5 mV/m reported by Kirkwood et al. (1988).
In an analytical model Amm (1955) combined all the observations of Kirkwoodet al. (1988) and found a good agreement with their conclusions. One aspect of the Amm model, that we cannot con®rm, is the conductivity ratio RH=RP which he varied from 3.5 at the
conduc-tance peak to 1 in the unperturbed background. Our observations reveal ratios around 1.5 at all beam posi-tions. A conductivity ratio of 3.5 would require an extremely high energy for the precipitating electrons which is not in accordance with reported observations. In all other points our measurements are in good agreement with the Amm (1995) model.
4.3 Auroral streamers
The auroral forms elongated in north-south direction, showing up overhead Kevo at 1715 and 1731 UT (see Fig. 7) are of special interest for this study. Both the auroral images and the magnetic recordings con®rm that the features moved westward at a speed of 1.5 km/s. Similar features, also following a WTS, have earlier been observed by Oguti (1981) and Nakamura et al. (1993). These authors also report a westward motion but do not give the speed values Elphinstone et al. (1996) termed these westward propagating north-south aligned forms occurring in association with a double-oval con®gura-tion `auroral streamers'.
Important observations for the interpretations of the auroral forms are provided by the EISCAT measure-ments. From the magnetic ®eld data it was already suggested that the auroral patches were associated with upward FAC ®laments. This suggestion could be con®rmed by EISCAT conductance estimates. During both auroral events theRH=RP ratio increased, implying
that the spectrum of precipitating electrons became harder (Robinson et al., 1987) which is in favour with the formation of auroras. The stronger second event (1730 UT) was also associated with a signi®cant increase in conductance (see Fig. 9).
magnetic ®eld data and from the auroral images. Looking at the EISCAT measurements, we ®nd that the signatures in the conductances coincide with the auroral observation, if propagation delays from KEV/ KIL to the EISCAT site are taken into account. All this provides further evidence that the equivalent currents cannot simply be interpreted as Hall currents in this kind of phenomena. Rather than using Eq. (3) a more rigorous treatment of the ionospheric electrodynamics is required to describe the relations of the various plasma parameters. According to Fukushima's (1976) theorem only divergence-free ionospheric currents contribute in an area of vertically incident ®eld-aligned currents to magnetic ®eld variations on the ground. At the auroral latitudes with inclinations around 80° this condition is suciently well ful®lled. The source-free part of the ionospheric current which is re¯ected by the equivalent currents can be expressed as (e.g. Glaûmeier, 1987)
curlJzRH divEÿ Egrad RPzE gradRH
4
here the subscriptzdenotes the vertical component of the vector operator. All relevant quantities in Eq. (4) have been measured or can be derived. A full solution of this dierential equation will be the subject of a later paper.
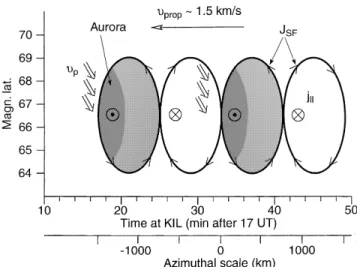
We have obtained measurements from magnetome-ters, all-sky cameras, and radars. Combining all these observations we are going to produce a picture of the auroral streamers that is as detailed as possible. In cases of moving structures, propagation delays have to be considered, if measurements from dierent sites are compared. The structure of the current features emerg-ing from all our measurements is sketched in Fig. 11. All the observations have been related to a time that is valid along a meridian through the station KIL.
Basic elements of our interpretation are two pairs of anti-parallel FAC ®laments. The centres of the upward directed FACs have liberally been collocated with the auroral streamers forms. These auroras appear at the westward (leading) edge of the regions of enhanced conductivity. The conductive patches are signi®cantly larger than the auroral forms. The cause of this could be a time-of-light eect of the precipitating particles. Since the source region is moving, the fastest (highest energy) electrons will reach the ionosphere ®rst and generate auroras at the leading edge. The low energetic tail arriving later and forming the trailing part is probably not energetic enough to excite auroras, but still enhances conductivity.
The equivalent current vortices do not surround the FAC ®laments concentrically. Peak current densities are found to be rather well collocated with the boundary between high and low conductivity regions. In Fig. 11 the time scale has been converted into a spatial scale taking into account the propagation velocity. Compar-ing the dimensions in azimuthal and latitudinal direc-tions reveals that the current vortices have a fairly circular shape.
Rather peculiar results emerge from the plasma ¯ow measurements. As can be deduced from Fig. 10, the
¯ows are generally south-eastward which is consistent with a position on the night-side of the dawn convection cell. The in¯uence of the auroral patches on the ionospheric plasma ¯ow is mainly a reduction of the velocity in high conductivity regions but only little change in direction is observed. High ¯ow velocities (700 m/s) were measured just in front of the steep conductivity gradients at the leading edges of the patches. It was expected, at least in the ®rst case that equivalent currents and ¯ow velocities point in opposite directions. What we ®nd, in particular in regions where the ¯ow speed peaks, is an almost parallel orientation, even if we take the mentioned uncertainty of some 30% in the east/west component of the ¯ow velocities from the northernmost position VP1 into account.
An explanation for this apparent con¯ict could be that the background ¯ows are so large compared to those associated with the vortices that the former are only insigni®cantly modi®ed by the latter. An order-of-magnitude estimate reveals for the expected changes in ¯ow velocity
vJ= RB 400 m/s 5
if we insert such typical values, as J = 0.2 A/m,
R10 S and B = 50 000 nT, the resulting velocity cannot be regarded as small compared to the observed velocities. Other explanations, thus, have to be found.
The question arises: are our auroral streamers coun-terparts of W-bands? The former appear to the west of the substorm current wedge and propagate westward while the latter form to the east and travel eastward. Both these auroral features have some characteristics in common. They form and move along the central latitude of a pre-existing electrojet. The scale size of both phenomena is of the order of 500 km and their velocity ranges around 1 km/s. There are also signi®cant dier-ences. While W-bands are associated with ¯ux tubes
which are anchored in the ionosphere and move with the background plasma (LuÈhr and Schlegel, 1994), the Fig. 11.Synoptic sketch of the electrodynamics associated with the westward moving auroral streamers. The azimuthal scale has been derived from the propagation speed of the auroral forms. For more details see Sect. 4.3
features studied here show motions clearly dierent from the ionospheric plasma ¯ow. Also the ionospheric plasma dynamics accompanying the two phenomena is quite dierent (Buchertet al., 1990). We tend to believe that the westward moving auroral streamers and theW -bands are caused by quite dierent processes in the magnetosphere.
5 Discussion
In this section we discuss our observations in the larger context of magnetospheric processes. Westward moving transient features, besides WTS, can be observed rather frequently in association with pre-midnight substorms. For this reason we ®rst present the characteristic of the substorm studied here.
5.1 Substorm features
The substorm commencing at 1710 UT (20 MLT) exhibits a number of features typical of evening-side substorms. The onset occurred at a fairly low latitude (66° magnetic latitude). The associated westward electrojet moved poleward at an average speed of 1.2 km/s (see Fig. 4). The poleward propagation seems to go in bursts rather than be continuous. After about 12 min the electrojet had reached its northernmost position at 75°magnetic latitude and decayed thereafter rather rapidly.
By the time the initial jet had reached its northern-most position a new westward electrojet formed at lower latitudes (67°magnetic latitude). This later jet did not
move much but persisted for some 30 min. It is with this jet that the westward moving auroral features were associated.
This kind of electrojet splitting can be observed quite frequently during evening-side substorms, and we may speculate that these two jets, going through rather dierent developments, are driven by two dierent processes in the magnetospheric tail. Several recent studies have been related to this phenomenon (e.g. Kotikovet al., 1995; Elphinstoneet al., 1996).
The second electrojet starting some 10 min later may be driven by Earthward directed bursty bulge ¯ows. Shiokawa et al. (1997b) have outlined the scenario for such a generation process which could also account for vortical ¯ow patterns that might be responsible for the drifting auroral features.
5.2 Transient features
According to our data of the 11 October 1933 event, a WTS developed moving at about 10 km/s. Behind the surge in the ``wake'' large-scale FAC ®laments are seen. In front of the surge there is a relatively narrow band of enhanced conductivity. The width is about 40 km. Inside the band RH and RP reach about 15 S, outside
of the band their values are below 4 S. The band is
probably the westward continuation of the stable arc seen in the all-sky camera records.
In the head of the surge the conductivities rise to about 50 and 36 S for Hall and Pedersen, respectively. In the wake Pedersen conductivities vary between 7 and 15 S, Hall between 8 and 28 S, their maxima are around the centres of the upward currents. Relatively high conductivities are observed even at the most northern EISCAT antenna positions but not south of the head.
The electric ®eld is strongest behind the surge head. It increases from a value below 5 mV/m inside to about 50 mV/m pointing towards south-west. Then both the east-west and the north-south components seem to be modulated by the sequence of up and downward FAC ®laments. In front of the surge most ¯ow vectors are eastward. Both the surge and the slower FAC ®laments move against the average plasma ¯ow in the current wedge.
Our clear observation of a southwestward electric ®eld behind the surge stands out somewhat when compared with other experimental works. Horwitz
et al. (1978) derived a north-westward electric ®eld from measurements with a monostatic incoherent scatter radar in a comparable situation. Coherent radars did not return echoes within an elongated area behind surges (Inhester et al., 1981; Opgenoorth et al., 1983). The authors concluded that the ®eld strength was below a threshold of 15 mV/m. The ®eld seen in this event is above such a threshold. The radars did indicate a southward ®eld beyond the poleward edge of the surge wake.
Some phenomenological models, for example Bos-troÈm's (1964) type I, postulate a mainly westward ®eld behind the head of the current wedge as part of the magnetosphere-ionosphere current circuit, while in his type II current system it is southward. In a model for substorms by Haerendel (1992) the energy which is transported by the current systems into the ionosphere and atmosphere comes from the braking of Earthward ¯owing plasma in the plasma sheet. In a recent study Shiokawa et al. (1997a) have provided experimental evidence for this concept by examining AMPTE/IRM data. Using our measured value of the Pedersen conductance and electric ®eld, the height-integrated current behind the surge is estimated to about 0.4 A/m. Most of this current seems to continue as upward FAC above the surge head. It ¯ows over about 2 degrees in latitude. Then the total current amounts to roughly 80 kA, quite in accordance with Haerendel's (1992) estimate from plasma sheet parameters. Due to partial current closure in the acceleration region, to be discus-sed in the next paragraph the generator is probably stronger than inferred from the ground-based observa-tions.
by Robinsonet al. (1987) gives, for the observed highest ratioRH=RP 2, an energy of about 5 keV. Most of the
proposed acceleration mechanisms involve the mainte-nance of parallel electric ®elds accompanied by dissipa-tion at an altitude of roughly 1 Re concentrated in the areas of upward FAC. Such processes would consider-ably reduce the convergent perpendicular electric ®eld below the acceleration region compared to the one above it, in other words, the magnetospheric ¯ow becomes partially decoupled from the ionospheric one.
Mapping along dipolar ®eld lines, Nakamura et al. (1993) derived qualitatively the ¯ow in the equatorial plane for another event which was quiet similar to the one presented here (their Fig. 11d). The FAC structures in the wake of our surge on 11 October 1993 are more circular in shape than the north-south aligned aurora seen by Nakamuraet al. (1993), but nevertheless might be the same type of phenomenon. In the presence of ®eld-aligned potentials which are implied by our con-ductivity measurements such a derived ¯ow pattern would need to be considerably modi®ed. It is beyond the scope of this study to speculate in what way.
Adding another complication to ionosphere-magne-tosphere coupling, we point out that self-induction of ionospheric current vortices becomes signi®cant at the spatial scales and temporal rates resolved by our data. Currents closing within the ionosphere, i.e. current vortices, which are to a ®rst approximation Hall currents, have a corresponding magnetic ®eld perturba-tion in thezdirection. Changes ofBzin time imply, by Faraday's law, a rotational electric ®eld. Such a ®eld would be observed by ground-based radars. However, having only the single point measurement of EISCAT, a distinction between rotational and convergent/divergent components of the ®eld is not possible for this event. Figure 12 depicts schematically a simple scenario of such a self-induction. An increasing, purely westward, magnetospheric ®eld would drive a growing northward Hall current. Using Lenz's law, the induction ®eld is then southward, the total electric ®eld rotated counter-clockwise when viewed from above. The most rapid increase of the electric ®eld is, as already mentioned, observed directly after the passage of the surge. With the preceding arguments part of the measured ®eld might
then be due to the induction eect and the magneto-spheric electric ®eld more westward than southward. An order of magnitude estimate is obtained using
Eindl0L2=T rHEml0vLrHEm 6
where LandTare typical length and time scales of the variations of the magnetospheric ®eld Em. Inserting
v= 12 km/s for the travel speed of the surge, L200 km, and rH 510ÿ4 S/m, an electric ®eld
Eind1:5Em is obtained. Note, the self-induced ®eld
at the E region is of the same order as the convection ®eld. This rotational ®eld decreases exponentially with distance from the ionosphere with a scale L, since it continues in the magnetosphere as a fast mode which is evanescent (Hughes, 1983). The ®eld vector measure-ments were made at a height about 170 km, above the maximum of the Hall conductivity. This is within a typical horizontal scale size, and therefore the observed ®eld probably still has a considerable rotational com-ponent. This component also drives a divergent Hall current which must close transiently in the magneto-sphere. The eects of @B=@t60 are discussed in more detail by Buchert and Budnik (1997).
In summary, we have presented the observation of a westward travelling surge followed by large-scale FAC ®laments with a very complete set of ground-based instruments. Tentatively, the FAC ®laments, although more circular in shape, are associated with the north-south aurora observed by Nakamura et al. (1993) in another event, and we propose that they are a usual phenomenon behind surges. In this event, there is clear evidence of a strong electric ®eld after the passage of the surge still in the region of relatively high conductivities. Such a ®eld is postulated by models for magnetosphere/ ionosphere current systems in substorms. The increase of the conductivities and of the ratio of Hall to Pedersen conductivities suggest the presence of parallel electric ®elds in particular above the surge, but also above the FAC ®laments. We point out that although the existence of such ®eld-aligned potential drops has been suggested since decades and is more or less con®rmed by in-situ measurements, models and theory provide still relatively little guidance for the mapping of our ionospheric measurements into the magnetosphere. Finally we mention that at the observed dynamic scales the eects of self-induction in time-varying ionospheric currents become signi®cant and need to be studied in more detail.
Acknowledgements. The IMAGE magnetometer network is a cooperative eort of nine institutions from six European countries. We are very much obliged to the many people who make the IMAGE project a success by their continuous support: A. Viljanen (PI), L. HaÈkkinen, H. Nevanlinna and R. Pellinen (Finnish Meteorological Institute), J. Kultima and P. Vilkki (SodankylaÈ Geophysical Observatory), T.L. Hansen (University of Tromsù), A. Grafe and H.J. Linthe (GeoForschungsZentrum Potsdam), S.-E. Hjelt (University of Oulu), W. Glegolski and J. Reda (Polish Academy of Sciences) and K.-H. Glaûmeier and C. Willecke (Technical University of Braunschweig). The EISCAT Scienti®c Association is supported by the Max-Planck-Gesellschaft (Germa-ny), Centre National de la Recherche Scienti®que (France), Science and Engineering Research Council (UK), Norges Al-Fig. 12. Schematic explanation of self-induction in the ionosphere
behind the surge. When the westward convection ®eld,EMagincreases
in time, it drives a Hall currentjHwhich also increases in time. The
induced ®eldEIndopposes this change, according to Lenz's law, and is
southward. Then the total, observed electric ®eld,EObs, is rotated
towards south and larger than the original ®eldEMag
menvitenskapelige Forskningsrad (Norway), Naturvetenskapliga Forskingsradet (Sweden), and the Suomen Akatemia (Finland).
Topical Editor D. Alcayde thanks C. Senior and another referee for their help in evaluating this paper.
References
Akasofu, S.-I., D. S. Kimball, and C.-I. Meng,The dynamics of the aurora, 2. Westward traveling surges,J.Atmos.Terr.Phys.,27, 173±187, 1965.
Amm, O.,Direct determination of local Hall conductance distri-bution from two-dimensional electric and magnetic ®eld data: application of the method using models of typical ionospheric electrodynamic situations,J.Geophys.Res.,100,21473±21488, 1995.
Baker, K. B., and S. Wing,A new magnetic coordinate system for conjugate studies at high latitudes,J.Geophys.Res.,94,9139± 9143, 1989.
Birkeland, K., The Norwegian Aurora-Polaris expedition 1902± 1903, Christiana1,1908.
BostroÈm, R.,A model of the auroral electrojets,J.Geophys.Res., 69,4983±4999, 1964.
Buchert, S. C, and F. Budnik, Field-aligned current distributions generated by a divergent Hall current,Geophys.Res.Lett.,24, 297±300, 1997.
Buchert, S., G. Haerendel, and W. Baumjohann, A model for the electric ®elds and currents during a strong Ps6 pulsation event, J.Geophys.Res.,95,3733±3743, 1990.
Chapman, S.,The electric current-system of magnetic storms,Terr. Magn.Atmos.Electr.,40,349±370, 1935.
Elphinstone, R. D., J. S. Murphree, and L. L. Cogger,What is a global auroral substorm?,Rev.Geophys.,34,169±232, 1996. Friis-Christensen, E., M. A. McHenry, C. R. Clauer, and S.
Vennerstrùm, Ionospheric travelling convection vortices ob-served near the polar cleft: a triggered response to sudden changes in the solar wind, Geophys. Res. Lett., 15, 253±256, 1988.
Fukushima, N., Ground magnetic eect of ®eld-aligned currents connected with ionospheric currents, Rep. UT-GRL-76-01, University of Tokyo, Tokyo, 1976.
Glaûmeier, K.-H., Ground-based observations of ®eld-aligned currents in the auroral zone: methods and results, Ann. Geophysical,5,115±125, 1987.
Glaûmeier, K.-H., M. HoÈnisch, and J. Untiedt,Ground-based and satellite observations of traveling magnetospheric convection twin-vortices,J.Geophys.Res.,94,2520±2528, 1989.
Haerendel, G.,Disruption, ballooning or auroral avalanche-on the cause of substorms, inSubstorms 1, pp 417±420, ESA SP-335, 1992.
Horwitz, J. L., J. R. Doupnik, and P. M. Banks,Chatanika radar observations of the latitudinal distributions of auroral zone electric ®elds, conductivities, and currents,J.Geophys.Res.,83, 1463±1481, 1978.
Hughes, W. J., Hydromagnetic waves in the magnetosphere, in Solar-Terrestrial Physics, Eds. R. L. Carovillano and J. M. Forbes, pp. 453±477, Reidel, 1983.
Inhester, B., W. Baumjohann, R. A. Greenwald, and E. Nielsen, Joint two-dimensional observations of ground magnetic and ionospheric electric ®elds associated with auroral zone currents, 3. Auroral zone currents during the passage of a westward traveling surge,J.Geophys.,49,155±162, 1981.
Inhester, B., J. Untiedt, M. Segatz, and M. KuÈrschner, Direct determination of the local ionospheric Hall conductance distri-bution from two-dimensional electric and magnetic ®eld data, J.Geophys.Res.,97,4073±4083, 1992.
Kirkwood, S., H. J. Opgenoorth, and J. S. Murphree,Ionospheric conductivities, electric ®elds and currents associated with auroral substorms measured by the EISCAT radar, Plant. Space.Sci.,36,1359±1380, 1988.
Koskinen, H. E. J., and T. I. Pulkkinen,Midnight velocity shear zone and the concept of Harang discontinuity,J.Geophys.Res., 100,9539±9547, 1995.
Kotikov, A. L., E. M. Shishkina, O. A. Troshichev, and T.I. Sergienko,Double structure of ionospheric conductivity in the midnight auroral oval during a substorm,J.Atmos.Terr.Phys., 57,177±186, 1995.
LuÈhr, H.,The IMAGE magnetometer network, inSTEP Interna-tional,4,USSCO, Oct., 1994.
LuÈhr, H., and K. Schlegel,Combined measurements of EISCAT and EISCAT magnetometer cross to studyWbands,J.Geophys.
Res.,99,8951±8959, 1994.
LuÈhr, H., S. ThuÈrey, and N. KloÈcker,The EISCAT-Magnetometer Cross: operational aspects, ®rst results,Geophys.Surv.,6,305± 315, 1984.
Nakamura, R., T. Oguti, T. Yamamoto, and S. Kokubun, Equator-ward and poleEquator-ward expansion of the aurora during auroral substorms,J.Geophys.Res.,98,5743±5759, 1993.
Oguti, T.,TV observations of auroral arcs, inPhysics of Auroral Arc Formation, eds. S.-I. Akasofu and J. R. Kann, AGU Geophys. Mongr. 25, 31±41, Washington, 1981.
Opgenoorth, H. J., R. J. Pellinen, W. Baumjohann, E. Nielsen, G. Marklund, and L. Eliasson,Three-dimensional current ¯ow and particle precipitation in a westward travelling surge (observed during the Barium-GEOS rocket experiment),J.Geophys.Res., 88,3138±3152, 1983.
Robinson, R. M., R. R. Vondrak, K. Miller, T. Dabbs, and D. Hardy,On calculating ionospheric conductances from the ¯ux and energy of precipitating electrons, J. Geophys. Res., 92, 2565±2569, 1987.
Shiokawa, K., W. Baumjohann, and G. Haerendel, Breaking of high-speed ¯ows in the near-Earth tail,Geophys.Res.Lett.,24, 1179±1182, 1997a.
Shiokawa, K., W. Baumjohann, G. Haerendel, J. F. Fennell, E. Friis-Christensen, H. LuÈhr, T. Nagai, G. Paschmann, G. D. Reeves, C. T. Russell, P. R. Sutclie and K. Takahashi,Relations of high-speed ion ¯ow, substorm current wedge, and multiple Pi2 pulsations during a substorm on March 1, 1985,J. Geophys. Res., (accepted), 1997b.