i UNIVERSIDADE FEDERAL DO RIO GRANDE DO NORTE
PROGRAMA DE PÓS-GRADUAÇÃO EM ECOLOGIA
FELIPE PEREIRA MARINHO
USO DO SOLO EM AMBIENTES SEMIÁRIDOS:
EFEITOS SOBRE A ESTRUTURA DA VEGETAÇÃO E INTERAÇÃO
ENTRE PLANTAS EM UMA FLORESTA TROPICAL SECA
i FELIPE PEREIRA MARINHO
USO DO SOLO EM AMBIENTES SEMIÁRIDOS:
EFEITOS SOBRE A ESTRUTURA DA VEGETAÇÃO E INTERAÇÃO
ENTRE PLANTAS EM UMA FLORESTA TROPICAL SECA
Dissertação apresentada ao programa de Pós-Graduação em Ecologia da Universidade Federal do Rio Grande do Norte, como parte das exigências para a obtenção do título de Mestre em Ecologia.
Orientador: Dra. Gislene Maria da Silva Ganade
ii Catalogação da Publicação na Fonte. UFRN / Biblioteca Setorial do Centro de Biociências
Marinho, Felipe Pereira.
Uso do solo em ambientes semiáridos: efeitos sobre a estrutura da vegetação e interação entre plantas em uma floresta tropical seca / Felipe Pereira Marinho. – Natal, RN, 2015.
60 f.: il.
Orientadora: Profa. Dra. Gislene Maria da Silva Ganade.
Dissertação (Mestrado) – Universidade Federal do Rio Grande do Norte. Centro de Biociências. Programa de Pós-Graduação em Ecologia.
1. Uso de solo. – Dissertação. 2. Pastejo. – Dissertação. 3. Caatinga. – Dissertação. I. Ganade, Gislene Maria da Silva. II. Universidade Federal do Rio Grande do Norte. III. Título.
3 FELIPE PEREIRA MARINHO
USO DO SOLO EM AMBIENTES SEMI-ÁRIDOS:
EFEITOS SOBRE A ESTRUTURA DA VEGETAÇÃO E INTERAÇÃO
ENTRE PLANTAS EM UMA FLORESTA TROPICAL SECA
Dissertação apresentada ao programa de Pós-Graduação em Ecologia da Universidade Federal do Rio Grande do Norte, como parte das exigências para a obtenção do título de Mestre em Ecologia.
Data da defesa: 27 de fevereiro de 2015
Resultado: ____________________
_______________________ _____________________ Dr. Alexandre Fadigas de Souza Dr. José Alves de Siqueira Filho
__________________________ Dra. Gislene Maria da Silva Ganade
4
AGRADECIMENTOS
Se tratando de estudos ecológicos que envolvem experimentos em campo é impossível não agradecer a dezenas de pessoas que se envolveram ao longo desses dois anos. Inicialmente quero agradecer de uma forma especial a minha orientadora Gislene Ganade, que desde a graduação vem orientando minha vida acadêmica e facilitando questões conceituais e logísticas do trabalho.
Ao Guiga e a Dri pelo apoio dado principalmente no trabalho desenvolvido em Diogo Lopes, através de vocês (quando eu ainda era um aluno de IC) desenvolvi as perguntas pra esse mestrado (acho que até para o doutorado). Guardo ótimas recordações daqueles campos!
Minha gratidão ao professor Wolfgang W. Weisser pela revisão e importantes sugestões dadas ao trabalho.
A todo grupo do laboratório de Ecologia da Restauração: Léo, Adler, Edjane, Jeanne, Bruna, Tida, Marina, Gustavo, Fê, Raquel e todos os demais estagiários. Minha gratidão pela força na montagem e monitoramento do experimento realizado em Assú.
Agradecimento especial a alguns amigos por me oferecerem ótimos momentos ao longo desses dois anos. Alguns de longa data e outros que conheci já na pós-graduação: Alan, Paulo, Damião, Daniel, Nati, Vanessa, Ananda e tantos outros que não iria caber nessa página.
Ao Mauro, Seu Zé Holanda, Chiquinho, Seu Luís, Irmão e todos os funcionários da Flona de Açu, meus sinceros agradecimentos pelo apoio logístico dado a este trabalho. A D. Ivete por disponibilizar sua propriedade para realização do experimento do segundo capítulo, pelos deliciosos lanches e lindo exemplo de dedicação e amor pela natureza.
5
SUMÁRIO
Sumário
APRESENTAÇÃO ... 6
RESUMO...6
CAPÍTULO I - EFFECTS OF PAST AND PRESENT LAND USE ON VEGETATION COVER AND REGENERATION IN A TROPICAL DRYLAND FOREST ... 8
Abstract ... 10
Introduction ... 11
Materials and methods ... 13
Results ... 19
Discussion ... 26
Conclusion... 29
References ... 30
Supporting information ... 35
CAPITULO II - GRAZING AFFECTING INTERACTIONS AMONG PLANTS IN A BRAZILIAN SEMIARID FOREST ... 38
Abstract ... 39
Introduction ... 40
Materials and methods ... 43
Results ... 47
Discussion ... 52
Conclusion... 55
References ... 55
6 APRESENTAÇÃO
A presente dissertação é composta por dois capítulos acerca dos efeitos do uso do solo sobre a comunidade vegetal da Caatinga. O primeiro analisa como diferentes atividades desenvolvidas pelo homem e suas interações afetam a estrutura da vegetação da Caatinga. A coleta de dados foi realizada na Reserva de Desenvolvimento Sustentável Estadual Ponta do Tubarão, município de Macau, Rio Grande do Norte, entre os anos de 2012 e 2013.
Ao final da coleta de dados, com a realização das primeiras análises estatísticas ficou evidenciado a forte influência do pastejo sobre alguns parâmetros da vegetação como densidade e número de espécies, por exemplo. Esse fato fez com que houvesse o interesse na realização de um experimento para investigar o efeito do pastejo sobre as relações de facilitação e competição entre plantas, o que resultou no desenvolvimento do segundo capítulo desta dissertação. Devido a um maior apoio logístico o experimento foi realizado na Floresta Nacional de Açu, município de Assú. O experimento testou a interação entre uma espécie facilitadora e duas espécies-alvo sob a condição de ausência e presença da pressão de pecuária. Foi realizado entre os meses de abril e setembro de 2014.
7
RESUMO
Nessa dissertação foram abordados em dois capítulos o efeito de atividades antrópicas sobre a estrutura da vegetação e interação entre espécies vegetais em uma floresta tropical seca. No primeiro capítulo foram usadas informações de satélite para identificar 55 parcelas florestais da Caatinga com e sem passado corte-raso da vegetação no passado. Também foi quantificado o uso atual da terra, ou seja, pastejo por animais domésticos e extração seletiva de madeira. Estrutura de vegetação de Caatinga, medida como cobertura vegetal, altura da vegetação, área basal e densidade de plantas lenhosas, bem como o recrutamento e riqueza de espécies, foram negativamente afetados tanto pelo uso da terra no passado quanto pelo uso atual. Corte-raso não só teve fortes efeitos sobre a maioria das medidas de vegetação, mas também aumentou a pressão de pastejo o que potencializou a relação negativa entre o uso do solo e estrutura da vegetação. O corte seletivo teve poucos efeitos mensuráveis, mas aumentou o recrutamento em parcelas que sofreram corte-raso anteriormente. Nossos resultados sugerem que para permitir a sucessão em áreas degradadas, pastejo deve ser evitado, a fim de evitar uma maior degradação e desertificação. No segundo capítulo foi verificado efeitos do pastejo sobre interações entre plantas. Pecuária extensiva praticada nas florestas pode modificar a abundância de algumas espécies na comunidade pelo pastejo, alterando assim, a intensidade e a direção das interações entre plantas. Nesse estudo, foram verificados efeitos de pastejo sobre a interação entre Zizyphus joazeiro adulto e indivíduos jovens de Poincianella pyramidalis e Zizyphus joazeiro. Pastejo afetou principalmente de sobrevivência dos juvenis, aumentou a compactação do solo perto do Zizyphus joazeiro adulto e modificou a altura da cobertura herbácea. Ambientes semiáridos como a Caatinga com pressão do gado, podem ter alta mortalidade de plantas nas fases iniciais da vida. A resistência ao pisoteio e pastoreio pode definir a composição de espécies em longo prazo. Novos estudos podem testar como o pastejo modifica as interações entre plantas com novas combinações de espécies e diferentes características funcionais.
Palavras-chave: Uso do solo, pastejo, corte-raso, Caatinga, cobertura vegetal,
8
CAPÍTULO I
EFFECTS OF PAST AND PRESENT LAND USE ON
VEGETATION COVER AND REGENERATION IN A
9
Effects of past and present land use on vegetation cover and regeneration in a tropical dryland forest
Felipe Pereira Marinho a, Guilherme Gerhardt Mazzochini a,*, Adriana Pellegrini Manhães a, Wolfgang W. Weisser b, Gislene Ganade a
a
Department of Ecology, Centro de Biociências, Universidade Federal do Rio Grande do Norte, Lagoa Nova, Natal, RN, 59072970, Brazil
b
Terrestrial Ecology Research Group, Department of Ecology and Ecosystem Management, School of Life Sciences Weihenstephan, Technische Universität München, Hans-Carl-von-Carlowitz-Platz 2, 85350 Freising, Germany
*
Corresponding author. Email: gmazzochini@gmail.com
Keywords: Grazing, Clear-cut history, Vegetation cover, Land management,
10
Abstract
11
1. Introduction
Land use change is the main cause of land degradation worldwide, but the degree of degradation will depend on land use type and on the resilience of the impacted ecosystem (Gunderson, 2000; Htun et al., 2011). The use of native forests for livestock grazing or logging not only directly impacts the vegetation but also modifies environmental conditions such as the light reaching the soil, soil compaction and wind exposure (Coffin et al., 1996; Conant et al., 2001; Zaady et al., 2013). A common consequence of such land uses in many forests is an impoverished vegetation with a lower average tree height, tree basal area, plant density and species number. This might occur either due to the direct effects of land use and through the indirect effects of enhancement of stressful conditions (Dorrough and Scroggie, 2008).
12 In drylands around the world, intensive land-use leads to formation of isolated vegetation patches surrounded by bare ground (Kéfi et al., 2007; Maestre and Escudero, 2009). After land abandonment, secondary forest dynamics will drive the assembly of a new plant community (Foster, 1992). The regeneration of a highly impacted area will depend on the presence of seed sources, vegetation cover and soil quality after land use (Verheyen et al., 2003). If regeneration does not occur because of continuous land use pressure, bare soil continuous exposure can lead to increased vegetation degradation over time and initiate a process of land desertification (Kéfi et al., 2007; Maestre and Escudero, 2009). In drylands, desertification is often the consequence of poor land management (D'Odorico et al., 2013).
The Caatinga is a dryland region covering most of the Brazilian Northeast and is threatened by increasing land use intensity (Leal et al., 2005; Ribeiro et al., 2015). Caatinga vegetation is characterized by a mixture of woody and herbaceous plants, with dominance of xerophytic and deciduous forest species. A common type of land use at the Caatinga is livestock grazing where animals are usually raised freely to feed on native vegetation that grows during the rainy season. In some cases, some areas are clear-cut to stimulate the growth of herbaceous vegetation palatable to lifestock. Other areas are converted to agriculture. Continued timber removal together with grazing are, however, the main causes of degradation of the Caatinga vegetation (Leal et al., 2005). Caatinga covers an area of 826 411 km2, but around 375 116 km2 or 45.4% have been deforested until 2009 and desertification processes have been observed in up to 15% of the area (Leal et al., 2005; MMA, 2011).
13 the different drivers of the changes on Caatinga's vegetation structure and regeneration in more mechanistic detail can help elucidating better management actions to avoid desertification and achieve conservation goals.
This study aims to investigate the effects of past and present land use on woody plant community regeneration, cover and structure. We asked the following questions: (1) how does a past clear-cut affect current vegetation structure? (2) does increasing land-use intensity, in particular increasing intensity of grazing and selective logging, lead to increasing negative effects on plant community regeneration, vegetation cover and structure? and, (3) are there interactions between past and current land uses in their effect on the vegetation?
2. Material and methods
2.1. Study area
The study was carried out in the State's Sustainable Development Reserve (SDR)
Ponta do Tubarão (category VI of IUCN) located at the Brazilian northeast region,
inside the boundaries of the Caatinga. In these types of reserves local people are allowed to live and exploit resources in a sustainable way. Yearly mean rainfall in the Caatinga is very variable and ranges from 240 to 1500 mm per year. Inside the reserve, average rainfall is 508 mm.year-1 and rain mostly falls between January and May while on average less than 20 mm falls between October and December (data available at http://www.inmet.gov.br). The SDR has an extent of 12,960 hectares that encompasses three main vegetation types: i) a Caatinga vegetation with a closed canopy cover of ~ 4 meter height, dominated by the woody species Mimosa tenuiflora, Poincianella
pyramidalis, Pytirocarpa moliniformis and Croton sonderianus; ii) a restinga
14
obtusifolium, and open spaces dominated by the small stature herbaceous species, and
iii) a mangrove located near the coastline dominated by Rhizophora mangle. The Caatinga part of the reserve, where we carried out our study, covers 2,779 hectares, i.e. 21% of the total reserve area. There are also some dune areas inside the Caatinga which were also excluded from our study, so that that study areas included 2.010 hectares of Caatinga vegetation.
There are eight traditional settlements inside the reserve boundaries with a population of ~5,000 people. Family income in the three settlements at the coastline traditionally derives from fishing and from wood extraction from Caatinga vegetation, to build houses fences and boats. In the five countryside settlements, families live on small scale subsistence agriculture including raising sheep, goat and cattle, and also use wood from the Caatinga vegetation for house and fence building, and for charcoal production. Families let their animals, that also include donkeys and horses, forage freely in the vegetation. Sometimes small forest areas are cleared from trees by burning to encourage herbaceous vegetation growth.
2.2. Selection of sampling plots
15 trees and shrubs and a tree height of at maximum 2m, and closed areas with a closed forest canopy and tall trees with a mean canopy height of about 3-4 meters. The 28 control areas were classified as one of the three types and used to train a classification algorithm based on Maximum Likelihood (ML) using all five Landsat bands (supervised classification procedure in ArcGis v10 ESRI, 2011). After training, the entire reserve was classified into the three cover classes.
In a second step, we randomly selected 55 sampling points in the Caatinga part of the SDM, 20 in closed, 20 in intermediate, and 15 in open areas, as only 17% of the area had no forest cover. As a constraint for plot selection we set a minimum distance of 100 meters between points. After selection, the minimum distance between two adjacent sampling points was 142 m (mean 3207 ± 2444 (sd) m). Each selected sampling point then served as the center of a circular sampling plot with 25 meters radius (1962 m²). This circle was used to measure current land use. Assessment of vegetation structure and plant species richness variables was carried out in a square 10 x 10m sub-plot (100 m²) in the center of the circular plot.
2.3. Land use assessment
16 present in each pixel of target landscape (Keshava and Mustard, 2002). For each plot, the development of the fraction of bare soil (between 0 and 1) was analyzed over time. Whenever there was a sudden increase in the fraction of bare ground from one year to another, the plot was considered to have been burned. From the 55 plots, 21 were classified as clear-cut in the past at least once in previous 26 years. This satellite image classification was then verified in the subsequent field visits for vegetation assessments (see below) when we searched for evidence of past forest burning, e.g. charcoal or burned logs on the ground, and by asking local people for information. Two of the 21 plots turned out not to have been burned but were rather affected by selective logging, and were re-classified as without clear-cut. Of the remaining 19, one of the plots was cut clear using chainsaws in the past, the rest were burned. We also used the time since
last clear-cut as an additional variable for analysis.
All plots were visited between February and June in 2012 and 2013. As a measure of current grazing intensity, the number of dung pellets from goats, cattle (bovine) and horses/donkeys (equine) were counted inside the circular plots. As a measure of selective logging intensity we counted the number of cut trees or cut branches found inside the circular plots and measured their diameter to calculate the total basal area of selective logging (m2.ha-1).
2.4. Vegetation cover assessment by satellite
17
2.5. Assessment of vegetation structure, richness and density of seedlings
In the 10x10m sub-plots inside each plot, we identified all woody species (shrubs and trees) higher than 20 cm height (for a list of species see Supplementary material, Table A.1). For each individual we measured height and diameter at ground level. We calculated the basal area for each woody plant individually. We defined woody plants with less than 50cm height and less than 1 cm diameter as seedlings. For analysis, we counted the number of seedling species (seedling species richness) and the
number of seedlings (seedling density) found in each sub-plot.
We also counted the number of points where vegetation was present in a total of 25 grid points in a grid with 2m distance inside the 10 x 10 meters sub-plot. At each point, we also measured vegetation height as the maximum height of a woody plant at the point.
We also calculated the following measures for current vegetation structure: a)
total basal area (m2.ha-1), based on all woody plants, including seedlings, b) average
basal area per plant, c) average vegetation height (m) based on the grid measurements,
and d) woody plant density (without seedlings, ha-1).
Because the grid measure of vegetation cover correlated well with the satellite estimate of vegetation cover described above (N = 55, r = 0.82, p < 0.001) we only use the vegetation cover estimates from the satellite images in the analysis.
2.6. Statistical analyses
18 seedling density; (ii) seedling species richness, (iii) vegetation cover, (iv) total basal area, (v) average vegetation height and (vi) plant density. We fitted all combinations of land use variables for each response variable, including the second and third order interactions among them, totaling 19 models for each dependent variable. The order of fitting was cut, grazing and selective logging, cut*grazing, clear-cut*selective logging, grazing*selective logging, clear-cut*grazing*selective logging. The simplest model thus estimated only an intercept, and the full model estimated eight parameters. The model with lowest Bayesian information criterion (BIC) values was selected as the best model since BIC is an increasing function of the residual variance and number of parameters. We used BIC instead of the commonly used Akaike information criterion because BIC penalizes more for model complexity. We calculated
ΔBIC as the difference of BIC values of each model with the minimum BIC value (best
19
3. Results
3.1. Interactions among past and current land use
3.1.1. Clear-cut and grazing
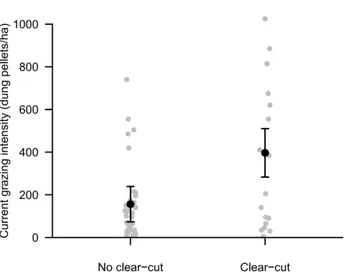
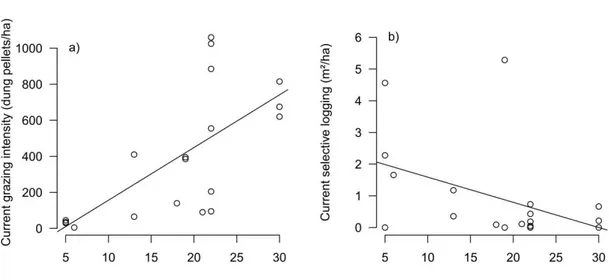
All plots presented evidence of grazing. Pellet number was 397 ± 360 in plots with past-clear cut, more than twice as many as in plots with no clear cut (156 ± 173, F1,53 = 4.99, p = 0.03, Fig. 1, see also Appendix A, Table A.2). On average, an approximately equal number of pellets were counted from goats, donkey/horse and cattle, but in plots with past clear-cut there were most pellets from donkey/horses, while in plots without clear-cut most pellets were from goats (Table A.2). Past clear-cut did, however, only explain 8% of the variability in grazing intensity. While in both previously clear-cut and not clear-cut areas there were many plots with little or intermediate grazing intensity, there were relatively more plots with high grazing intensity, and with higher values of grazing intensity in the previously clear-cut plots (Fig. 1). Thus, past clear-cut was associated with higher current grazing intensity. Interestingly, grazing intensity was positively correlated with time since the last clear-cut (N = 19, r = 0.67, p = 0.002, Fig. A.1a).
20
3.1.2. Clear-cut and selective logging
Forty-seven plots (85% of total plots) showed evidence of logging. The basal area logged ranged from 0 to 10.2 m² per hectare. Percentage extraction (basal area logged/total basal area) ranged from 0 to 32%, average ca. 5 ± 6%. In plots that were previously clear-cut selective logging was 0.93 ± 0.4 m²/ha, not significantly different from the 1.3 ± 0.3 m²/ha in areas without previous clear-cut (F1,53 = 0.52, p = 0.46). There was also no difference in the number of stems/branches cut (clear-cut: 32 ± 50, no clear-cut 64 ± 126, F1,53 = 1.15, p = 0.29). The number of stems/branches cut was correlated with selective logging intensity, i.e. the total basal area extracted (N = 55, r = 0.82, p < 0.001). The intensity of current selective logging tended to decrease with increasing time since the last clear-cut, but the relationship was marginally not significant (N = 19, r = -0.43, p = 0.068, Fig. A.1b).
3.1.3. Grazing vs. selective logging
21 Table 1. Results of linear models (GLM) on the effect of past (clear-cut) and current (grazing, selective logging) land use on variables related to regeneration
and vegetation structure in 55 Caatinga plots. Only models with ΔBIC lower than 2 are presented. C x G represents the interaction between past clear-cut and
current grazing and C x L represents the interaction between past clear-cut and selective logging. When a interaction is presented in the model, values inside
interaction cells are slopes of the effect of grazing or logging when plots where clear-cut. The three-way interaction C X G X L was never significant for any
of the dependent variables and are not shown. Bold values represent significant coefficients estimates (p < 0.05).
Response Intercept Clear-cut Grazing Logging C x G C x L BIC ΔBIC R2
Log(Seedling density) 8,34 -0,57 -0,0014 - - - 127,4 0 0,40
Log(Seedling density) 8,46 -1,11 -0,0012 -0,23† - 0,93† 128,2 0,86 0,47
Log(Seedling richness) 2,62 -0,45 -0,0007 - - - 64,3 0 0,45
Log(Seedling richness) 2,72 -0,47 -0,0007 -0,15† - - 66,0 1,72 0,47
Vegetation cover 84,3 24,3 -0,55† - -10,32† - 438,4 0 0,72
Log(Basal area) 3,60 - -0,0017 - - - 59,6 0 0,61
Log(Basal area) 3,64 0,22 -0,0015 - - - 59,6 0 0,63
Height 2.68 -0.96 -0.0015 - - - 127.2 0 0.55
Log(Plant density) 9,57 -0,37 0,0016 - - - 64,2 0 0,67
22
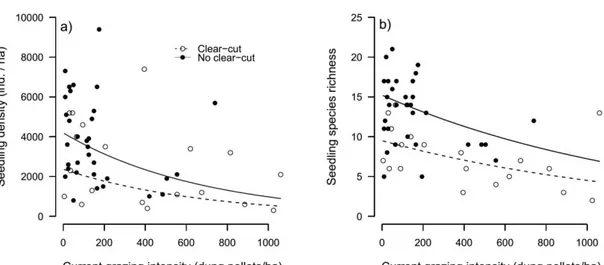
3.2. Density and richness of seedlings
Plots that did not suffer past clear-cut had on average 77% more seedlings than plots with past clear-cut (Fig. 2a, Table 1). With increasing grazing intensity, the density of seedlings decreased (Fig. 2a, Table 1). The best model explaining seedling density had no interactions and only the additive effect of clear-cut and grazing. This model explained 40% of the total variability and the relative explanation of both land-uses were 39% and 61% for clear-cut and grazing, respectively (Table 1). Importantly, the second best model (ΔBIC = 0.86) included the effect of selective logging and a significant positive interaction between selective logging and past clear-cut that added 7% of explained variability (Table 1). Seedling density increased with increasing selective logging in plots that were previously clear-cut in the past. Thus, while past logging (past clear-cut) decreased the number of seedlings, current logging appeared to increase the number of seedlings in these plots. Seedling density was not correlated with time since the last clear-cut (N = 19, r = -0.19, p = 0.44).
23 Seedling species richness was also affected negatively affected by both past clear-cut and current grazing intensity, which together explained 45% of total variation (Table A.1, Fig. 2b). Plots that were not clear-cut in the past had on average 11.8 ± 1.1 species, 70% more than plots that suffered from a past clear-cut (7 ± 1.1 species, Fig. 2b; Table 1). Sixty-six percent (53%) of the explained variation corresponded to the effect of clear-cut and 47% to grazing. Selective logging intensity was present in the second best model (ΔBIC = 1.72) but its effects was not significant (Table 1). Seedling richness was not correlated with time since the last clear-cut (N = 19, r = -0.38, p = 0.11)
3.3. Vegetation structure
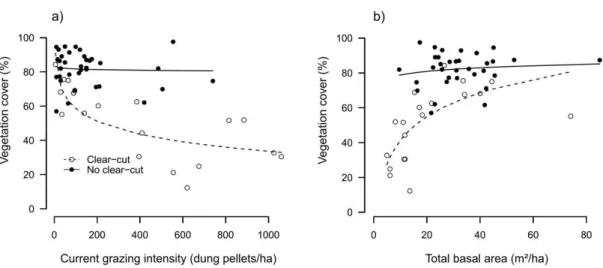
24 Fig. 3. Vegetation cover in 55 Caatinga plots. a) Effects of past clear-cut and current grazing intensity on vegetation cover. b) Relationship between total basal area and vegetation cover. The two lines represent the estimated effects of grazing in plots with past clear-cut (open circles and dashed line) and plots without past clear-cut (closed circles and solid lines). (two columns)
Vegetation cover was positively related to total basal area, but the relationship was visible mainly in plots with past clear-cut (interaction term: F1,48 = 6.82, p = 0.012, Fig. 3b). Plots with a basal area of more than 20m2/ha had a very high cover (average 81%). This was true for most plots without past clear-cut (Fig. 3b). In contrast, in plots with past clear-cut, vegetation cover steeply decreased with decreasing basal area below 20m2/ha (Fig. 3b).
26 Contrary to expectations, in plots with past clear-cut total basal area strongly decreased with increasing time since the last clear-cut (N = 19, r = -0.71, p < 0.001, Fig. A.2b).
Average vegetation height was 1.2± 0.18 m in plots with past clear-cut, 45% lower than in plots without past clear-cut (2.2 ± 0.12 m, Fig. 4b, Table 1). Current grazing decreased vegetation height (Fig. 4b, Table 1) and the additive negative effect of cut and grazing explained forty-nine percent (49%), 58% of which due to clear-cut and 42% due to grazing. Selective logging was not present in any model with ΔBIC < 2. In plots that suffered clear-cut, average vegetation height was negatively related to time since last clear-cut (N = 19, r = -0.47, p = 0.04; Fig. A.2c).
Plant density decreased with increasing current grazing intensity and was lower in plots with past clear-cut (66± 46 per hectare) than in plots without past clear-cut (121 ± 44, Table 1, Fig. 4c). The additive effect of both variables explained 67% where grazing was responsible for 73% of this effect. Plant density decreased with time since the last clear-cut (N = 19, r = -0.57, p = 0.01, Fig. A.2d).
The average basal area per individual plant was not affected by any of the land-use variables, becaland-use the model with an intercept only was the one with the lowest BIC while the second best model had a ΔBIC of 2.8. Also, average basal area per individual plant was not positively correlated with the time since last clear-cut (N = 19, r = -0.28, p = 0.24).
4. Discussion
27 indicate that land use is a significant driver of the loss of vegetation cover, also reducing average height, total basal area, and woody seedling richness and density. Overall, past clear-cut and current grazing intensity have stronger negative effects in comparison to selective logging in our study site, which had a negligible effect in most cases. Importantly, the different land-uses interact, both with respect to their co-occurrence, and with respect to their effect on the vegetation. This was true in particular for grazing which was promoted by past clear-cut. Both the regenerating community and the established vegetation were most strongly negatively affected in plots that suffered past clear-cut and had high grazing intensity.
28 Our results show that in this dryland clear-cuts followed by higher grazing intensity in cleared areas may be responsible for the formation of vegetation patches (decreased vegetation cover), which is considered to be a primer signal for desertification (Cipriotti and Aguiar, 2005; Lopes et al., 2012). In drylands, recruitment and growth of woody plants is greatly improved compared to areas outside the vegetation, because of milder environmental conditions (increased soil moisture and nutrient availability) and by protection against seed predators and herbivores (Graff et al., 2007; Pugnaire et al., 2004; Vieira et al., 2013). Allowing animals to graze in natural areas for a long period might thus prevent plant regeneration and increase bare soil exposure with time, potentially starting a desertification process especially in areas that suffered a previous clear-cut.
Although vegetation cover was not affected by increasing grazing intensity in areas that were not previously clear-cut, all other vegetation features were negatively affected by grazing intensity independent of clear-cut history, such as plant recruitment (Table 1). In the dry season, animals may increase their foraging area due to shortage of food, entering into more into closed areas to feed on small stature seedlings and juveniles of woody species that retain leaves and twigs through all year long (Kaufmann et al., 2013; Papachristou et al., 2005). In a study conducted in another dryland, grazing was more frequent on juvenile plants, which are more palatable due fewer defense mechanisms (Cipriotti and Aguiar, 2005). Also, seedlings are more prone to mortality due to trampling. The reduction of seedling density also observed in our study may impair the natural regeneration causing long-term changes on the adult plant community if new individuals do not replace dead ones.
29 intensity (Bagchi and Ritchie, 2010). Species possessing traits such as high investments in structural tissues, physical defenses and production of secondary compounds to avoid herbivory may thrive in communities with high grazing pressure (Díaz et al., 2007). In another study conducted at the Caatinga, grazers were able to exclude plant species that are less tolerant to trampling and are more palatable (Severino and Albuquerque, 1999). Therefore, grazers could decrease palatable species abundance and consequently increase the success of unpalatable species as occurred in other drylands of Africa (Hanke et al., 2014), Israel (DeMalach et al., 2014) and Australia (Dorrough and Scroggie, 2008). Most plots with high animal load at the reserve investigated here are dominated by shrub species with low palatability such Calliandra depauperata,
Pavonia varians and Croton sonderianus. These plant species have lower height and
diameter which, combined with the smaller number of tree individuals, decreases average vegetation height and total basal area of the community.
5. Conclusions
30 over time. This correlation possibly reflects higher herbivore activity on older clearings which increase the negative effect of clear-cut over time, and it is consistent with the negative effects of high current grazing intensities in previously clear-cut plots. We suggest that to allow succession to succeed in this drylands, land use must be planned avoiding the establishment of grazers in areas that suffered past clear-cut. This simple rule should help to prevent processes of land impoverishment and desertification in this dryland system.
Acknowledgements
We are grateful to Rodrigo Silva for helping during the field work. We are thankful to the National Council for Research and Technology (CNPq) for providing a scholarship to GGM (147969/2010-7), a PQ scholarship to GG, a PVE scholarship to WWW (313596/2013-1) and financial support to conduct the field work. We are also thankful to Coordination of Personal Improvement (CAPES) for providing scholarships to APM and FPM. Further support to WWW was given by the TUMBRA program supported by German Academic Exchange Service (DAAD).
References
Aschero, V., García, D., 2012. The fencing paradigm in woodland conservation: consequences for recruitment of a semi-arid tree. Applied Vegetation Science 15, 307-317.
31 Cipriotti, P.A., Aguiar, M.R., 2005. Effects of grazing on patch structure in a semi-arid
two-phase vegetation mosaic. Journal of Vegetation Science 16, 57-66.
Coffin, D.P., Lauenroth, W.K., Burke, I.C., 1996. Recovery of vegetation in a semiarid grassland 53 years after disturbance. Ecological Applications 6, 538-555.
Conant, R.T., Paustian, K., Elliott, E.T., 2001. Grassland management and conversion into grassland: effects on soil carbon. Ecological Applications 11, 343-355.
Costa, F., Magnusson, W., 2002. Selective logging effects on abundance, diversity, and composition of tropical understory herbs. Ecological Applications 12, 807-819. D'Odorico, P., Bhattachan, A., Davis, K.F., Ravi, S., Runyan, C.W., 2013. Global
desertification: drivers and feedbacks. Advances in Water Resources 51, 326-344. DeMalach, N., Kigel, J., Voet, H., Ungar, E.D., 2014. Are semiarid shrubs resilient to
drought and grazing? Differences and similarities among species and habitats in a long-term study. Journal of Arid Environments 102, 1-8.
Díaz, S., Lavorel, S., McIntyre, S.U.E., Falczuk, V., Casanoves, F., Milchunas, D.G., Skarpe, C., Rusch, G., Sternberg, M., Noy-Meir, I., Landsberg, J., Zhang, W.E.I., Clark, H., Campbell, B.D., 2007. Plant trait responses to grazing – a global synthesis. Global Change Biology 13, 313-341.
Dorrough, J., Scroggie, M.P., 2008. Plant responses to agricultural intensification. Journal of Applied Ecology 45, 1274-1283.
Foster, D.R., 1992. Land-use history (1730-1990) and vegetation dynamics in central New England, USA. Journal of Ecology 80, 753-771.
Graff, P., Aguiar, M.R., Chaneton, E.J., 2007. Shifts in positive and negative plant interactions along a grazing intensity gradient. Ecology 88, 188-199.
32 Hanke, W., Böhner, J., Dreber, N., Jürgens, N., Schmiedel, U., Wesuls, D., Dengler, J., 2014. The impact of livestock grazing on plant diversity: an analysis across dryland ecosystems and scales in southern Africa. Ecological Applications 24, 1188-1203. Htun, N.Z., Mizoue, N., Yoshida, S., 2011. Tree species composition and diversity at
different levels of disturbance in Popa Mountain Park, Myanmar. Biotropica 43, 597-603.
Kaufmann, J., Bork, E.W., Blenis, P.V., Alexander, M.J., 2013. Cattle habitat selection and associated habitat characteristics under free-range grazing within heterogeneous Montane rangelands of Alberta. Applied Animal Behaviour Science 146, 1-10.
Kéfi, S., Rietkerk, M., Alados, C.L., Pueyo, Y., Papanastasis, V.P., ElAich, A., De Ruiter, P.C., 2007. Spatial vegetation patterns and imminent desertification in Mediterranean arid ecosystems. Nature 449, 213-217.
Keshava, N., Mustard, J.F., 2002. Spectral unmixing. Signal Processing Magazine, IEEE 19, 44-57.
Leal, I.R., Da Silva, J., Cardoso, M., Tabarelli, M., Lacher, T.E., 2005. Changing the course of biodiversity conservation in the Caatinga of northeastern Brazil. Conservation Biology 19, 701-706.
Lindeman, R.H., Merenda, P.F., Gold, R.Z., 1980. Introduction to bivariate and multivariate analysis. Scott, Foresman Glenview, IL.
33 Maestre, F.T., Escudero, A., 2009. Is the patch size distribution of vegetation a suitable
indicator of desertification processes? Ecology 90, 1729-1735.
MMA, 2011. Monitoramento do desmatamento nos biomas brasileiros por satélite, Monitoramento do bioma Caatinga, Brasília, pp. 1-46.
Papachristou, T., Platis, P., Nastis, A., 2005. Foraging behaviour of cattle and goats in oak forest stands of varying coppicing age in Northern Greece. Small Ruminant Research 59, 181-189.
Pereira, I.M., Andrade, L.A., Sampaio, E.V., Barbosa, M.R.V., 2003. Use-history effects on structure and flora of Caatinga. Biotropica 35, 154-165.
Pugnaire, F.I., Armas, C., Valladares, F., Lepš, J., 2004. Soil as a mediator in plant-plant interactions in a semi-arid community. Journal of Vegetation Science 15, 85-92.
R Core Team, 2015. R: A language and environment for statistical computing. Vienna, Austria. http://www.r-project.org.
Ramos, M.A., de Medeiros, P.M., de Almeida, A.L.S., Feliciano, A.L.P., de Albuquerque, U.P., 2008. Use and knowledge of fuelwood in an area of Caatinga vegetation in NE Brazil. Biomass and bioenergy 32, 510-517.
Ribeiro, E., Arroyo-Rodríguez, V., Santos, B.A., Tabarelli, M., Leal, I.R., 2015. Chronic anthropogenic disturbance drives the biological impoverishment of the Brazilian Caatinga vegetation. Journal of Applied Ecology 52, 611-620.
34 Skarpe, C., Jansson, I., Seljeli, L., Bergström, R., Røskaft, E., 2007. Browsing by goats on three spatial scales in a semi-arid savanna. Journal of Arid Environments 68, 480-491.
Verheyen, K., Guntenspergen, G.R., Biesbrouck, B., Hermy, M., 2003. An integrated analysis of the effects of past land use on forest herb colonization at the landscape scale. Journal of Ecology 91, 731-742.
Vieira, I., de Araújo, F., Zandavalli, R., 2013. Shrubs promote nucleation in the Brazilian semi-arid region. Journal of Arid Environments 92, 42-45.
35 Supporting information
Appendix A
Table A.1. Woody plant species present in the 55 Caatings plots.
Family Species
Apocynaceae Aspidosperma pyrifolium
Boraginaceae Varronia globosa
Burseraceae Commiphora leptophloeos
Capparaceae Cynophalla flexuosa
Combretaceae Combretum leprosum
Erythroxylaceae Erythroxylum sp.1
Erythroxylaceae Erythroxylum sp.2
Euphorbiaceae Croton adamantinus
Euphorbiaceae Croton blanchetianus
Euphorbiaceae Croton heliotropiifolius
Euphorbiaceae Croton nepetifolius
Euphorbiaceae Croton pedicellatus
Euphorbiaceae Jatropha mollissima
Euphorbiaceae Jatropha mutabilis
Euphorbiaceae Jatropha ribifolia
Euphorbiaceae Manihot sp.
Euphorbiaceae Sapium sp.
Fabaceae Bauhinia cheilantha
Fabaceae Bauhinia dubia
Fabaceae Calliandra depauperata
Fabaceae Calliandra spinosa
Fabaceae Chamaecrista sp.
Fabaceae Mimosa sp.
Fabaceae Mimosa tenuiflora
Fabaceae Piptadenia stipulacea
Fabaceae Poincianella pyramidalis
Fabaceae Pityrocarpa moniliformis
Fabaceae Senna macranthera
Fabaceae Senna splendida
Fabaceae Senna trachypus
Malvaceae Herissantia sp.
Malvaceae Pavonia varians
Malvaceae Sida galheirensis
Malvaceae Waltheria brachypetala
Nyctaginaceae Guapira sp.
Olacaceae Ximenia americana
Turneraceae Turnera diffusa
36 Verbenaceae Undefined species
Table A.2. The effect of past clear-cut on the number of dung pellets (ha-1) counted as a
measure of current grazing intensity in the 55 Caatinga plots.
Cattle Donkey/horse Goat
Total (N=55) 76 ± 114 82 ± 116 88 ± 152
Past clear-cut (N=19) 133 ± 154 154 ± 159 117 ± 180
No clear-cut (N=36) 47 ± 70 43 ± 55 72 ± 134
Fig. A.1. The effect of the time since the last clear-cut on current grazing intensity (a) and
37 Fig. A.2. Effects of time since the last clear-cut on a) vegetation cover, b) basal area of wood
plants, c) average vegetation height and d) plant density. Points are plots that suffered past
38
CAPÍTULO II
GRAZING AFFECTING INTERACTIONS AMONG PLANTS
39
Grazing affecting interactions among plants in a Brazilian semiarid forest
Felipe Pereira Marinho ¹, Gislene Ganade1
1
Department of Ecology, Centro de Biociências, Universidade Federal do Rio Grande do Norte, Lagoa Nova, Natal, RN, 59072970, Brazil
Abstract
Interactions among plants are important mechanisms that define the structure of plant communities. In the literature many works analyze interactions among plants comparing fitness parameters of target plants in the presence and absence of neighboring plants. Livestock practiced freely in forests can modify the abundance of some species in the community by grazing, thus altering the intensity and direction of the interactions between plants. In these study, grazing effects on interaction between the nurse species Ziziphus joazeiro and young targets Poincianella pyramidalis and
Ziziphus joazeiro were verified. Was not observed grazing effect on interactions
between nurse and target species. Grazing affected mainly survival of seedlings. Grazing increased soil compaction near the nurse and modified the height of the herbaceous cover. Semi-arid environments as the Caatinga with livestock pressure, may have high mortality of plants in the initial life stages. The resistance to trampling and grazing can define the species composition long-term. New studies can test how the grazing modifies interactions among plants with new species combinations of different functional characteristics.
40
Introduction
The structure of plant communities can be regulated by competition and facilitation, two key mechanisms that act simultaneously when plants interact. The prevalence of one or another mechanism can be controlled by resources availability and stress conditions (Callaway & Walker, 1997). Competitive interactions between plants are expected to be found in high resource level environments, while facilitation is expected in environments with higher levels of abiotic stress (Callaway & Walker, 1997; Armas et al. 2011; Soliveres et al. 2011). This pattern is known as “stress
gradient hypothesis”, which states that under more stressful environmental conditions,
such as semi-arid environments, some species can facilitate the development of individuals of the same or other species establishing next to its canopy.
Facilitation might occur through various means such as improved microclimate (Ganade et al. 2006), increased nutrients availability (Pugnaire et al. 2004) and protection against predators (Graff et al. 2007). The intensity of facilitation might vary according to target species ontogeny and stress intensity factors (Miriti, 2006; Roux et
al. 2013; Flores-Torres & Montaña, 2015). Predominance of facilitation during
germination and seedling establishment, and competition or neutrality during growth phase is a frequent pattern found in semi-arid environments (Schiffers & Tielbörger, 2006; Bertness et al. 2013). The intensity and direction of interactions between facilitators and beneficiaries plants can have great influence on plant population dynamics and plant communities diversity (Porensky et al. 2013).
41 stress arising from grazing by native and exotic animals. Additionally, the stress gradient hypothesis has been tested primarily using gradients that vary according to abiotic factors such as climate and resources availability while grazing stress have been poorly tested (Tielbörger & Schiffers, 2006; Sthultz et al. 2007; Maestre et al. 2009). In plant communities, grazers can control the abundance of dominant species allowing the occurrence of species that would be otherwise excluded by competition without grazing (Olff & Ritchie, 1998; de Bello et al. 2006; Porensky et al. 2013). Thus, the result of interactions between a facilitator plant (“nurse plant” as described in literature) and
beneficiary plants may be modified in a community through primary consumers (Smit
et al. 2009).
Primary consumer can also influence plant-plant interactions through indirect effects on soil nutrient availability due to dung release or suppression of competitive herbaceous layer. Several studies have shown that in semi-arid environments competitive interactions between herbaceous layer and woody seedlings cause high woody seedling mortality (Scholes & Archer, 1997; Good et al. 2014). However, simultaneous occurrence of woody and herbaceous species occurs in these semi-arid environments due to variations in climate (Good et al. 2014) or resources availability over time (van der Waal et al. 2009), which modifies population size, opening new windows of opportunity for woody seedlings establishment. Interactions between plant species can also be altered depending on the intensity in which grazing is applied (Smit
et al. 2007). The effect of grazing on facilitators and beneficiaries species depend on
their palatability, detectability, ontogenetic stage and resistance to trampling (Fuhlendorf et al. 1997; Díaz et al. 2007).
42 2005; Kéfi et al. 2007; Maestre et al. 2009). Caatinga is a semi-arid tropical forest in which human disturbances have profound influences on plant diversity. Within many sources of disturbance livestock is a major cause of native vegetation degradation (Pereira et al. 2003). Understanding how grazing affects interactions between adult plants and young individuals in Caatinga, is important to determine which plant species can persist in the community after extensive cattle practices. The resulting interaction might be an indicator of species loss over time. Information on how biotic stress influences plant species interactions and affects plant community structure is essential for developing methods to manage and preserve this biome.
This study aims to evaluate: i) how grazing influences interactions between
Zizyphus joazeiro (nurse species) and two target species Caesalpinia pyramidalis and
Zizyphus joazeiro; ii) how interactions vary between different ontogenetic stages of
target species and iii) how the presence of introduced herbivores modify herbaceous cover and soil parameters.
43
Materials and methods Experimental area
The experiment was conducted in a farm located near the Açu National Forest, Rio Grande do Norte state, Brazil, 5°32'23.01"S and 36°57'18.66"O coordinates. The climate is semi-arid with average annual rainfall between 400 and 600mm (Alvares et
al. 2013). After clear-cutting, areas are generally used for agriculture and pasture for
livestock (goats, cattle and horses). The experimental area suffered clear-cutting about 50 years ago for implementation of cotton plantations (widely practiced in the Brazilian semi-arid region in the last century). However, the past 20 years agricultural activities have not been developed and the area was abandoned. In the rainy season (March-June) the study area consisted of a few isolated trees (mainly Zizyphus joazeiro and
Combretum leprosum) surrounded by a dominant herbaceous cover. In the dry season
the herbaceous cover disappears, forming a scenario of isolated trees in a bare soil matrix. In the study area, cattle and horse grazing is a frequent activity. The herbaceous cover is an important source of food for these animals in Caatinga, especially during rainy season. In addition to livestock, the movement of abandoned donkeys by local communities is common. About 30 animals among cattle, horses and donkeys can be seen circulating in the study area daily.
Study species
44 crown, Zizyphus joazeiro is expected to present a high potential to act as a nurse species. To test possible nursing effect of Zizyphus joazeiro, two target species:
Caesalpinia pyramidalis and the same Zizyphus joazeiro were used. Caesalpinia
pyramidalis Tul. is endemic and widely distributed throughout the territory covered by
the Caatinga biome.
Experimental design
In the study area, seven Zizyphus joazeiro adult individuals were chosen at random from 20 available ones to implement seven experimental blocks. Only Zizyphus
joazeiro trees with canopy area larger than 3 meters radius and located at a minimum
distance of 30 meters from other tree were considered available. Below each Zizyphus
joazeiro tree, two square plots of 2 x 2 meters were implemented, one was fenced to
prevent access of animals and the other remained open. The place where each plot was implemented was chosen at random. The fence was constructed using wood stakes 1.70m tall and surrounded by five laps of barbed wire 0.40m distant from each other. The open plot were marked with wood stakes 0.2m in height. The same procedure was repeated in open areas placed at a 15 meters distance from the adult tree in a randomly selected direction. In each experimental plot one individual of each target plant
Caesalpinia pyramidalis and Zizyphus joazeiro were planted for each ontogenetic stage:
45 (seedlings and juveniles) were all randomized in a block design with a total of seven experimental blocks. The experiment lasted six months, from April to September 2014.
Measurements of target species performance
Growth performance of target plants was estimated by measuring the following parameters: height, stem diameter at ground level and number of leaves. To calculate average growth rate, each monthly measurement was subtracted from the previous month, this value was summed up for all months and divided by the total number of months. Only months in which plants were still alive were used for growth rate calculation. Plant survival was monitored at first from 10 to 10 days up to 30 days and then montly until the end of the experiment. Plants were considered dead when they were not found or were without leaves and with signs of dryness in the stem.
Survey of herbaceous cover
Height of the herbaceous cover was registered in June, when most species were producing flowers, which indicates the end of their annual cycles. Height was measured within the center of each plot. A measuring tape was stretched vertically at each point, the highest value of height in which the measuring tape was touched by vegetation was registered. This procedure was repeated four times per plot and the average values were used in the statistical analyzes.
Soil sampling parameters
46 hours, and after this procedure they were weighed again. Differences between the sample weights before and after drying were considered as the amount of water present in the soil sample. For statistical analysis we used the percentage of water present in each sample. For each collected sample soil concentrations of nitrogen, phosphorus and potassium were analysed at the Laboratory of Agricultural Research of Rio Grande do Norte S/A.
Soil temperature was registered in all plots using a digital thermometer. Measures were performed around noon in three days along the experimental period. For each plot the thermometer sensor was introduced into the soil 15 cm deep, and temperature was recorded after one minute. This procedure was performed four times in each plot, the statistical analysis used the average of these values for each treatment plot measured.
Soil resistance to penetration was measured using penetrometer with analog pressure gauge. A subplot of 0.5x0.5m was placed in the center of each 2x2m plot and measurements were made at the sub-plot vertices. The penetrometer comprises a metal rod which is pushed manually against the ground to achieve 20cm penetration, the pressure gauge located at the top of the device shows the pressure measurement needed to performed this task in pounds per square inch (psi). This data was transformed to megapascal (MPa) in the statistical analysis. Five measurements were performed in each treatment plot (with nurse/fenced, with nurse/open, without nurse/fenced and without nurse/open) for all blocks, with a total of 112 measurements. The average of this five measurements were used in the statistical analyzes.
Statistical analysis
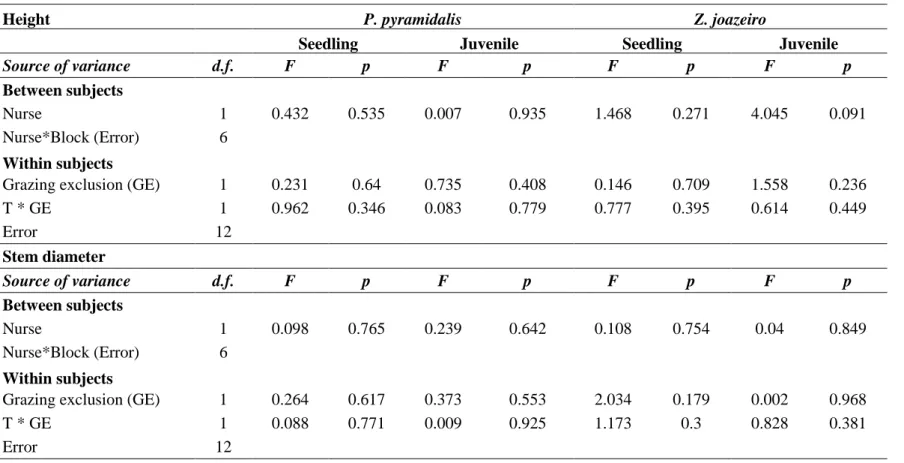
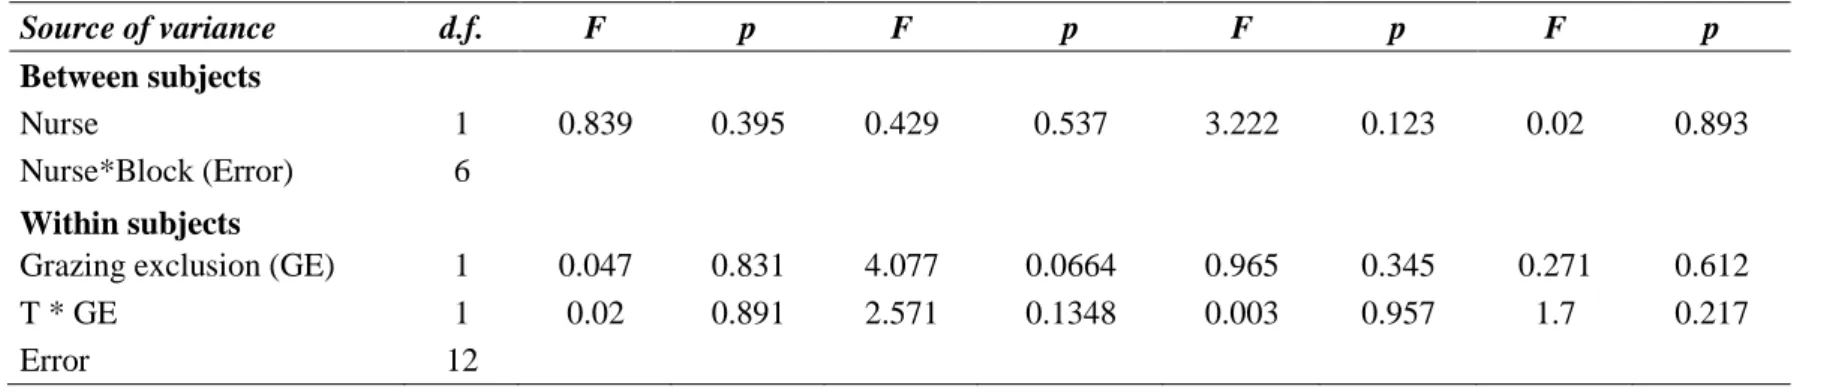
47 Average growth rate values as well as days of plant survival were analyzed individually for each target species and ontogenetic stage (seedling of C. pyramidalis, juvenile C. pyramidalis, seedling of Z. joazeiro and juvenile of Z. joazeiro). In a Split Plot factorial ANOVA, growth rate values and days of survival were used as response variables to test the effects of the grazing exclusion treatment (factor with two levels: "with" and "no" fence) and nurse presence (factor with two levels: “below” and “far”). The interaction between the two variables was also included in the analysis.
Environmental variables
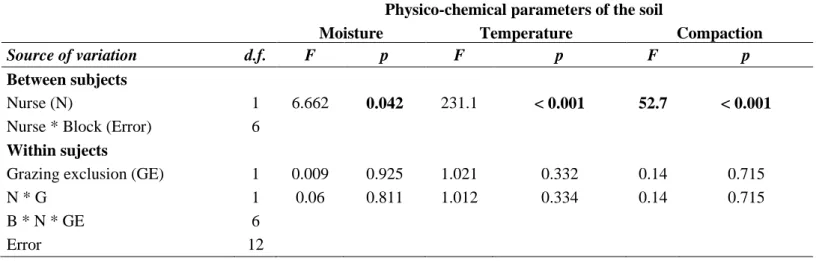
A Split Plot factorial ANOVA was used to determine the differences in soil parameters in response to two factors: presence of nurse and grazing exclusion. The response variables were: i) height of the herbaceous vegetation, ii) soil moisture, iii) soil temperature , iv) soil compaction, v) concentration of nitrogen, vi) concentration of phosphorus and vii) concentration of potassium. All analyzes were performed with R 3.1.0 program (R core Team, 2014).
Results
Influence of grazing and adult Zizyphus joazeiro on growth of target species
48 Figure 1. Average ±1 SE for growth rates measured for height, stem diameter and number of
50
Survival of target species
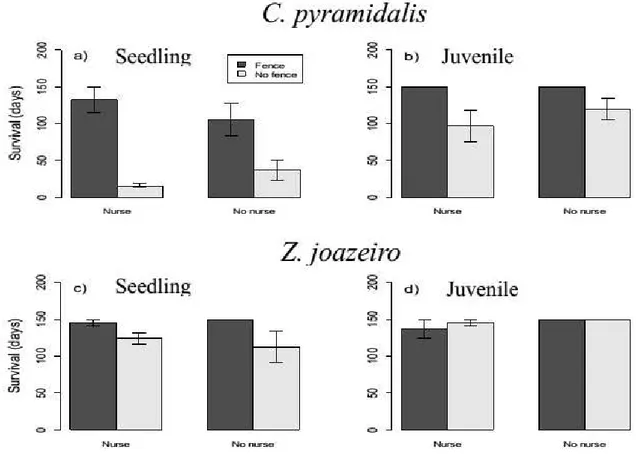
Seedlings and juvenile of C. pyramidalis had higher survival in fenced plots than in open plots (F1;12 = 22.276, p < 0.001 and F1;12 = 10.319, p = 0.007, respectively) (Table A.2 – Appendix A). Grazing affected significantly the survival for seedlings of
Z. joazeiro, plants located in fenced plots had higher survival (F1;12 = 6.047, p = 0.03). However, survival of juvenile was not affected by grazing (F1;12 = 0.364, p = 0.558). There were no differences in survival between seedlings of the two target species in fenced plots, C. pyramidalis had average of 119 (fig. 3a) and Z. joazeiro 148 days (Fig. 3c) (df = 14, t = -2.005, p = 0.065). However, in open plots there was a significant difference in survival, seedlings of P. pyramydalis survived 26 days on average (Fig. 3a) and Z. joazeiro 118 days (Fig. 3c) (t = -6.940, df = 23, p < 0.001).
Figure 3. Days of life for two target species below and away of nurse. Black bars indicate
51
Herbaceous cover
Height of herbaceous cover was influenced by two factors: nurse presence (F1;6 = 22.76, p = 0.003) and grazing exclusion (F1;12 = 43.468, p < 0.001; Table A.3 – Appendix A). Average herbaceous vegetation height below Z. joazeiro was 0.15m while far from Z. joazeiro it was 0.41m (Fig. 4a). Additionally, fenced plots had an average herbaceous vegetation height of 0.40m in contrast to open plot where vegetation was in average 0.16m (Fig. 4a). There was no significant interaction between grazing and nurse treatments affecting herbaceous cover (F1,12 = 1.558, p = 0.236).
Soil Parameters
There were higher soil moisture bellow of Z. joazeiro tree with an average of 0.59% while far from nurse have an average of 0.51% (F1;6 = 6.662, p = 0.042; Fig. 4b, table 3) (Table A.3 – Appendix A). Grazing exclusion and the interaction between grazing and nurse treatments did not influence soil moisture (Table A.3). Soil temperature was significantly higher in the absence of nurse species (38ºC) than below nurse canopy (32ºC) (F1;6 = 231.1, p < 0.001; Fig. 4c, table A.3). Soil compaction was significantly higher below Z. joazeiro where the pressure necessary for soil penetration was 205 MPa compared to 138 MPa far from nurse canopy (F1;6 = 52.7, p < 0.001; Fig. 4d, table A.3). Neither the grazing treatment nor its interaction with the nurse treatment influenced soil compaction (Table A.3).
Concentration of nutrients in the soil
There was no differences in the concentration of analyzed macronutrients (N, P, K) between the treatments nurse presence and grazing exclusion (Table 4 – Appendix
52 Figure 4. Parameters of herbaceous vegetation and abiotic soil factors: a) Height of herbaceous
cover, b) soil moisture, c) Soil temperature and d) Soil hardness. Black bars indicate fenced plots and white bars open plots.
Discussion
53 The composition of herbaceous species can not provide good fixing N and the experiment time was not sufficient to obtain a change in the concentration (Menezes et
al. 2002). Facilitation interaction between plants is expected to occur mainly under
stress conditions (Callaway & Walker, 1997). The fact that target plants experienced abundant rain during the first 4 months of this six months experiment might have reduced the stress, which partially explains these lack of facilitation. During this favorable rainy season, improved environmental conditions for establishment bellow nurse plants might not be so different from microclimatic conditions away from nurse. In that case, shading under Z. joazeiro dense canopy might have a deleterious effect on target growth. Furthermore, competitive interaction may occur among species with similar niches (Blomberg et al. 2003), in this way seedlings and juveniles of the target
Z. joazeiro could have decreased grow next to a larger co-specific plant.
Grazing did not affect growth for target species as expected, but decrease survival in open plots. The higher soil compaction beneath Z. joazeiro nurse indicates that there is a high circulation of grazers in this area. In open plots was possible to see various signals of trampling (field observations) that may have caused high seedling mortality for C. pyramidalis and Z. joazeiro. For juvenile stage only C. pyramidalis was affected. Graff et al. (2007) verified a facilitative interaction by association among Stipa
speciosa (unpalatable nurse) and the palatable targets Poa ligularis and Bromus pictus.
In this case, under moderate grazing pressure, S. speciosa facilitated the growth of the target plants due to the presence of thorns that provided protection against grazers. For
Z. joazeiro there was an opposite effect, where the potential nurse plant has a high
palatability of leaves and fruits, and represents an important source of food for Caatinga’s fauna and livestock animals. In addition, Z. joazeiro has a closed canopy that
54 (2002) recorded interception between 65 and 70% of solar radiation in the period between 10pm and 2pm. Juvenile plants of C. pyramidalis showed no signs of grazing such as cut leaves and broken stems (field observations). The presence of secondary compounds in C. pyramidalis is very characteristic of this genus and subfamily (David
et al. 2010) and high concentration these defense substances can avoided grazing.
However, both ontogenetic stages had high mortality in open plots. Long-term pressure may cause local extinctions for some species or indirect facilitation to others (Díaz et al. 2007; Maestre et al. 2009). Tolerance to trampling and grazing may selected against sensitive species decreasing species richness in the long-term (Díaz et al. 2007).
Seedlings of C. pyramidalis and Z. joazeiro were more affected by grazing than juveniles. Many plant species in the early stages of growth allocate most of their energy in above-ground biomass with little investment in defense mechanisms such as secondary compounds and thorns (Boege & Marquis, 2005). Juvenile plants have a more developed root system than seedlings which makes them more tolerant to physical stress (Hanley et al. 2007). In the case of long-term disturbance by grazing, intolerant plants can allocate energy in the recovery of above-ground biomass, which could reduce reproductive fitness, decreasing its competitiveness with other beneficiaries and nurses (Boege & Marquis, 2005). Places with high grazing pressure cannot allow regeneration processes due to the low seedling recruitment in the plant community.
As previously said, from the six months monitored in this experiment the first four months experienced a good rainy season, leading to the growth of the annual herbaceous cover. Furthermore, herbaceous species are generally adapted to open places (Grime, 2001), thus, they might have decreased its height in the fenced plots below Z.
joazeiro due to shading (Fig. 4a). In open plots, the exotic grazers maintained a low
55 grazing by exotic animals can serve as a third species in the interaction between plants, reducing herbaceous cover and indirectly facilitating seedlings (Köchy & Peltzer, 2001; Jensen et al. 2012; Flores-Torres & Montaña, 2015). However, under high grazing intensity the indirect facilitation of seedlings can become neutral due to the negative effect of trampling on survival.
Conclusion
Contrary to our expectations we found that Z. joazeiro, did not function as a nurse species in this semi-arid system and that grazing by livestock animals does not modify the outcome of nurse target interactions. However, we found that grazing has a negative effect on seedling survival. We also found that grazing tolerance varies between species and ontogenetic stages. Future studies can test how grazing modifies interactions among plants with new species combinations of different functional characteristics. This information may be important for development of forest management policies and conservation of endangered species in this semi-arid environments.
References
Alvares, C. A., Stape, J. L., Sentelhas, P. C., de Moraes Goncalves, J. L. & Sparovek, G. (2013) Koppen's climate classification map for Brazil. Meteorologische
Zeitschrift, 22, 711-728.
Armas, C., Ordiales, R. & Pugnaire, F. I. (2004) Measuring plant interactions: A new comparative index. Ecology, 85, 2682-2686.
Armas, C., Rodriguez-Echeverria, S. & Pugnaire, F. I. (2011) A field test of the stress-gradient hypothesis along an aridity stress-gradient. Journal of Vegetation Science, 22, 818-827.
56 Blomberg, S.P., Garland, T., Jr. & Ives, A.R. 2003. Testing for phylogenetic signal in
comparative data: behavioral traits are more labile. Evolution 57: 717-745.
Boege, K., Marquis, R.J. (2005) Facing herbivory as you grow up: the ontogeny of resistance in plants. TRENDS in Ecology and Evolution, 20, 441-448.
Callaway, R. M. & Walker, L. R. (1997) Competition and facilitation: A synthetic approach to interactions in plant communities. Ecology, 78, 1958-1965.
David, J.M., Bahia, M.V., David, J.P. (2010) Occurrence of biflavones in leaves of
Caesalpinia pyramidalis specimens. Química Nova, 33, 1297-1300.
de Bello, F., Leps, J. & Sebastia, M.-T. (2006) Variations in species and functional plant diversity along climatic and grazing gradients. Ecography, 29, 801-810.
Díaz, S., Lavorel, S., McIntyre, S., Falczuk, V., Casanoves, F., Milchunas, D.G., Skarpe, C., Rusch, G., Sternberg, M., Noy-Meir, I., Landsberg, J., Zhang, W., Clark, H., Campbell, B.D. (2007) Plant trait responses to grazing – a global synthesis.
Global Change Biology, 13, 313–341.
Flores-Torres, A. & Montana, C. (2015) From facilitative to competitive interaction between Larrea tridentata and Cylindropuntia leptocaulis in the southern Chihuahuan Desert. Journal of Vegetation Science, 26, 68-79.
Fuhlendorf, S. D., Smeins, F. E. & Taylor, C. A. (1997) Browsing and tree size influences on Ashe juniper understory. Journal of Range Management, 50, 507-512. Ganade, G., Zanini, L., & Hubel, I. (2006) Facilitation and competition influence
succession in a subtropical old field. Plant Ecology, 185, 179-190.
Good, M. K., Clarke, P. J., Price, J. N. & Reid, N. (2014) Seasonality and facilitation drive tree establishment in a semi-arid floodplain savanna. Oecologia, 175, 261-271. Grime, J. P. (2001) Plant functional types, communities and ecosystems. Ecology:
Achievement and Challenge, 161-181.
Hooper, D. U., Chapin, F. S., Ewel, J. J., Hector, A., Inchausti, P., Lavorel, S., Lawton, J. H., Lodge, D. M., Loreau, M., Naeem, S., Schmid, B., Setala, H., Symstad, A. J., Vandermeer, J. & Wardle, D. A. (2005) Effects of biodiversity on ecosystem functioning: A consensus of current knowledge. Ecological Monographs, 75, 3-35. Jensen, A. M., Lof, M. & Witzell, J. (2012) Effects of competition and indirect
facilitation by shrubs on Quercus robur saplings. Plant Ecology, 213, 535-543.
Kefi, S., Rietkerk, M., Alados, C. L., Pueyo, Y., Papanastasis, V. P., ElAich, A. & de Ruiter, P. C. (2007) Spatial vegetation patterns and imminent desertification in Mediterranean arid ecosystems. Nature,449, 213-U5.