PUBLICAÇÃO DA ABCM • ASSOCIAÇÃO BRASILEIRA DE CIÊNCIAS MECÂNICAS
A A
REVISTA BRASII.EIRA DE CIENCIAS MECANICAS
JOURNAL OF THE BRAZILIAN SOCIETI' OF MECJ[I\NJCAL SCffiNCES
EDITOR:Leonardo Goldsteln JOnlor UNIAMP • FEM • DETF • C. P. 6122 13083-970 campinas SP
Tel.: (019) 239-3006 Fax: (019) 239· 3122 EDITORES ASSOCIADOS: Agenor de Toledo Flaury
IPT - lnstbuto de Pesquisas Tecnológicas
Dlvlsao de Mecank<l e Elatrlcldade • Aorupamento de Sistemas de Conuole Cidade Universltálla • C. P. 7141
01064-970 s.lo Paulo SP
Tal : (01 I) 268·2211 Ramal 504 Fax: (0 11) 869·3353 AngeJa DurMo Nleeke1e
Pontlllcia Universidade Católica do Rio de Janeho Departamento de Engenharia Mecanlca Rua MarQuês de 530 VlceMe. 225 Gávea 22453·900 Rio de Janeiro RJ Tal.: (021) 239-0719 Fax: {021) 294-9148 Carlos Alberto Carrasco Ahermanl UNtCAMP- FEM- DE- C. P. 6122 13083-970 campinas SP
lei: {019) 239·8435 Fax.: (019) 239·3722 Paulo Elgi Miy;~gl
Universidade de 5.\o Paulo • Escola Politécnica Departamento de Engenhi!Jia Mednica · Meca1rõnica Avenida Prol. Mello Moraes. 2231
05508·900 Sao Paulo SP
Te1.: (011\ 818· 5580Fax: {O I 1) 818·5411/8 13·1888 Walter l. We1ngaertner
Unlv8fsidade federal de Santa Catarina
Departamenlo de Engenharia Mecanl(a • Laboratório de Mecanica de Precis:Jo Campus Universttârio Trindade-C. P 476
88040-002 f lorlan6J)olls se
Tel.: (048) 231·9395/2J4·5277 fax· (048) 234·1519 CORPO EDtTORIAL:
Aicir de Faro Orlando (f>UC • RJ) Antonio Francisco Fortes (UnB) Armando Albertazzi Jr. {UFSC) Ata ir Rios Neto (INPE)
Benedito Mor~s Purquerio (EESC • USP) Calo Mario Cos!a (EMSRACO) Carlos Alberto de Almeida (PUC • RJ) Carlos Alberto MaJtin (UFSC) Clovis Raimundo Malisl<a (UFSC) Emanuet Rocha Wolsld (UNESP • FEJS) FranciS<:o Emnlo Baccaro Nlgro {I PT • SP)
Francisco José Simões (UFPb) Genesio José Menon (EFE.I) Hans lngo Weber {UNICAMP) Henrique Rozenfeld {EfSC USP) Jair Carlos Outra {UFSC) Joao Alziro He12 de Jornada {UffiGS) José João de Espindola {UFSC) Jurandir ttizo Yanagihara {EP USP) li rio Schaefer (UffiGS) · Lourival Boehs {UFSC) Luis Carlos Sandoval Goes'(tTA) Martio Zlviani {UFMG) Moyses Zindeiuk (CDPPE • UFRJ) Nisio de Carvalho lobo Brum (COPPE • UFRJ) Nivaldo lemos Cupinl (UNICAMP) Paulo Alonso de Oliveira Soviero {ITA) Paulo Eigl Miyagl {EP UsP)
ROQerio MartiiiS Saldanha da Gama (lNCC) Valder Steflen Jr. {UFU)
REVISTA FINANCIADA COM RECURSOS DO
Programa de Apoio a Publicações Científicas
MCT
@l
CNPq
12)
FINEP
I
RBCM • J . of th• Bru. Soe. lhchank:al Sclencn
Vol. XVIII · n•1 • 1Q96 • pp. 1-7 ISSN 0100..7386 Printed in Brazil
Preliminary Considerations on a New Design
Concept for Below the Knee Energy Storing
Prosthesis
-Fellpe Nogueira
Instituto Tecnológico de Aeronáutica Departamento de Estruturas
Sérgio F. Muller de A lmeida
Instituto Tecnológico de Aeronáutica Departamento de Projetos
12228-900 S. José dos Campos, SP Btazil
Abstract
This study develops a concept for lhe design and manufacture of energy sloring prosthesis lhat attempts to simplify lhe dcsign proccss ofsuch prosthetic deviccs . This concept consists ofthrce basic steps: identifying dcsign requircments, computational analysis and tests. The most relevant paran1eters used in lhe process and design compromises bctween lhesc paran1eters are identified and explained. Non linear bchavior and expected results of non linear finite element analyses are explained together with an overview of laboratory and field tests performed. Some criticai points identi ficd in .prcliminary test results are presented. The methodology proposed was successively applied to lhe development of a composite material energy storing prosthesis.
Keywords: Energy Storing Prosthesis, Compositc Material., Biomechanics
lntroduction
Advances in design and research of new materiais have caused a change in the market of solid ankle prosthetic devices in recent years. This advances, allied with a growing demand for prosthesis that improve athletic performance, led to the development of energy storing prostheses (ESP).
ESP are high performance solid ankle flexible prostheses designed to storc and release energy during gait. They have special characteristics that make them more attractive and comfortable than conventional prostheses. Some of thesc characteristics are:
Less shock transmission; Better darnping properties; Less weight, and
Better response.
Thesc new prostheses are designed so that their keel deforms during the second and third stages of the stance phase of gait (after heel strike), thus storing energy as a deformed spring. Therefore, kinetic energy from the swing phase is transformed into potential energy. Afterwards, in the stage of stance (toes ofl), the keel returns to its undeformed position releasing energy and helping to push the amputee into the swing phase of gait. At this instance, potential cnergy is converted again into kinetic energy.
Even though the benefits of ESP for below the knee arnputees (BKA) have been reported by many sources (Gailey et al ., 1994; and Ataranta et ai. , 1994), these is still a shortage of ESP in the Brazilian market.
The prob lem at hand is to design an inexpensive device that wi ll improve the energy efficiency, therefore reduci.ng the energy expenditure of BKA. Energy expenditure of a prosthesis can be defined as the d ifference of energy stored and energy lost due to hysteres is. It can be measured using ambulation te<:hniques (Colbome., 1992) and estimated from finite element analy ses.
Reducing energy expenditure is lhe sarne as maximizing energy efficiency. This can be achieved by enhancing the load transferring from heel to toes, simulating the action of foot and ank le. Also. new materiais that reduce weight and help on the performance can be used .
Barr et ai. (I 992) calcu lated the energy efficiency of the Carbon Copy IJ® energy storing prosthetic foot ofFiex Foot Inc., and ofthe SACH (solid ankle cushioned heel) foot ofOtto Bock. The
2 F. Nogueira and S. F. M. de Almeida
ESP retumed energy with an efficiency of 57% while the SACH foot returned onJy 29.3% of tbe energy it stored.
Colbome ( 1992) compared oxygen consumption during levei walking of subjects fitted with lhe SACH foot, and with lhe energy storing Seattle AnkJe!Lite® foot. The results of this work iodicated that the oxygen consumption was significantly higher in the SACH foot, leading to lhe conclusion that lhe ESP reduced energy expenditure ofthe subjects tested.
The complexity. however. lies in the subjectivity of the problem. Each BKA is a particular case and requires a set of design parameters. Moreover. each BKA has a particular preference on how to adjust each of these parameiers.
The objective of this research is to develop a new design concept. This new concept has to reduce manufacturing costs. conserve lhe characteristics of ESP and be customizable so it can be adapted to lhe subjectivity discussed above.
One of the main coocerns is to establish lhe influence of measurable engineering quantities on comfon and on lhe design parameters. By doing so. it is possible to satisfy the BKA's preferences by adjusling thc quantity lhat influences a panicular design parame1er.
This is achieved by manufacturing keels with different geome1ry. This way, it is possible to observe lhe change in engineering 1erms as well
as
in performance and comfort.Th1s design concept is just a set of steps that need to be taken in order to design and manufacture an ESP. Correlatlon to the results of some prototype tests are presented, but final design and results are not presented here. Final design and results are beyond the scope ofthis work.
Design Concept
Thc concep1 developed in the study consists ofthree main phases: identifying design requirements. c.:omputalional anaJyses and tests.
ln the firsl phase. lhe intention is 10 clarify objectives and set the general requirements of tbe design. Thc second and third phases are used to generate alternatives and to cvaluate them in order to improve on the originaJ designs.
One of the purposes of this article is 10 present the objectives of this design concept. which are, among others:
Provide ali necessary information for mold production; Adapt thc design process to subjeclivity;
Reduce manufacturing costs;
Reduce BKA's energy expendilure, and Improve performance.
Oesign Requirements. ln order to determine lhe design requirements, lhe pararneters involved have to be listed in advance. Therefore. a tree of objectives (Dieter, 1991) was constructed in order to clarify objectives and identify lhe design parame1ers.
The most relevant design pararneters used in this study are: BKA's data (weight. foot size, physical activity, etc.); Strenglh;
User Comfort; Stiffness; Durability; Material, and
Manufacturing facilities.
Preliminary Consideration on a New Design ... 3
Laminated graphite/epoxy composite materiais were selected to be used in the prototypes because of thei.r excellent mechanical properties. These materiais can be tailored to sustai o large loads and large defonnations while maintaining their structural integrity and fatigue resistance.
Composite materiais also have good orientation capabilities. The problem at hand calls for a material with mainly longitudinal properties, therefore the plies can be placed in a way to maximize the bending strength of the ESP, without compromising comfort.
The manufacturing facilities available are also important at the design stage. The designer should pay close attention to the manufacturlng capabilities at hislher disposal so the prototypes can be easily manufactured.
Keels with different geometry were manufactured according to the design requirements specified above. One ofthese keels is shown in Fig. 1, together with a graphitelepoxy pylon.
The pylons were also manufactured using composite materiais in order to minimize weight and fatigue problems. Severa! aluminum pylons fail due to fatigue as discussed by Wevers and Durance
(1987).
Computational Analyses. This step was performed using the software ARlES for geometric modeling and NASTRAN for finite element (FE) analysis.
A geometric model was developed using the ARlES solid modeller. This model was useful in determining:
Mass properties; Surface areas; Moments of inertia; Finite element model, and Mold fabrication.
Mass and inertia properties as well as surface areas are readily available from the model without the need of new analysis. These properties and arcas are helpful in cost evaluation. mold fabrication and speeding the manufacturing of prototypes.
Finite element analyses were responsible for predicting the behavior ofthe prototype under testing conditions. They were also helpful in predicting failure indexes of the various plies of composite materiais as well as predicting the maximum loads that lhe prototype could withstand.
4 F. Nogueira and S. F . M. de Almeida
The type of analysis performed was non linear because, as seen in Fig. 2, the load versus displacement curve of an ESP is non linear. This is duc to the large displacements to which prostheses are submitted in regular use.
The non linear behavior oft.he prosthesis is controlled by some factors, among which: Laminate thickness;
Keel taper. and Laminate lay up.
The interpretation ofthe graph in Fig. 2 shows a stiffening behavior as the load increases. This is a characteristic of ESP. Note that the arca under the curve corresponds to the energy stored by the device during the first stages of the stance phase of gait.
Figure 2 shows the load vs displacement curve corresponding to a particular test with loads up to a levei of 1500N. The degree of non linearity is not shown with accuracy in the figure because actual loading is higher (up to 4500N). Higher Joads results in further stiffening not shown in the graph and, thus, in an augrnented degree of non linearity.
Some of the energy is lost due to hysteresis, and some is returned to the BKA. The difference hetween the energy stored and the energy lost due to hysteresis dictates the efficiency of the de v ice.
Thereforc, the amount of energy lost due to hysteresis should be minimized. By doing· so, one maximizes the energy efficiency of the ESP. FE analysis can be used to estimate the encrgy efficiency and modify the design so better cnergy efl'iciency can be achieved.
The output of a given FE analysis also points out the region with higher stress concentrations, worst stress gradients and failure indexes. Therefore, it is possible to determine criticai points in the design, from a structural poim ofview, and change material or geometry to correct any imperfections.
Tests. The prototype keels were also submit1ed to severa! tests to validate and improve the design. These tests were used to simulate the actual loads that BKA submit their prosthesis to in regular use.
Two separate farnilies of tests were performed. Laboratory tests were conducted using an lnstron machine and field tests were perforrned with the assistance of a volunteer anda certified prosthetist.
1GOO
1200
~
"' 800 (1) o
...J
·100
o
10 20 30 40 50Displacement (mm)
Preliminary Consideration on a New Des1gn ... 5
Laboratory static tests performcd consisted of a static proof test and a static test to failure . Specimens that passed the prooftest were used in the failure test
The basic guidelines of lhe laboratory tests followed recommendations present in a document being circulated by the lnternational Standardization Committee (ISO). This document is being c irculated as a Draft lntemationaJ Standard and attempts to standardize the tests of lower limb prosthetics.
The amount of load applied in the proof test was determined following the guidelines of the ISO document. This document also provi de guidelines to fatigue tests not concluded at the time of this publication.
The line of load application was determined based on a work by Grundy et ai. ( 1975). According to this study, the forefoot supports most ofthe loacting, about three times as much as the heel.
Moreover, the work points out that the maximum load in lhe forefoot occurs ata point in time just before the opposite's foot heel strik.es the ground. This point is detennined to be about 70 to 75 % of lhe foot's length. starting from the heel as seen in Fig. 3 (Grundy et al., 1975). This conclusions are also supported by a worl< ofWevers and Durance (1987).
figure 3 shows lhe typical graphs of forces and center of pressure of lhe foot. Note that there are two load points mark.ed as T and H. These letters mark the positions at which the opposite's foot toes leave the ground (T) and when the opposite's foot heel touch the ground (H).
Field tests consisted of a preliminary test to identify criticai points in the design at an early stage and tcsts to determine geometry.
The preliminary field test identi fied four criticai design issues: hcel height, flexibility of heel and toes and pylon orientation adjustment. The subject fitted with the prototype affirmed that the heel was too rigid while lhe other extremity was not rigid enough. Another criticai issue, adjustment, was raised durmg test reviewing with the certified prosthetist. ln this reviewing, test results, prostbesis titti.ng and periodical adjustments were discussed.
Final tests are planned to test several kecl with different thick:ness and taper. These tests will assess the influence of ditferent aspects of the chosen geometry on the design parameters.
Mainly, the last test runs are designed so information on keel tapering can be obtained. The overall behavior ofthe keel is highly dependent on the geometry. After this last tests, the production molds will be manufactured.
E o >
10
6 F. Nogueira and S F. M de Almeida
Field Test Results
The results of the ficld tests were briefly com mented in the last section. They are based on amputee's observations, and the main issues that appeared were:
Heel not high enough; Heel is too rigid;
Toes are not ri gid enough. and
Better adjustment of the pylon orientation is needed.
The heel height was found to be an imponant parameter. This is due to the fact that the higher the heel. thc longer Lhe detlecting portion ofthc kccl. As the denecting part ofthe keel is extended, there is more energy stored and rclcased during a gait cycle.
The rigidity of the heel was considered the most criticaJ point of th e prosthesis. Some attempts are bcing made to soften the heel, but a compromise between heel softncss and height is needed. Observations have also led to the conclusion that it is better to loose some softness in the heel than to loosc height.
lf the heel is too soft. it will sin k more as it touches the ground and. thus, decrease the portion of the keel available for defection. On the other hand, if the heel is set rigid and high, there will be a greater portion of the heel available for deflection while shock absorption at the heel will be worse.
The problem with the rigidity ofthe toes has to do with the swing phase. The amputee complained that there was not enough push from the stance of gait to the swing phase. This is being corrected by means of a change in geometry.
Each BKA 1s a different problem. Thereforc the prosthesis alignment is particular to each one. Somctimes, even a small adjustment will h ave an effect on the gait pattern of an amputee. So the adjustment ofthc ESP should be able to accommodate these fine tunings.
Adjustments in most commercial prosthesis are achieved using the well known pyramid mechanism. A newer adjustmcnt mechanism that simplifies the work ofthe prosthetist is being tested.
Therc werc some pomts in favor of the designas well. Among them, it is worth noticing the following:
Keel as a whole is responding well, and Good re.<>ponse also at accelerated march.
As an ESP, the prototypc is responding wellto the loads of daily use in either laboratory or reallife cnvironment. The amputee walked with comfort and with no other complaints. except from the hccl rigidil).
Thc assembly was simplc and set up time was comparable to othcr prosthesis in the market.
Conclusíons
The new design concept presented in this work attempts to sirnplify the design process of ESP. lt identificd the major design parameters as well as the major design objectives. Dcsign phase and its objectives were also identitied and their peculiarities were explained in a simplified fashion.
Com putational analyscs proved to be an effective way of predicting the behavior of a prototype bcforc it is actually manufactured. The non linear behavior of ESP can be easily modelcd in the FE analyses. speeding the design process.
Laboratory tests are being conducted. but the non linear behavior of the prosthesis has been contirrned. Figure 2 shows a typicalload versus displacement curve of prototypes.
Field tests were able to determine criticai points in the design at an early stagc. Other tcsts are being perforrned to assess the influence of keel tapering on engineering quantities and comfort.
Preliminary Consideration on a New Design ... 7
subject, the overall perfonnance of the prototype prosthesis was better than that of an Otto Bock Dynamic Foot® o r to that of a Seattle Ank:le/Life Foot®
The design concept proved to be an effective too I in the early design stages. lts phases, identifying design requirements. computational analyses and tests, are common practice in the engineering design procedure. This methodology was successfully applied to the development of lhe composite material ESP.
ln conclusion. some of the major points of the problem itsel f worth noticing are: Subjectivity;
Problem is non linear and presents stiffening;
Composite materiais are used because of their properties. and Design concept follows three phases.
Acknowledgments
The authors extend lhei r gratitude to EMBRAER for manufacturing the prototype. to Ortopedia Hannover for their support throughout the research. to CT A/lA E/ AMR for their help in conducting laboratory tests and to IBM Brasil for providing lhe computer resources used in this work.
References
Ataranta, H., et ai., 1994, "Subjective Benefit of Energy Storing J>rosthesis". Joumal of Prosthetic and Orthotics. Vol. 2. pp. 92-97
Barr. A. E., et ai., 1992 "Biomechanical Comparison ofthe Energy-Storing Capabilities of Sach and Carbon Copy 11 Prostbetic Feet During the Stance J>hase of Gait in a Person with Below-Knee Amputation", Physical Therapy, Vai. 72. pp. 344-354.
Colborne, C. R .. 1992, "Analysis of Mechanical and Metabolical Factors in the Gait of Below Knee Amputees". Arnerican Journal of Physical and Medical Rehabilitation, Vol. 71, pp. 272-278.
Dieter. G. E .. 1991, "Engineering Oesign, a Material and Processing Approacb", McGraw-Hill, lnc., New York. Gailey, R. S., et ai., 1994. "Energy Expenditure of Trans-Tibial Amputees during AmbulatiOil at Self-Selected
Pace",Joumal ofProsthetics and Orthotics. Vol. 2, pp. 84-91 .
Grundy, M .. et ai., 1975, "An lnvcstigation ofthe Centres ofPressure Under the Foot White Walking". The Joumal OfBone and Joint Surgery, Vol. 57-B, pp. 98-103.
RBCM • J. of the Braz. Soe. Mechanlcal Se Iene . . Vol XVIII· n•1 • 1996 • pp. 8-16
ISSN 0100· 7386 Prlnted in Brazil
Dynamic Response of a Damped Cable With a
Compliant Damped Support System
Elias Blttencourt Teodoro
Universidade Federal de Uberlândia Departamento de
38400-206 Uberlândla, MG Brasil
Kenneth G. McConnell
Iowa state Unlversity • USA 50011 ·Ames. LA
Abstract
Power I ines are subject to complex aerodynamic forces lhat may cause galloping. Then a malhc:matical model
was developed in which the conductor is represented by a taut string and the insulator support is modeled as a mass, spring, and dampcr. A technique called model modífication was employed to study this model. A compu ter program was written to sirnulate the behavior of the cable under certai o boundary condítions while different typcs o f excttations are appJjed to Lhe cable. Tlle mode-summation melhod was successfully applied to this class of problem and thc advanced model analysis indicated that energy absorber device reduced cable motion while reducing lhe forces transmiued to lhe supporting tower.
Ktywords: Damped Cable. Support Systems, Mode • Summation Mc:tbod
lntroduction
The stttdy of cable dynamics is a classical problem, and the analysis of oscillations of a cable h as been of interesl for many decades. Currently, wind-excited oscillations of overhead line continue to cause serious wear in cables and lheir struclures.
A wide range of problems and applicalions are encoumered in the literature; this literature, however, varies greatly in 1erms of simplifying assumptions and solulion techniques. The simplest problem, of course, is the vibrating string problcm wilh its attendanl assumplions of constant cable lension and small deflection. Other solutions are available for certain restricted classes ofthe nonlinear equat ions of motion for large deflections of an elastic string.
The vibration modes and natural frequencies of a string, inextensible cable have been analy zed by Goodey (I 96 1 ). Pusgley ( 1949), and Saxon and Caim ( I 953). Domi nguez ( 1972) used an inextensible discrele system approach to formulate the initial value problem, which is solved by using Laplace transform s. Co wper et ai.( 1973), ln·ine( 1974). Soler( 1970), and .West et ai.( I 975) determined the natural frequeneies from the equations of mo1ion for small oscillations of a shallow catenary.
The galloping phenomenon is highly complex because of thc nonlinear. geometry-dependent, timc:-varying aerodynamic loads and lhe res ulting amplitudes of vibration, which may cause interaclions belween various vibral ion modes and also between adjacenl spans and their support hardware. To establish the basic mechanism of cable galloping, researchers have presented theories that try to explain the galloping phenomenon. At least two mechanjsms have bccn introduced: the Den Hartog thcory and lhe torsional theory. The Den Hartog theory argues that instabi lity occurs when the absolute value of the negative slope section of lhe lift coefficient is larger than the drag coefficient.
Nigol and Buchan(I98 J) h ave done un extensive study conccrning lhe vibrati on of a model transmission line in a simulated environment. They conclude that Den Hartog mechanism is not lhe cause of galloping. Their opinion is lhat galloping is caused largely by a self-excited torsional mechanism . The torsional lheory suggests that galloping is caused by wind-induced torsional oscillations of thc iced conduclor that generate vertical oscillatory aerodynamic forces.
McConnell and Zemke( 1980) have sludied thc coupled axial-torsional properties of ACSR electric conductors and Saznras et al. ( 1974) have studied lhe coupling effect of underwater cables; both groups oblained si milar results on the lorsional-exlensional properties. Samras et ai. ( I 974) based lhe ir analysis on a linear model that is rather limited in ils applications. because a nonlinear system such as
Dynamic Response of a Damped Cable wíth a CompUant Damped Support System 9
a catenary can behave quite differently than a linear system. However, the coupling effect developed separately by these two groups suggests that axial-torsional coupling may provide a tentative explanation for the torsional mechanism that appears to control galloping.
lt was concluded by Myerscough( 1973) that a conductor appears to settle ultimately into an oscillation panem dominated by one particular harmonic or mode shape. Since the vertical motion is most dominant during galloping motion, we concentrated our attention on developing a malhematical model that includes only the first few mode shapes. This model should provide guidance in designing an energy absorber lhat will reduce both the magnitude of galloping and lhe peak impact loads that can occur at lhe support structure.
The Mathematical Model
A mathematical model was developed in which the conductor is represented by a taut string and the insulator support is rnodeled as a mass. spring, and damper. A schematic of a cable system is shown in Fig. I. A technique called modal modification was employed to study this model. The advantage of lhis technique is that once the compu ter model is working witb the taut string, it is a rather simple matter lO implement a multispan catenary model. A computer program was written lO
simulate the behavior oflhe cable under certain boundary condition while differenltypes of excitations are applied to the cable.
Support
{
p, T
Fig. 1 A Taut Damped Cabia wlth Mass-Spring Support at x • d
First we consider a differential element of a taut cable under tension T where density per unit length is considered constant. The cable is assumed to be like a string and offers no resistance to bending moments. lt is further assumed tbat the string performs a small transverse motion in a vertical plane. The deflection slope at every point ofthe string are small in absolute value so that any variation in the tension due to lhe displacemem of lhe string is negügible. From these assumptions the ffee-body diagram of a portion of lhe detlected string, the externa I loads of Fs(x,t), E(x,t) are applied. Real cahle systems are influenced by a gravitational field g and a distributed damping along the string c fNs/m2
1.
the resulting differential equation of motion in the vertical direction in given by
2 2
êJy(x,t) êJy(x,t). . (1y{x,t)
T
ai
- cax
-F5(x,t) + E(x,t)-pg = pat
2 (I)where E(x,t) is lhe excitation load per unit of length, and is defined as the sum of three terms, each of them participating on the modal sum as lhe model requires. These three terms include one distributed excitation force per unit length acting on the left span, one distributed excitation force per unit lenglh acting on the right span, and one excitation point force acting on the cable. The acceleration of gravity dueto lhe earth is g [rnlsl]. The fÓrce at lhe damped support is define as
[
2 ]
a
y (x, t) êJy (x, t)F5(x,t) = M5 2 +Cs
ax
+K5y(x,t)ax
X = d10 E. B. Teodoro and K. G. McConnell
where M5 (kg] is the mass at the support.. C5 [N sim} is the damping at the support, and Ks [N/m) is
the stiffness at the support
The inclusion of damping considerably increases the difficulty of solving the differential equation of mouon for the combined cable-support system. We wish to express the position of a point on the cable in tenns ofthe mode shape and natural frequencies determined from an undamped system.
Using the separation ofvariables approach, we can write y (x,t) as the product oftwo functions X (x) which depends only space variable x, and Q(t) whicb depends only on the time variable t. A taut cable system modcl is altered by the addition of a mass and at the central support.. which is referred to as a constrained structure.
The mode-summation method applied to a constrained structure will have the geometric coordinate vector {y (x,t)}, which is the product of the mode shape matrix [X(x)J and the generalized modal coordinate vector {Q (t)}.
The final solution for the position of the cable with time is given by a summation of the products of ali eigenfunction solutions and ali time-based functions. By using the constrained-structure approach. we can write our problem in matrix notation so that the position (y(x,t)} for eacb selected point along the span as a function of time variable becomes
(3)
whcrc Np is the number of eigenvalues (À.Np) comp uted using formulations defined by Teodoro{ 1994), where we find the necessary equations to compute Lhe real roots. Nx is the number of subintervals in the span of length L.
Based on the matrix notation, and after rearranging tenns Eqs. (I) can be rewritten as thc etgenproblcm
(M) {Q(t)} +[C] {Q(t)} + [KJ {Q(t)} = {R(t)} (4)
where the dots indicate differentiation with respect to time, and the mass. damping, and stiffness matrices are defined by
(5)
(6)
[K[ = p[X(x)]T[X(x)[ [A] +K
5[X(x)]T[X(d)] (7)
whcre fX(d)] is a matrix with displaccment of the support position only, and [A] is a diagonal matrix containing lhe real roots squared. The modal excitation force on the right-hand side of Equation (4) is given by
T T
{R(t)}
=
[X(x)] {E(x,t)} - fX(x)] {pg} (8)Dynamic Response of a Oamped Cable with a Compliant Damped Support System 11
After some algebraic work we obtain lhe final solution for lhe generalized coordinate (time·based function). There will be three tenns on this solution: the mode participation of load for each mode, the catenary shape ofthe cabie dueto the gravitational field, and the transient response which will die out due to the exponentiai decay caused by the system damping. Therefore, in order to investigate the effects ofthe inclusion of damping on the cable system, we consider oniy lhe mode participation tenn which is given by
l {
~
(t)}l
{ Q (I)}
lUJ
[diagCn~eJ]
ruJ
-1
fhE<t>}
(9)
where
P
= -I and i = I •... , Np. {h E} is a vector dependent on the excitat ion load.Transient Response When Left Span is Excited by a Point Load at the
Midpoint
ln the field, the actual power tines were excited manually by pulling on the cable near its midpoint in concert with the cable's response. This excitation process was simulated. This was accomplished by applying a point load at the midpoi!ll of tbe left span (at x=&2). this load had an excitation frequency equal to the natural frequency of the left span.
The initial conditions assumed were a displacement in the catenary shape and zero velocity. The point Ioad was applied untii a steady state of motion occurred. New initial conditions were obtained when the velocity had a maximum amplitude at the midpoint of the left span. The excitation force was set equal to zero at this time. and a transient solution was impiemented with thc new initial conditions of displacement and maximum velocity amplitude.
The computer program implementcd the mathematical models described by Eq. 3, and Eq. 9. This program was used to calculate the responses at three selected locations: the midpoi nt of the left span (x=d/2), the central support (x=d), the middle of the right span fx=d+(L-<1)12]. The force transmitted to the structure at the central support (x=d) was also calcuiatcd. These calcuiations were done for the physical parameters given in Table I and Table 2. These tables also show the types of natu ral frequency. the natural frequencies, and the modal damping.
Table 1 Damped Cable with Support and 8 oth Ends Fixed - Natural Frequency and Damping Ratio
-r
5=
7.0Index
1 2
3
4
5
6
p = 1.302kg/m L = 404. 174m T = 16, I61.13N
çc
=
0.200çs
= 0.080v = 0.5 10 lls
= 0.200
ro5 = 0.259HzType Frequency [Hz]
support 0.242
left 0.275
right 0.301
left 0.542
right 0.564
left 0.81 1
Damping Ratio [%]
0.5399 0.7498 0.4929 0.3880 0 .3719
12 E B Teodoro and K. G McConnell
Table 2 Damped Cable with Support and both Ends Fixed- Natural Frequency and Damping Ratio t5
=
200.0p l.302 kg/ m L = 404.774m
T = 16, 161.13N
çc "'
0.200çs
= 0. 080 v = 0.5 10lls
= 0.200ros = !.385H z
Index Type Frequency (Hz] Damping Ratio
(%)
1 left 0.270 0 .7819 2 right 0 .281 0.7510 3 left 0 .541 0.3911 4 right 0 .563 0.3757 5 left 0.810 0 .2610 6 right 0 .884 0 .2509
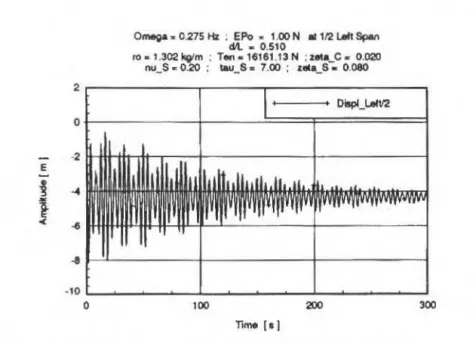
A point load exci tation of EP0 = I.ON was app lied to the model at the midpoi nt of the left span
(x = d/ 2) for a numencal simulation with an excitatio n frequency
n
= I. (275) 11 7., wh ich corrcsponds to lhe second cable system natural frequency ( first natura l frequency of the lcft-sidc span). The amp lit ude ol mot io n at the mi d potnt of the left -side span ts shown in Fi g. 2 . The corresponding displacement at the su pport poi nt IS show in Fi g. 3 where the presence of an exponcntial dccay and bealing are evidcnl. An exponenti al decay is presem. As the higher frequency tran s i e nl ~ die out. and the cable rcachcs a steady state d ecay mo tion controlled by lh e fundamental frequ ency in approxímate ly 300 scconds.2
o
·2 E
-i
...
....
l
< -6
-3
-10
o
Omega " 0.275 Hl : EPo • 1.00 N .t 112 IAft SpAn
~- 0.510
ro • 1.3021f91m : Ten•16161 .13N : zeta_c . 0.020 nu_S. 0.20 : tau_S • 7.00 : ~eta _ S. 0.080
100
'Tlme [ • I
300
Oynamic Response of a Damped Cable With a Compliant Damped Support System
0n-oa • 0.275 Hz ; EPo • 1.00 N III 112Ltlll &p.n cill - 0.510
ro. 1.302 kglm ; Ten. 1614US N ; uta..C. 0.020
nu_s.
0.20 ; ~a~~ _ s. 1.00 ; u~a..s .o.oeo
2r---~~----~---,
E O
i •
1·3 ~----~--._~~----~--._~--~--._--~~
o 100 200 300
nm. !•I
Fig. 3 Olsplacement at the Support Polnt-
ts •
7.0 - Flxec:t Ends13
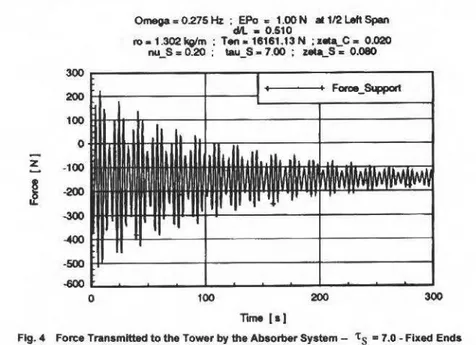
The force transmitted to the support towe.r is dependent on the support motion, the support-spring eonstant. the support damping, and lhe support velocity. The resulting force is shown in Fig. 4.
300
200
100
o
z
-100l
-200-300
~
-500
~
o
<>meg.. 0.275 ~ ; EPo • 1.00 N at 11'2 L.eft Span
cfll - 0.510
toa1.302kglm; T«ta1S1CS1 .13N ;Jt.ca....Ca 0.020 nu_S
=
0.20 ; tau_S- 7.00 ; z.ca....s.o.oeo
----+
Force_&.wart100 200
Tlrne
I• I
300
Fig. 4 Force Tran.mltted to the To-r by the Absoro.r SystBm- 't
s •
7.0 • Flxec:t Ends14 E. B. Teodoro and K. O. McConnell
The displacement at the midpoint of the left-side span is shown in Fig. 5, where the exponential
decay anda slight beating can be seen. With the amplitude of motion stabilizing around -3 .75 in contrast to the amplitude of around -4.75 shown in Fig. 2. when the spring-support ratio was smaller.
2
o
·2 E
~
--4-J
~.a
· 10
o
Omega • 0.270 Hz : EPo • 1.00 N at 112 LA1t Splon di\. • 0 .510
roa1.302kg/m: Ten-18161 .13N :uta_C• 0.020 nu_S • 0.20 ; tau_S • 200.00 ; zeta_S • 0.080
100 200
Time fsl
300
Fig. 5 Dlaplacement at Mldpolnt ofthe Left-Slde Span x
=
d/2 -- 'ts • 200.0- Flxed EndsThe displacement at the support point is shown in Fig 6. where the presence of the beating is significant. This beating is caused by the small difference between the fundamental frequency of each lcft and right span. Omega,. 0 .270 Hz ; EPo " 1.00 N at 112 Lelt Sj:)an
e
i
...
f
0.05
0.00
-0.05
-0.10
-0.15
-0.20
-0.25
o
dll. • 0.510
10 • 1.302 kglm ; T8f'l• 16161 .13 N ; zata C= 0.020
nu_S" 0.20 : tau_$ .. 200.00 ; zeta_S' • 0.080
Dispi_Support
100 200
Time la)
Fig. 6 Diaplacement at the Support Point -- 'ts • 200.0 - Flx&d Enda
300
The force transmiUed to the tower structure is shown in Fig. 7. where the average of the force magnitude has increased by a factor of 5 when compared to the force shown in Fig. 4. Although the
displacement at the support has its average amplitude reduced by a factor of 5, the large value ofthe
Dynamic Response of a Oamped Cable with a Compliant Oamped Support System 15
Conclusions
Introducing the compliant support into the cable system showed that is possible to reduce the cable motion uring the galloping phenomena.
The advanced model analysis indicated that energy absorber device reduced cable motion while reducing the forces transmitted to the supporting tower.
.103 0.5
0.0
z -O.S
~
...
-1.0-1.5
-2.0
o
Omega,. 0270 Hz : EPo • 1.00 N at 112 L.elt Span
diL • 0.510
roa 1.302kg/m ; Ten-16161.13N ;.teta
c.
0.020nu_s.o.20; tau_s.
200.00; zec~S-o.oeo
100 200
Tme 1•1
300
Fig. 7 Force Transmltted to the Tower by the Absorber System ••
ts
=
200.0 • Flxed EndsThe mode-summation method was successfully applied to this class ofproblem. and the sarne type of behavíor was observed from experimental measurements, using a prototype energy absorber installed in a 161kV near Jefferson-IA which supports the concept that energy absorber can íntroduce at least twice the apparent damping seen in tbe original system.
References
Cowper, G. R., Hrudey, T. M., and Lindberg, G. M., 1973, "The Oscillations of a Shallow Elastic Catenary", Nat Res. Counc. Can. Tech. Rep. LTR-ST-657.
Dominguez, R. F., and Smith, C. E .. 1972, "Dynamic Analysis ofCable Systems•, J. Struct. Div. ASCE 98 (ST8), pp. 1817-1834.
Goodey, W. J ., 1961 , "On the Natural Modes and Frequencies of Suspended Chain", Q. J. Mech. Appl. Math. XIV (1), 118-127.
lrvine, H. M., and Caughey, T. K .. 1974, "The Linear Theory of Free Vibration of a Suspended Cable", Proc. R. Soe. London. A341 , pp. 299-31 S.
McConnell , K. G ., and Zemke, W. P., 1980, "The Measurement ofFiexural Stiffness ofMultistranded Electrical Conductors White under Tension" . Exp. Mech. June, 20 pp. 198-204
Moler, C. B., and Stewart, G. W. , 1973. "An Algorithm for Generalized Matrix Eigenvalue Problems", S IAM Joumal Numer. Anal. April, lO (2), pp. 241-256.
Myerscough, C. J., 1973, "A Simple Model ofGrowth ofWind-lnduced Oscillations in Overhead Lines". J. Sound Vib. 28(4), pp. 699-713.
Nigol, O .• and Buchan, P. G ., 1981, "Conductor Galloping - PartI, Den Hartog Mechanism", IEEE Trans. Power Appar. and Systems, 100(2), February , pp.708· 720.
Nigol, 0 ., and Buchan, P. G .. 1981 , "Conductor Galloping- Part 2, Torsional Machanism" , IEEE Trans. Appar. and Systems, 100(2), February, pp. 708-720.
Pugsley, A. G., 1949, "On Natural Frequencies of Suspension Chains", Q. J. Mech. Appl. Math . v II (4), pp. 414-418.
16 E. B. Teodoro and K. G. McConnell
Saxon. O. S .. and Cahn, A. S., 1953, "Modes ofvibraLion of a suspended chain", Q. J. Mech. Appl. Malh. VI (3), 273-285.
Soler, /\. 1.. 1970. "Dynamic Responses of Single Cables wilh [nitial sag", J . Franklin lnst. 290 (4), October, pp. 377-387
Teodoro . E. B. , 1994. Dynamics of a Power line when Supported by a Compliant Energy Absorber". Ph.D. Dissertation, Iowa State University, Ames.
RBCM -J. of tha B111L Soe. Mechanlcal Se lances Vol. XVIII- n•1 - 1996 • pp. 17-23
ISSN 0100-7386 Printed ln Brazil
A Data Compression Method for the Modal
Analysis of Spatially Dense Laser Vibrometer
Measurements
José Roberto de França Arruda
Universidade Estadual de Campinas Faculdade de Engenharia Mecanlca 13083-970 Campinas, SP Brazll
Lulz Antônio S. B. Santos
Universidade Estadual de Campinas Faculdade de Engenharia Elétrlca 13083-970 Campinas. SP Brazil
Abstract
This paper ínvestigates a method which can be used to compress two-dimensional velocity fields measured with
the scanning LDV . The compressed data can be used as virtual measurements when estimating modal
parameters. The data is compressed spatially using a two-dimensional Fourier series model. The approx.imation reduces and filters the measured data in the output space for each frequency line.
Keywords: Data Compression, Modal Analysis, LDV
lntroduction
ln modal tests using traditional transducers, the number of degrees of freedom measured on the structure under test usually ranges from tens to a few hundreds. Multiple Input I Multiple Output (MIMO) phase separation modal pararneter estrrnation (MPE) algorithms (see, for instance, AJlemang and Brown, 1987), such as lhe Least Squares Complex Exponential Method, the Eigensystem Realizatíon AJgorithm, and the Polyreference Orthogonal Polynomial Method, are commonly used to estimate the modal parameters from measured Frequency Response Functions (FRFs).
However, when spatially dense measurements are obtained with modem scanning Laser Doppler Vibrometers (LDVs), it is often irnpractical to use phase separation MPE methods dueto the excessive arnount of data (Sun et al., 1993). When the damping is smaiJ and the modes are well separated in the frequency domain, phase resonance tests or specially adapted frequency domain methods can be used (Arruda, 1993). Otherwise, sorne sort of condensation of the measured data is necessary to permit the use of the MIMO phase separation methods cited above.
As the number ofmodes interest is usually mucb srnaller then the number ofmeasured outputs, it is desirable to reduce the arnount of spatial redundancy before the MPE algorithrns are applied. The spatial condensation ofrneasured data for modal analysis is a relatively new issue, which is becoming more relevant as the number of transducers used in modal testing increases and optical measurement techniques become more popular. Dippery et ai. (1994) have proposed the linear combinatioo of measured output into a smaller number of effective or virtual measurement stations. A constant, rectangular transformation matrix is used to condense the measured FRFs, organized in matrix form. This matrix is formed by juxtaposing the (N0 x N;) frequency response matrices measured at each frequency line, where N0 is the number of outputs and N; the number of inputs. The juxtapositioo can be done either columnwise, yielding a matrix (N0 x N1N.), or rowwise, yielding a matrix (N0N, x N;).
where N, is the number of frequency lines. The transformation matrix is then obtained by the singular v alue decomposition (SVD) of this large matrix. lt is simply the transpose of the U rnatrix of the SVD, truncated so that the first N. singular vectors, associated with the most significant singular values, are retained.
The shortcomings of this condensation method are the computation effort involved in solving a large SVD problem and the fact that the estimation of the eigenvectors is still performed in the measurement space. Taking an example case, wbere 10,000 locations are measured (which is small in tenns of the capability of a state-of-the-art LDV} at 400 frequency I ines with 3 input references, the
18 J. R. F. Arruda and L. A. S. 8 . Santos
matrix to be deco mposed would be a complex, non-symmetric 10,000xl.200 matrix. Furthermore. the linear system of equations which musl be solved in order to estimate the mode shape coefficients must
he applied to I 0,000 second members. i. e .. a total of I O,OOOx I .200xN,. complcx multiplications, where Nm is the number of estimated modes .
Therefore, the SVD-based condcnsation techniques are not suitable for spatially dense LDV measurcmcnts. This paper investigates an alternative method, which consists of approximating the data spatially using a two-dimensional Fourier series model referred to as the Regrcssivc Discretc Fourier Series (RDFS) model (Arruda, 1992). lt was shown (Arruda. 1992) that this techniques is applicable to both equally and non-equally spaced two-dimensional velocity fields measured with the scanning LDV. The approximation reduces and filtcrs the measured data in the output space for each frequency line, thus generating a reduced set of data, which can also be interpreted as virtual measurements. The MP E procedure. both the eigenvalue and the c igenvector estimation. is performcd upon the spatially reduced data The expanded mode shapes can bc reconstructed whenever necessary using the inverse RDFS.
To tlluStrate the proposed method , a set of FRFs was synthesized using spatially dense mode shapes measurcd with a scanning LDV using a phase resonance test. ln this way, the exacl modal parameters are known, and the method ca n bc evaluated. A Polyreference Chebycheff Polynomial MPE me thod (Vold. 1990) was implemented and used to estimate the modal parameters from the condcnsed virtual measurements.
Spatial Domain Compression Using the RDFS
Thc data compress10n in the spatial domain can be done us ing a two-dimensional Fourier series. which takes ndvantage of the sinusoidal pattern of the mobility shapes of the structural surfaces sufliciently far from the boundaries. This is a well-known property of the wave equation solution for solids when th e near-field effects are neglected.
For two-<limensional mobility shapes (Operational Defleetion Shapes) mapped over a rectangular grid. say Hmn• one could think of using the two-dimensional Discrete Fourier Transform (DFT). The difficulty with using the DFT is that its implicit periodization introduces high-frequency components that account for the sharp edges present in the wrapped-around data. This phenomenon is known as lcakage. ln the data smoothing process, leakage is prejudicial, as it causes distortion of the low-pass liltercd data. The usual way to reduce Jcakage is windowing, but this tecbnique is not suitable in the case of finite length. spatial domain data. To overcome lhe leakage problem, the proposed technique consists of representing the data by a two-d imensional regressive discrele Fouricr series (RDFS) proposed by Arruda ( 1992). which will be briefly reviewed here. Unlike the DFT. in the RDFS the original length of the data is not assumed to be equal to the signal period nor is the number of frequency tines assumed to be equal to the number of data points. With the two-dimensional, equally-spaccd RDFS model, the mobility shape H,.n is expressed as:
p q
L L
zk,
WMkw
:S
(I)k • pi & -q
;m = O, ... , M- I; n = O .... , N-I;
where "'"" r epresents lhe discreti ze d data wíth constant spatial re so lutions 6x and 6y ,
WM = exp ( i27t/M). W N = exp ( i27t / N ) . and Emn accounls for the no i se and higher frequency content:; of I/. No te that M '1:. M and N '1:. N . The length of lhe data in x is M l!.x , but the period of the RDFS is M6x > Mllx . The data reduction is achi eved because p << M dueto thc cxpected low ware numher of the mobility shape surface. ln the y direction N6x > N l!.x and q << N. The M x N data in
H are represcnted by a (2p+ I) x (2q+ I) complex matrix Z of elements Zk!.
A Data Compression Method for the Modal Anatysis of ... 19
(2)
The least-squares solution is given by:
-I
Z = ( WHW ) WH HW.H (W WH) - 1
M M M N N N
(3)
where the matrices to be inverted have a very small size, (2p+l) x (2p+l) and (2q+l) x (2q+l), respectively, and H denotes the matrix complex conjugate. The smoothed data Jl(s) may be obtained from:
(4)
where WM and WN can be caJculated for the desired spatial resolution. The reduction ofthe data is
achieved as Z represents the data using only (2p+ I )(2q+ I) vaJues, instead of the original MN values. The formulation ofthe RDFS for non-equaJiy spaced data given by Arruda (1992) can be used in the place of the formulation above when the mobility shapes are mapped o ver a non-regular, arbitrary grid.
Chebycheff Polynomial MPE Method
The Orthogonal Chebycheffpolynomials MPE method (Vold, 1990) is applied to the compressed FRFs in matrices
z (
co). Therefore, instead of curve-fitting the large number of FRFs directly, the RDFS coefficients, taken as virtual measurement stations, are curve-fitted.The RDFS coefficients are in fact linear combinations of the FRFs (see Eq. ( 1). Hence, the RDFS coefficients as a function ofthe frequency will have the samç potes as the original FRFs. This allows us to write:
L
k
=o
0k~k
(iro)z (
(l)) =-L~=
obk~k
(iro)(5)
where $k is the kth Chebycheff polynomial, llt. is the kth polynomial matrix coefficient ( of the sarne dimensions as Z), bk is the km denominator polynomial matrix coefficient, which is a scalar for single excitation, and i =
.}-i .
Ma.king, without loss of generaJity, b, =I one can write:s-I r
L
Z(ro)Hcj>*bH-L
$*JaH = -4>* Z(ro)H (6)k eO k k k •O k k s
where I is the identity matrix and • denotes the complex conjugate of a scalar. Arranging Eq. (6) in matrix form for ro varying produces a linear system of equations which constitutes a least-squares problem, and can be easily solved for ak and bk.
rt is important to mention that the frequency ro should be scaled so that the frequency range is always [O, I]. This improves the condition of lhe least squares problem.
Vold ( 1990) proposed that, instead of computing the corresponding power series polynomial coefficients to forro the companion matrix,
one
couJd form a companion matrix problem in the orthogonal polynomial basis. The modified companion matrix can be formed by combining the characteristic equation, which in the case of multiple references is:[ ±
[bkHk(iro)] {JI} = {O} (7)20 J . R. F. Arruda and L. A . S. B. Santos
with the formula to generate the orthogonal Chebycheff polynomials:
(8)
Solving the combined eigensystem of equations formed in the usual way, a companion matrix is formed, and the eigenvalues S~ r= I. ... , nN;
***•
are obtained. The first N; elements ofthe eígenvectorsV, are the modal participation vectors L, of the partia! fraction expression of Z (
w ):
(9)
where N
=
nN; and { cpr} are the mode shapes. lt should be noted that the eigenvectors and the modal partictpation vectors are in the compressed RDFS space.Once the modal participation vectors and the eigenvalues are known, computing the eigenvectors is straightforward. Equation (9) can be rearranged for each element (o) of matrix Z ( w) to yield:
(10)
where:
where m is the number of frequency tines.
Solving the linear system of equations in Eq. (lO) for each elements of matrix Z ( w) yields the mode shapes in the compressed RDFS space. The mode shapes in the measurement space can be computed with
Eq.
(4).Results
A prototype software was developed to verit)r the proposed formulation. The algorithm may be summarizcd as follows:
I. Apply a robust data smoothing technique to eliminate outlicrs from measured mobility shapes. 2. Apply the RDFS to each mobility shape.
A Data Compression Method for the Modal Analysis of ... 21
4 . Obtain the polynomial coefficienl matrices ak and bb which forrt:J the reduced model.
5. Build a companion matrix with the computed polynomial coe fficients and extract the eigenvalues and eingenvectors of the structure.
6. Expand the mode shapes whenever necessary with the inverse RDFS .
ln order to illustrate lhe use of the proposed space-frequency data compression method, a hybrid numerical-experimental simulation of a free-free-free-free rectangular alu minum plate was used. The plate, which is 425.45x457.20x3.17 mm , was hung from tiny holes in its comers using fish lines and was excited sinusoidaly using a shaker. The response was measured with a scanning LDV. The phase resonance condition was sought for each mode by varying the excitation frequency and observing lhe phase between the excitation signal and the measured velocities. The natural frequencies and mode shapes ofthe first l O modes were measured using the methodology described by Sun et ai. (1993). The mobility shapes were numerically simulatcd using the formulation of the FRfs for a proportionally-damped structure:
~
'l';r'VjrHij ( ro} = k.. ro2- ro2 + i2Çroro'
r= 1 r r
( 11)
where IP;r is the
i'"
element ofthe rth mode shape vector. The excitation station was kept constant at one of the plate corners. j = l, while the mcasurement stations varied. i= I , MN. The sarne modal damping factor Ç=
0.01 was used for ali the modes. For each frequency ro, the elements of the vector H;r l : i= I, MN, where arranged in matrix form following lhe mapping which was used when measuring the mode shapes with the LDV. thus producing a mobility shape Hmn; m=O, M-1; n=O, N- 1.The simulated FRfs are unscaled; each mode shape was normalized to unitary amplitude.
The proposed methodology was used to estimate the
5
modes in the frequency range 200-300 Hz (modes 6-1 0) u sing a I Hz frequency resolution. Table I shows the estimated undamped natural frequencies and modal damping coefficients compared to the exact values. ln this noise-free case the result is, as expected, nearly exact. The data compression using the RDFS did not introduce any noticeable error. Table I also shows lhe correlation coefficients, known as Modal Assurance Criterion (MAC), between the estimated mode shapes and the exact mode shapes. Again the results a re very good. lt should be noted that the estimated mode shapes representa smoothed version of the modes used in the simulation, which are contaminated with measurement noise. Figure I shows a graphical comparison of exact and estimated mode shapes.Table 1 Modal Parameter Estimation Results
mode natural freq. [Hz] damping coef [%]
MAC
exact estimated exact estimated
6 211.500 211.682 0.99 0,9996
7 237. 180 237.244 0.99 0.9998
8 245.670 245.724 0.99 0.9991
9 249.770 299.820 0.99 0.9982
10 290.550 290.582 0.99 0.9989
Conclusions
22 J . R F Arruda and L A. S. B. Santos
(a) (I)
lg)
t c l (h)
ld) (i)
fel (j)
Fig. 1 Comparlson of Exact and Estlmated Moda Shape (6 -10). (a. e) Exact Modes; (f·J) Eatlmated Modes
A modified Chebycheffo rthogonal pol ynom ial polyreference melh<ld prop0sed by Vold (1990) was used. The method is particularly suítable for this application because it estimates parameters in the frequency domai n with arbitrary frequency spacing, wbich is frequently the case with LDV measurements. The frequency I ines where thc mobility operating shapes are measured can be chosen in lhe neighborhood ofthe resonances, where lhe measurements are richer in terms ofmodal information. The method is applied to spatially compressed data. thus saving computation etfort and memory space. The results can be stored in the compressed format. and expanded whenever necessary.
A O ata Compression Method for the Modal Analysis of ... 23
Acknowledgments
The authors are thankful to Professor Larry D. Mitchell and to Mr. William X. Li from Virgínia Polytechnic lnstitute and State University fo r providing us with the experimen tal data used in this paper. We also thank the National Science Foundation (USA) and the Conselho Nacional de Desenvolvimento Científico e Tecnológico (Brazil) for the funding of the technical cooperation agreement between UNICAMP and VPI&SU.
References
Allemang, R. J., and Brown, O. L.. 1987, "Modal Pararneter Estimation," in: Experimental Modal Analysis and Oynamic Component Synthesis, AFW AL-TR-87-3069, Vol. III, A ir Force Wright Aeronautical Labs., Ohio, USA.
Arruda, J . R. F .. 1992, "Surface Smoothing and Partia! Spatial Derivatives Computation Using a Regressive Discrete Fourier Series," Mechanical Systems and Signal Processing, Vol. 6, No. I, pp. 41-50.
Arruda, J. R. F .• l993, "Spatial Domain Modal Analysis ofLightly-Oamped Structures Using Laser Velocimeters," Journal ofVibration and Acoustics, Vol. 115, No. 3, pp. 225-231.
Arruda. J. R. F .. Rio, S . A. V., and Santos. L. A. 8 ., "A Space-Frequency Data Compression Method for Spatially Oense Laser Doppler Vibrometer Measurements. • Shock and Vibration, to appear.
Oippery. K. 0. , Phillips, A. W., and Allemang, R. J ., 1994, "Condensation of the Spatial Domain in Modal Parameter Estimation," Proc. ofthe 12th l nt Modal Analysis Conference, Honolulu, Hawaii, USA., January 31 • February 3, pp. 818-824.
Sun, F ., Mitchell , L. 0. , and Arruda, J. R. F., 1993, "Mode Oecoupliog Consideratioos in Mode Shape Measurements of a Plate With Monoexcitation and Laser Ooppler Vibrometer." Experimental Tecbniques," Vol. 17, No. 4, pp. 31-37.
RBCM -J . ol the Braz. SOe. Mec::hanlcal Sciences
Vol XVIII- n•t • 1996 - pp. 24-32 ISSN 0100-7386 Printed in Brazil
Estudo do Recalque Isotérmico de Anéis e
Cilindros Pelo Método dos Elementos Finitos
Cylinders and Rings Hot Upset Forging Ana/ysis by the
Finite - Element Method
Evandro Cardozo da Silva Sérgio Tonlni Button
Universidade Estadual de Campinas Faculdade de Engenharia Mecânica Departamento de Engenharia de Materiais 13083-970 Campinas. SP Brasil
Abstract
The state of the art in forging points to precision forging. The modem competi tive forging industry uses computational systems to plan it. instead ofthe conventional trial and error methods. Based on this tecnology, this work develop a bidimensional fmite element mathematical model of rigid-viscoplastic analysis of cylinders and rings hot upsetting, and the code validated by comparing simulation with the upper bound metbod and experimental results. lbeoretical calibration curves used to define friction in the ring test were provided with simulations by the finite element method (FEMME).
Keywords: Forging, Hot Upsetting. Finite Element Method. Cylinders. Rings Resumo
O estado da arte. no forjamento, aponta para o forjamento de precisão. O seu projeto através do método tradicional de tentativa de erro cede lugar ao uso de sistemas computacionais na indústria de forjados competitiva atual. Com base nesta tecnologia é desenvolvido neste trabalho um modelo matemático bidimensional de elementos finitos de análise rigido-viscoplática para o recalque simples de cilindros e anéis, sendo o código validado por comparação da simulação com o método do limite superior e resul tados experimentais. As simulações pelo método de elementos finitos resultara nas curvas de calibração teóricas usadas na avaliação de atrito pelo teste de anel.
Palavras-chave: forjamento, Recalque Simples, Cilindros. Anéis, Método dos Elementos Finitos
Introdução
O forjamento de precisão tem por meta a produção de forjados com uma qualidade de acabamento que reduza. em parte ou integralmente. as operações secundárias de acabamento. Para atingir este objetivo o projeto de uma peça forjada exige o abandono do método tradicional de tentativa e erro (Lowe. 1988). O uso de sistemas computacionais passa a ser a ferramenta essencial para conduzir a industria de forjados a ser adaptar a novos requisitos tecnológicos para assegurar custos competitivos nos diferentes mercados.
Para o recalque simples de cilindros e anéis é desenvolvido neste trabalho um modelo matemático bidimensional de elementos finitos de análise r lgido-viscoplástica, cuja tecnologia é a base para o aprimoramento e implantação do processo de. forjan1ento de precisão.
O código do modelo matemático em linguagem FORTRAN 77 tem sua validade verificada por comparação da simulação usando elementos finitos quadrilaterais linear e quadrático com método do limite superior e resultados experimentais.
Foram verificadas as influências sobre as simulações. do emprego de materiais de importância tecnológica distintos, de fatores de atrito diversos, de várias velocidades de processo e outros parâmetros preponderantes. Sendo assumido o estado plano de deformação o modelo adotado mostrou-se adequado para análimostrou-se do recalque de cilindros e anéis fornecendo resultados compatíveis com as observações experimentais e as informações encontradas na literatura.
Usando o método de elementos finitos simulou-se a variação dos diâmetros internos de anéis com as proporções geométricas convencionais e indicadas por gráficos para vários fatores de atrito (m} na
Estudo do Recalque Isotérmico de Anéis e Cilindros pelo Método ... 25 interface peça-matriz. Este procedimento é a maneira convencional de representar curvas de calibração teóricas usadas na avaliação de atrito com o teste de anel.
Simulação do Processo de Forjamento
O modelo matemático dos processos de conformação de metais tem por objetivo fornecer informações que possibilitam o correto projeto e controle desses processos. Para tanto o método de análise deve ser capaz de determinar os efeitos de vários parâmetros sobre as características de escoamento dos materiais. Além disso, a e.ficiência computacional, tanto quanto a solução exata, é uma importante consideração para o método ser útil na análise de problemas de conformação de materiais. Sendo atualmente crescente na indústria a necessidade de códigos computacionais econômicos, fáceis e confiáveis para modelar processos de conformação. Com este cnfoque, o método de elementos finitos rígido-plástico (ou rígido-viscoplástico) tem sido o de maior sucesso na análise de uma série de problemas de conformação de metais.
O método de elementos finitos (MEF) rlgido plástico que foi desenvolvido por Lee e Kobayashi (Oh. 1982), sendo aplicado na análise de vários problemas tais como recalque de cilindro sólido, compressão de anel, extrusão e dobramento de chapas. O método tem sido também aplicado com sucesso na previsão de formação de defeitos no recalque e extrusão (Gunasekera et ai., 1982), c a medição do atrito peça-matriz. Foi estendido para material rígido-viscoplástico por Oh ( I 982) e aplicado para recalque e compressão de anel no campo de trabalho a quente, cuja formulação é descrita em trabalho anterior (Silva et ai. 1993) e encontrada detalhada na literatura (Kobayashi et ai., 1989; Zienkiewicz e Taylor. 1991 ).
Resultados Numéricos e Validação Experimental
Os resultados da simulação do método de aproximação adotado ( MEF) são comparados com os resultados experimentais do recalque de cilindros e anéis. Ensaios experimentais foram realizados no laboratório de conformação mecânica da UNICAMP (Silva, 1995) com o mesmo material simulado.
Neste trabalho. os e lementos linear e quadrático foram implementados e aplicados na análise do recalque a quente de cilindros e anéis entre matrizes planas. Os resultados numéricos do modelo de elementos finitos desenvolvido. são comparados com alguns trabalhos encontrados na literatura (Lee e Altan. 1972; Price e Alexander, 1976; e Kobayashi et ai., 1989).
Compressão de Cilindros. A deformação é não homogênea na compressão de cilindros sólidos com atrito na interface peça-matriz. Portanto a supcrflcie livre embarrila ou sofre dobramento ("folding").
A forma do barrilamento é influenciada pelas condições de atrito e pela geometria da peça. A geometria é representada pelas razões de altura por diâmetro, pequena (menor que I ,6) e grande. resultado num barrilamento simples e duplo. res pectivamente (Price e A lexander, I 976). Este fenômeno é visualizado na Fig. I pela representação gráfica da malha distorcida da simulação da compressão de tarugos de grandes razões de altura-diâmetro equivalente aos trabalhos de Kobayashi et ai., (1989).
Condições Co mputaciona is e Procedimentos. A análise do forjamento de compressão de cilindros isotérmica foi realizada para dois atritos diferentes. Os atritos usados na análise são m=0,3 (condição de lubrificação) e m=0,6 (sem lubrificação) (Oh, 1982).
26
0.0
0.5
(a)
1.0
2.5
2.0
1.5
I.
O
0.5
0.0
0.0
E C. da Silva and S. T. Button
0.5
(b)
1.0
Fig. 1 Malha Distorcida Indicando a Influência da Geometria da Peça Sobre a Forma do Barrilamento: (a} HoiOo • 1,5 e (b) Ho/Do., 2,5, para 40% de Reduçlo na Altura
Resultados e discussões. A Fig. 2 mostra wna malha MEF indefonnada usada para a análise e as malhas distorcidas calculadas com deslocamento da matriz de 0,4 Ho. A malha é construlda de 36 elementos lineares (ou 9 elementos quadráticos) o que corresponde a 49 nós. Para melhor comparação, as distorções da malha para ambos os casos de atrito sào superpostas. Como pode ser observado na Fig. 2 (b), com o processo de defonnação o barrilamento da superficie livre se forma. Ocorre o dobramento ("folding") da supertlcie lateral para a matriz superior e inferior simetricamente de forma mais acentuada para o atrito elevado. Ao longo do processo de recalque do material é grande a deformação na região central e na interface peça-matriz. como pode ser observado das distorções das malhas para o maior atrito.
Estudo do Recalque Isotérmico de Anéis e Cilindros pelo MétOdO ...
1.0
~
....
3
0.5
•
~
•
0.0
0.0
1.0
•
•
0.0
0.0
•
•
•
0.4
0.4
•
•
0.8
Raio/R o
(a)
0.8
Raio/R o
(b)
-1
1.2
1.6
--- 'l
1.2
1.6
Fig. 2 DistorçO.. da Malha para as Simula~ do MEF a Deslocamento da Matrtz de (a) 0,0 Ho e (b) 0,4 Ho. Ali Llnhaa Chelaa do para m-<1,3 e aa Llnhaa T111cejadaa pal'll m-<1,6.
Aa Unidades alo Múltiplas do Ralo lndefonnado
27