BGD
9, 9349–9423, 2012Governing processes for reactive nitrogen
compounds
O. Hertel et al.
Title Page
Abstract Introduction
Conclusions References
Tables Figures
◭ ◮
◭ ◮
Back Close
Full Screen / Esc
Printer-friendly Version Interactive Discussion
Discussion
P
a
per
|
Dis
cussion
P
a
per
|
Discussion
P
a
per
|
Discussio
n
P
a
per
Biogeosciences Discuss., 9, 9349–9423, 2012 www.biogeosciences-discuss.net/9/9349/2012/ doi:10.5194/bgd-9-9349-2012
© Author(s) 2012. CC Attribution 3.0 License.
Biogeosciences Discussions
This discussion paper is/has been under review for the journal Biogeosciences (BG). Please refer to the corresponding final paper in BG if available.
Governing processes for reactive
nitrogen compounds in the atmosphere in
relation to ecosystem, climatic and
human health impacts
O. Hertel1,2, C. A. Skjøth1,3, S. Reis4, A. Bleeker5, R. Harrison6,7, J. N. Cape4, D. Fowler4, U. Skiba4, D. Simpson8,9, T. Jickells10, M. Kulmala11,
S. Gyldenkærne1, L. L. Sørensen1, J. W. Erisman12, and M. A. Sutton4
1
Department of Environmental Science, Aarhus University, P.O. Box 358, Frederiksborgvej 399, 4000 Roskilde, Denmark
2
Department for Environmental, Social and Spatial Change (ENSPAC), Roskilde University, 4000 Roskilde, Denmark
3
Department of Physical Geography and Ecosystems Science, Lund University, S ¨olvegatan 12, 223 62 Lund, Sweden
4
Centre for Ecology & Hydrology (CEH), Bush Estate Penicuik Midlothian EH26 0QB, UK
5
Energy Research Centre of the Netherlands (ECN), Biomass, Coal & Environmental Research, P.O. Box 19, 1755 ZG Petten, The Netherlands
6
BGD
9, 9349–9423, 2012Governing processes for reactive nitrogen
compounds
O. Hertel et al.
Title Page
Abstract Introduction
Conclusions References
Tables Figures
◭ ◮
◭ ◮
Back Close
Full Screen / Esc
Printer-friendly Version Interactive Discussion
Discussion
P
a
per
|
Dis
cussion
P
a
per
|
Discussion
P
a
per
|
Discussio
n
P
a
per
|
7
Department of Environmental Sciences/Center of Excellence in Environmental Studies, King Abdulaziz University, P.O. Box 80203, Jeddah, 21589, Saudi Arabia
8
Norwegian Meteorological Institute, Henrik Mons Plass 1, 0313 Oslo, Norway
9
Department of Earth & Space Sciences, Chalmer University of Technology, 412 96 Gothenburg, Sweden
10
University of East Anglia, Norwich Research Park, Norwich, NR4 7TJ, UK
11
Department of Physics, University of Helsinki, Finland
12
Earth and Climate, VU University Amsterdam and Louis Bolk Institute, Hoofdweg 24, 3972 LA Driebergen, The Netherlands
Received: 15 July 2012 – Accepted: 16 July 2012 – Published: 27 July 2012
Correspondence to: O. Hertel ([email protected])
BGD
9, 9349–9423, 2012Governing processes for reactive nitrogen
compounds
O. Hertel et al.
Title Page
Abstract Introduction
Conclusions References
Tables Figures
◭ ◮
◭ ◮
Back Close
Full Screen / Esc
Printer-friendly Version Interactive Discussion
Discussion
P
a
per
|
Dis
cussion
P
a
per
|
Discussion
P
a
per
|
Discussio
n
P
a
per
Abstract
Reactive nitrogen (Nr) compounds have different fates in the atmosphere due to dif-ferences in governing processes of physical transport, deposition and chemical trans-formation. Nr compounds addressed here include reduced nitrogen (NHx: ammonia (NH3) and its reaction product ammonium (NH+4)), oxidized nitrogen (NOy: nitrogen 5
monoxide (NO) + nitrogen dioxide (NO2) and their reaction products) as well as or-ganic nitrogen compounds (oror-ganic N). Pollution abatement strategies need to take into account these differences in the governing processes of these compounds when assessing their impact on ecosystem services, biodiversity, human health and climate. NOx (NO+NO2) emitted from traffic affects human health in urban areas where the 10
presence of buildings increases the residence time in streets. In urban areas this leads to enhanced exposure of the population to NOx concentrations. NOx emissions have little impact on nearby ecosystems because of the small dry deposition rates of NOx. These compounds need to be converted into nitric acid (HNO3) before removal through deposition is efficient. HNO3sticks quickly to any surface and is thereby either dry de-15
posited or incorporated into aerosols as nitrate (NO−3). In contrast to NOxcompounds, NH3has potentially high impacts on ecosystems near the main agricultural sources of NH3 because of its large ground-level concentrations along with large dry deposition rates. Aerosol phase NH+4 and NO−3 contribute significantly to background PM2.5 and PM10 (mass of aerosols with a diameter of less than 2.5 and 10 µm, respectively) with 20
an impact on radiation balance as well as potentially on human health. Little is known quantitatively and qualitatively about organic N in the atmosphere, other than that it contributes a significant fraction of wet-deposited N, and is present in both gaseous and particulate forms in the atmosphere. Further studies are needed to characterize the sources, air chemistry and removal rates of organic N emissions.
BGD
9, 9349–9423, 2012Governing processes for reactive nitrogen
compounds
O. Hertel et al.
Title Page
Abstract Introduction
Conclusions References
Tables Figures
◭ ◮
◭ ◮
Back Close
Full Screen / Esc
Printer-friendly Version Interactive Discussion
Discussion
P
a
per
|
Dis
cussion
P
a
per
|
Discussion
P
a
per
|
Discussio
n
P
a
per
|
1 Introduction
Reactive nitrogen compounds (Nr) affect ecosystem health (Sutton et al., 2011), hu-man health (Aneja et al., 2009) and contribute to climate change (Butterbach-Bah et al., 2011; Erisman et al., 2011; Xu and Penner, 2012). However, the actual impact of specific emissions depends on a cascade of competing processes taking place si-5
multaneously, which transforms pollutants along multiple paths, with multiple impacts (Galloway et al., 2003). One example is the release of NH3. Strong NH3sources con-tribute to high N loads to nearby ecosystems through a fast dry deposition rate to nearby surfaces (Hertel et al., 2006). This process competes with reactions that lead to the formation of aerosol phase NH+4. The latter contributes to PM2.5and PM10(mass 10
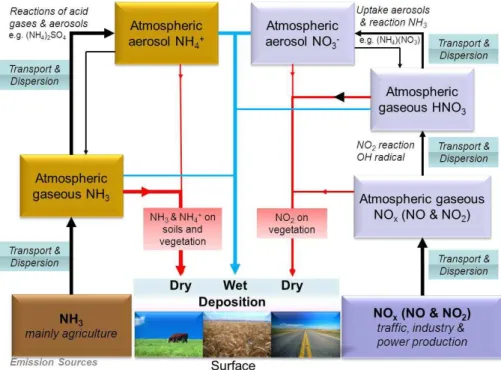
of aerosols with an aerodynamic diameter less than 2.5 and 10 µm, respectively) with much longer transport distance and with potential health effects and impact on the ra-diation balance. The NH+4-containing aerosols have low dry deposition velocities, can be transported up to 1000 km away and are mainly wet scavenged. Figure 1 provides an overview of the Nr pathways, with an emphasis on atmospheric N deposition. NH3 15
is emitted mainly from agricultural sources (Bouwman et al., 1997), and has a typi-cal atmospheric residence time of 24 h. Both NH3and gaseous NOx lead to formation of aerosol phase compounds (NH+4 and NO−3, respectively) which have atmospheric residence times of several days. Furthermore NH3 can take part in bi-directional sur-face fluxes (Sutton et al., 1995); in areas with large nitrogen (N) inputs, NH3 may be 20
released from plants and soil, and in areas with high gas-phase concentrations, de-position rates may be limited by surface saturation, and re-emission of absorbed NH3 may occur (Flechard et al., 1999; Massad et al., 2010b; Nemitz et al., 2004a; Sutton et al., 2009a, b). By comparison, the primary form in which oxidized nitrogen (NOy) is emitted is nitrogen monoxide (NO), which reacts to form nitrogen dioxide (NO2) over 25
BGD
9, 9349–9423, 2012Governing processes for reactive nitrogen
compounds
O. Hertel et al.
Title Page
Abstract Introduction
Conclusions References
Tables Figures
◭ ◮
◭ ◮
Back Close
Full Screen / Esc
Printer-friendly Version Interactive Discussion
Discussion
P
a
per
|
Dis
cussion
P
a
per
|
Discussion
P
a
per
|
Discussio
n
P
a
per
scavenging process is therefore by chemical conversion. In the case of NO2, chemical reaction with hydroxyl (OH) radical forms nitric acid (HNO3) with a typical transforma-tion rate of 5 % per hour (Hertel, 1995). HNO3 has a short atmospheric lifetime (on the order of seconds to hours), since it is quickly scavenged by uptake in aerosols, reaction with NH3 or by dry deposition (it typically sticks to any surface – aerosol as 5
well as vegetation and the ground) (Hertel et al., 2006). A US study (Day et al., 2008) found a lifetime of HNO3 of 2.5 h for a mountain area in a sunny and warm climate, but the lifetime depends strongly on the environment and another study has shown lifetimes of 7–20 min in air masses processed by clouds containing ice-crystals (von Kuhlmann and Lawrence, 2006). Uptake of HNO3into existing aerosols or formation of 10
new aerosols by reaction with NH3 leads to aerosol bound nitrate (NO−
3) as does the reaction with sea-salt (Pryor and Sorensen, 2000). Such ammonium (NH+4) and NO−3 containing aerosols are mainly scavenged by wet deposition, due to the relatively small dry deposition rate of submicron aerosols (Gallagher et al., 2002). Aerosol phase NH+4 and NO−3 may under certain circumstances – depending on humidity and temperature 15
– be released back to gas phase NH3 and HNO3. The greenhouse gas nitrous oxide (N2O) is excluded in the figure, as it has little impact on atmospheric N deposition. To maintain simplicity of the diagram, reservoir compounds (e.g. HONO, HO2NO2, PAN and PAN-like species) are also disregarded in Fig. 1, although these are discussed in the subsequent sections. The actual split between various pathways depends on 20
the precise location where local climate conditions, local emission densities and dis-tance from high emission areas all determine the overall fate of Nr. Another example of atmospheric processes affecting the impact of Nr is the complex flow conditions in urban street canyons. The generally short residence time of air in urban streets means that only fast reactions of NOxare relevant. However, the presence of buildings, espe-25
BGD
9, 9349–9423, 2012Governing processes for reactive nitrogen
compounds
O. Hertel et al.
Title Page
Abstract Introduction
Conclusions References
Tables Figures
◭ ◮
◭ ◮
Back Close
Full Screen / Esc
Printer-friendly Version Interactive Discussion
Discussion
P
a
per
|
Dis
cussion
P
a
per
|
Discussion
P
a
per
|
Discussio
n
P
a
per
|
which has little direct impact on human health and the airway irritant NO2that e.g. may enhance impact on airborne allergens (Tunnicliffe et al., 1994). As can be seen from this short introduction, the atmospheric chemistry and governing processes removing Nr from the atmosphere is both complex and diverse, reflecting the many compounds involved and their different characteristics. To be able to relate these processes more 5
effectively, the present paper provides an overview of the governing atmospheric pro-cesses of Nrin the atmosphere, with particular attention to the nature of the emissions and removal processes, including bi-directional exchange where this occurs. This re-view represents further develops and an extensive analysis of this topic (Hertel et al., 2011), as originally conceived in the European Nitrogen Assessment (2011). While the 10
paper focuses on Europe, the general principles are applicable globally. For the pur-pose of this review, we have disregarded N2O as it has no health effects at ambient concentration levels and an insignificant role in atmospheric deposition of N. It should be noted though, that it does play a role in the chemistry of the stratosphere and as a climate forcer (Pinder et al., 2012), as well as in leading to depletion of stratospheric 15
ozone (Brink et al., 2011; Butterbach-Bah et al., 2011).
2 Emissions
Nris mainly released to the atmosphere as NH3, NOx, and in poorly quantified amounts of organic N such as amines. By comparison, emission of N2O accounts for a much smaller fraction, representing about 15 % of the total European Nr emission to the 20
atmosphere (Leip et al., 2011).
2.1 Ammonia emissions
This section is devoted to the ammonia emissions and contains sub-sections regarding: Animal houses and manure storages, Manure application and mineral fertilizer, Grazing animals, Non-agricultural sources, Spatial distribution, and Long term trends.
BGD
9, 9349–9423, 2012Governing processes for reactive nitrogen
compounds
O. Hertel et al.
Title Page
Abstract Introduction
Conclusions References
Tables Figures
◭ ◮
◭ ◮
Back Close
Full Screen / Esc
Printer-friendly Version Interactive Discussion
Discussion
P
a
per
|
Dis
cussion
P
a
per
|
Discussion
P
a
per
|
Discussio
n
P
a
per
In western countries, agricultural activities contribute 85 %–98 % of the atmospheric NH3emissions (Anderson et al., 2003; Gyldenkærne et al., 2005; Sutton et al., 2000a). These emissions arise in some cases from the direct breakdown of fertilizer, but more importantly from the breakdown of organic matter (like urea) within animal wastes. The emission process is a chemical and physical process which is highly temperature 5
dependent and varies significantly over day and season (Gyldenkærne et al., 2005; Skjøth et al., 2004). The agricultural sources may be grouped as:
– point sources i.e. animal houses, manure storage and “slurry lakes” (Sommer et al., 2006);
– application of manure and mineral fertilizer to fields (Smith et al., 2009); 10
– grazing animals (Petersen et al., 1998);
– other sources including releases from plants (Larsson et al., 1998) such as legumes (Gyldenkærne et al., 2005) and vegetation during management and senescence (Sutton et al., 2000b, 2009a, b).
And the non-agricultural sources include: 15
– wild animals (Anderson et al., 2003; Riddick et al., 2012; Simpson et al., 1999; Sutton et al., 2000a; Theobald et al., 2006);
– catalyst processes, mainly related to road traffic (Kean et al., 2009; van Vuuren et al., 2011);
– manufacturing processes such as production of fertilizer, glass wool, catalysts 20
and cement;
– humans, pets and sewage systems (Reche et al., 2012; Sutton et al., 2000a);
BGD
9, 9349–9423, 2012Governing processes for reactive nitrogen
compounds
O. Hertel et al.
Title Page
Abstract Introduction
Conclusions References
Tables Figures
◭ ◮
◭ ◮
Back Close
Full Screen / Esc
Printer-friendly Version Interactive Discussion
Discussion
P
a
per
|
Dis
cussion
P
a
per
|
Discussion
P
a
per
|
Discussio
n
P
a
per
|
– emission from plants due to compensation points (Farquhar et al., 1980; Husted et al., 2000; Massad et al., 2010a; Mattsson et al., 2009; Sutton et al., 1995);
– emission from sea surfaces (Barrett, 1998; Sørensen et al., 2003).
The above split of the agricultural sources has been used in a parameterization cur-rently considered as the most advanced description of temporal and spatial variations 5
in NH3 emissions (Pinder et al., 2007). This parameterization was originally devel-oped for Denmark (Gyldenkærne et al., 2005; Skjøth et al., 2004), later extended to Northern Europe (Skjøth et al., 2011), and is currently being further developed in an open source version within the FP7 project ECLAIRE (http://www.eclaire-fp7.eu). This parameterization and other more simple approaches have been successfully imple-10
mented in the Atmospheric Chemistry and Deposition (ACDEP) model (Skjøth et al., 2004), the DEHM model (Brandt et al, 2012, Skjøth et al, 2011), the EMEP MSC-W model (Fagerli et al., 2007; Simpson et al., 2012), the local scale models OML-DEP (Geels et al., 2012; Sommer et al., 2009), the SCAIL (Theobald et al., 2009) screening method developed for the UK, as well as most recently the local scale models AIRMOD 15
and ADMS (Theobald, 2012). We here use the mechanistic description in this model as the basis for describing NH3emissions.
2.1.1 Animal houses and manure storages
Highly complex surface models have been developed for describing NH3 emissions from agricultural buildings (Muck and Steenhuis, 1982; Olesen and Sommer, 1993; 20
Oudendag and Luesink, 1998; Zhang et al., 1994) in order to help better manage emis-sions. However, in chemistry-transport modelling (CTM) a simplified parameterization based on wind speed and temperature has proven more practical (Skjøth et al., 2004):
E(t)=C×T(t)0.89xV(t)0.26 (1)
BGD
9, 9349–9423, 2012Governing processes for reactive nitrogen
compounds
O. Hertel et al.
Title Page
Abstract Introduction
Conclusions References
Tables Figures
◭ ◮
◭ ◮
Back Close
Full Screen / Esc
Printer-friendly Version Interactive Discussion
Discussion
P
a
per
|
Dis
cussion
P
a
per
|
Discussion
P
a
per
|
Discussio
n
P
a
per
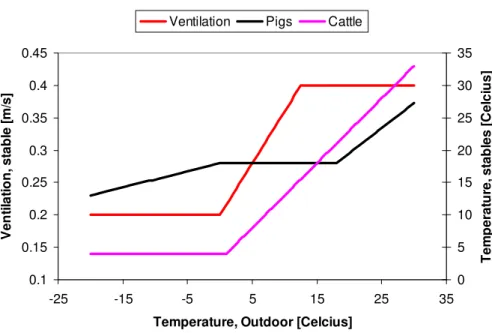
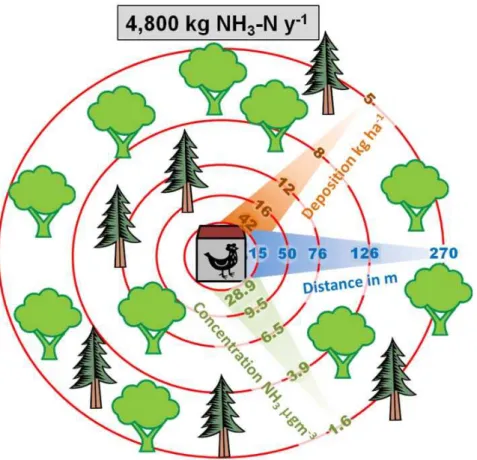
whereC is a constant related to the amount of N or TAN (Total Ammoniacal nitro-gen=sum of NH3 and NH+4) in the manure at a given time and location, T(t) is the temperature as function of time, and V is the wind speed or the rate of ventilation. Formula (1) is used to distribute a known annual emission into shorter time steps. In Northern Europe, pig and poultry sheds are heated in winter and have reduced venti-5
lation (Fig. 2). The annual emissions from manure storage vary with type of storage, and temporal variation follows ambient temperature (Gyldenkærne et al., 2005; Skjøth et al., 2004). In warm areas and during warm periods, emissions from buildings re-flect outdoor temperature (Seedorf et al., 1998). Buildings with pigs and poultry have significant emissions also in cold periods, due to their warmer indoor temperatures, 10
when outdoor storages and naturally ventilated cattle barns have low emission rates. Based on these principles and ambient temperature, it is possible to simulate temporal variations in emissions from manure storage, pig, poultry and cattle sheds (Fig. 3).
2.1.2 Manure application and mineral fertilizer
NH3emissions from field application of manure and mineral fertilizer take place at dis-15
tinct times of year and with relatively short duration compared with animal related point sources. Soil type (Loubet et al., 2010) and the application method are crucial for es-tablishing the magnitude of the emission. Broad-spread application over the whole of the ground surface leads to very high emissions, whereas direct soil injection or band-spreading methods strongly reduce emissions (Skjøth et al., 2008). National regula-20
tions can significantly affect seasonality when these affect application methods (Skjøth et al., 2008) although these emissions have substantial uncertainties (Sintermann et al., 2012). In many countries manure application is constrained by almost no regula-tion, whereas in most Northern European countries, such application is banned during winter to limit nutrient wash out, especially under the EU Nitrate Directive. To over-25
BGD
9, 9349–9423, 2012Governing processes for reactive nitrogen
compounds
O. Hertel et al.
Title Page
Abstract Introduction
Conclusions References
Tables Figures
◭ ◮
◭ ◮
Back Close
Full Screen / Esc
Printer-friendly Version Interactive Discussion
Discussion
P
a
per
|
Dis
cussion
P
a
per
|
Discussion
P
a
per
|
Discussio
n
P
a
per
|
mineral fertilizer there are regional differences, as farmers in Southern Europe start fertilizer application earlier than Northern European farmers.
2.1.3 Grazing animals
The time that animals are in the field, together with the N content in the grass, govern the emission from grazing animals. Animals that are feeding on grass with a high N 5
content excrete large amounts of N (as TAN) compared with animals on grassland with less nitrogen rich grass (Petersen et al., 1998). However, urine from grazing animals quickly enters the soil (Webb et al., 2005) which reduces the emission in comparison e.g. to surface applied slurry. The larger dry matter content of slurries limits infiltration into the soil, which is the main reason for the larger emissions compared with urine 10
from grazing animals. In Southern Europe, animals in general are in the field most of the year. In Northern Europe, only sheep stay in the field most of the time. In most countries cattle are inside sheds approximately half of the year (Skjøth et al., 2011). In principle temperature should increase NH3emission related to grazing animals or outdoor yards used by livestock, however, clear temperature responses have not always been seen 15
in practise (Misselbrook et al., 2001). However studies suggest that emissions from the urine fraction are larger during summer than during autumn (Ryden et al., 1987).
2.1.4 Non-agricultural sources
Non-agricultural sources of NH3are generally poorly described, which is largely a con-sequence of the limited number of data on many different processes. These sources 20
include: human sweat, excreta from pets and wild animals, exhaust from gasoline ve-hicles with catalytic converters, stationary combustion sources and industry, as well as evaporation from waste deposits (Sutton et al., 2000a). Elevated NH3 levels have been reported near roads and in urban areas as a consequence of NH3 emissions from vehicles fitted with catalytic converters (Cape et al., 2004). Evaporation from NH+4 25
BGD
9, 9349–9423, 2012Governing processes for reactive nitrogen
compounds
O. Hertel et al.
Title Page
Abstract Introduction
Conclusions References
Tables Figures
◭ ◮
◭ ◮
Back Close
Full Screen / Esc
Printer-friendly Version Interactive Discussion
Discussion
P
a
per
|
Dis
cussion
P
a
per
|
Discussion
P
a
per
|
Discussio
n
P
a
per
where strongly elevated levels have been found: Barcelona (Reche et al., 2012), Rome (Perrino et al., 2002) and Rijeka (Croatia) (Alebic-Juretic, 2008). Perhaps the best de-scribed non-agricultural sources of NH3are from colonies of wild seabirds (Blackall et al., 2007; Riddick et al., 2012; Wilson et al., 2004) and seals (Theobald et al., 2006). Al-though these contribute to a small fraction of global emissions, they occur in otherwise 5
clean remote environments, representing major point sources under purely climatic control for the given animal densities.
2.1.5 Spatial distribution
EMEP (the Co-operative Programme for Monitoring and Evaluation of the Long-range Transmission of Air Pollutants in Europe: http://ww.emep.int) and CORINAIR 10
(CORe Inventory AIR emissions) have compiled inventories at the European level on annual mean emissions with a spatial resolution of 50 km×50 km (Tørseth et al., 2012). EDGAR (Emissions Database for Global Atmospheric Research, http://edgar. jrc.ec.europa.eu) and GEIA (Global Emissions Inventory Activity, http://geiacenter.org) databases are available on 0.1×0.1◦ resolutions, and EUROTRAC (EUREKA project
15
on the transport and chemical transformation of trace constituents in the troposphere over Europe) GENEMIS (GENeration and Evaluation of eMISsion data; http://www.gsf. de/eurotrac) compiled emission inventories for the year 1994 with a grid resolution of 16.67 km×16.67 km (Schwarz et al., 2000; Wickert et al., 2001). The GENEMIS data have in some cases been used to redistribute EMEP emission to higher resolution also 20
for subsequent years assuming unchanged relative distributions (Hertel et al., 2002). The need for high resolution inventories has been recognized by the model groups within MACC and MACC-II research programmes (http://www.gmes-atmosphere.eu/). They have therefore adapted a high resolution inventory with 7 km resolution of an-nual emissions at SNAP level-1 (Pouliot et al., 2012). The TNO MACC-II inventory is a 25
BGD
9, 9349–9423, 2012Governing processes for reactive nitrogen
compounds
O. Hertel et al.
Title Page
Abstract Introduction
Conclusions References
Tables Figures
◭ ◮
◭ ◮
Back Close
Full Screen / Esc
Printer-friendly Version Interactive Discussion
Discussion
P
a
per
|
Dis
cussion
P
a
per
|
Discussion
P
a
per
|
Discussio
n
P
a
per
|
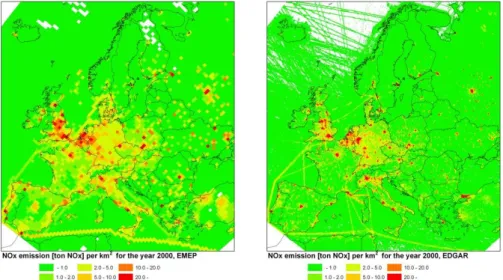
a considerably higher spatial resolution compared to the EMEP data set. The EDGAR data set is constructed centrally using a uniform methodology and uniform data set, while the EMEP data set is a compilation of national inventories that originates from national experts. One result is that the two inventories do not agree with respect to amount of emissions within national boundaries. Such differences can be substantial 5
(de Vries et al., 2011a; de Vries et al., 2011b). Here these differences are clearly seen in Fig. 4, with considerably higher emissions in central Europe in the EDGAR data set compared to the EMEP data set. Emissions are the most important input to all CTMs (Simpson et al., 2011), but for more than a decade been considered among the largest uncertainties in these models (Reis et al., 2009). The differences between the different 10
emission data sets can therefore be expected to have a direct impact on model results for both process descriptions and impact assessments. Whereas emissions are usually reported as annual totals, there is considerable variation on hourly, daily and seasonal time-scales which is represented poorly (if at all) in the data used for CTMs (Menut and Bessagnet, 2010; Pouliot et al., 2012).
15
2.1.6 Long term trends
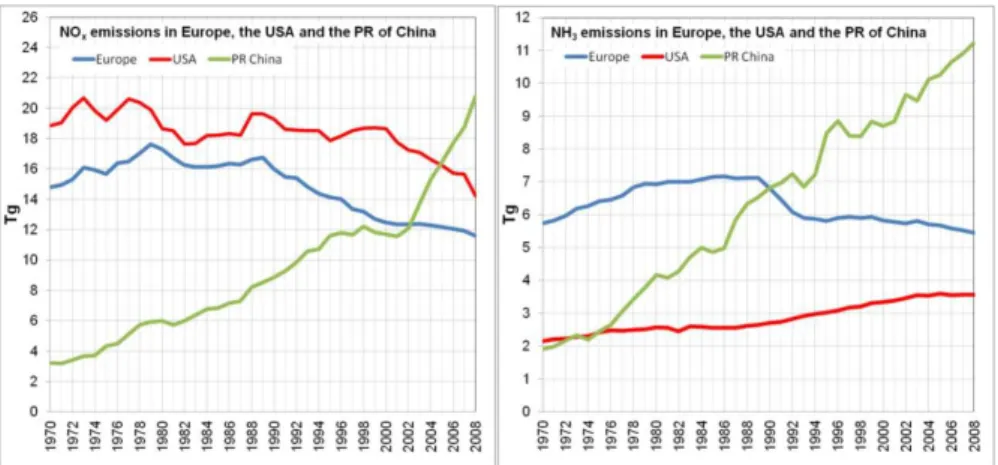
NH3 emissions have been reduced in countries like Denmark, Germany and the Netherlands, whereas for France, Sweden and Norway only minor changes have oc-curred over the past 15 yr, and in countries like China and the US emissions have increased (Fig. 5). The uncertainties in these trends, including the small response of 20
NH3concentrations to reduced animal numbers in central Europe (Horvath and Sutton, 1998) and to emission abatement policies in the Netherlands and Denmark (Bjerre-gaard, 2011; Bleeker and Sutton, 2006; Erisman et al., 1998; Skjøth et al., 2008; Sut-ton et al., 2003) have been a major topic of debate. The recent evidence (Bleeker et al., 2009; Horvath et al., 2009) indicates that increasing NH3concentrations in Eastern 25
BGD
9, 9349–9423, 2012Governing processes for reactive nitrogen
compounds
O. Hertel et al.
Title Page
Abstract Introduction
Conclusions References
Tables Figures
◭ ◮
◭ ◮
Back Close
Full Screen / Esc
Printer-friendly Version Interactive Discussion
Discussion
P
a
per
|
Dis
cussion
P
a
per
|
Discussion
P
a
per
|
Discussio
n
P
a
per
Denmark and elsewhere. The observed trends in NH3 concentrations are therefore a result of changes in NH3emissions as well as changes in atmospheric chemistry.
2.2 Nitrogen oxide emissions
This section is devoted to the nitrogen oxides emissions and contains sub-sections regarding: spatial distribution, temporal variation, trends and projections.
5
NOx is generated at high temperatures in combustion processes mainly from oxi-dation of free atmospheric nitrogen (N2). Road transport and public power generation are by far the largest contributors to the emissions – for Europe these sources each contribute 20 % to 25 % of total NOx emissions (Vestreng et al., 2008). Industrial pro-duction, other mobile sources and shipping each contribute 10 % to 15 %, whereas 10
smaller contributions are related to aviation, and biomass and agricultural burning (2 % to 3 %). Emissions from forest and agricultural soils are discussed in Sect. 2.3. Emis-sions from waste incineration and lightning can probably be neglected (<1 %).
2.2.1 Spatial distribution
Annual inventories of NOx emissions are available from similar sources as for NH3 15
(Sect. 2), which includes EMEP, EDGAR, EUROTRAC, GENEMIS and TNO-MACC. In the same way as for NH3, the differences between the EDGAR and EMEP NOx inven-tories can be seen in Fig. 6. The major road networks and urban areas are obvious hotspots and therefore easily visible. The same is true for shipping, where main trans-port routes are easily detectable and emissions may overall be higher than in urban 20
BGD
9, 9349–9423, 2012Governing processes for reactive nitrogen
compounds
O. Hertel et al.
Title Page
Abstract Introduction
Conclusions References
Tables Figures
◭ ◮
◭ ◮
Back Close
Full Screen / Esc
Printer-friendly Version Interactive Discussion
Discussion
P
a
per
|
Dis
cussion
P
a
per
|
Discussion
P
a
per
|
Discussio
n
P
a
per
|
2.2.2 Temporal variation
Road traffic follows very regular temporal patterns. In Northern Europe the typical ur-ban road traffic pattern include two rush hour periods – in the morning and afternoon. Often the morning rush hour is more pronounced than the afternoon rush hour, and this is reflected in emissions and resulting concentrations of NOx, as e.g. reported for 5
Denmark (Hertel et al., 2008). In some parts of Southern Europe there may even be four rush hours as people are offwork in the middle of the day. Furthermore, different patterns are observed for weekday vs. weekend, and the pattern also differs for pas-senger cars and commercial vehicles. Furthermore, highways are used for transport over longer distance and these have thus different diurnal traffic pattern compared with 10
urban streets. Seasonal variations are less pronounced compared with diurnal varia-tions, although increased power generation for heating, and increased direct fuel use lead to increased NOxemissions in winter in Northern Europe, whereas increased de-mand for air conditioning in summer is expected to lead to increased NOx emissions in summer in Southern Europe.
15
2.2.3 Trends and projections
European NOx emissions have followed a steady downward trend over the time period 1990 to 2005. In total, a reduction of 34 % has been seen for the 27 Member States of the European Union (EU27) as a result of regulation of emissions – like the EC Large Combustion Plant Directive and the EURO regulations for road traffic vehicles 20
(Fig. 5). Over the next decades further reductions will result from stricter regulation of road traffic despite increasing vehicle numbers and increasing distance travelled (Vestreng et al., 2008). Phasing out of nuclear energy may, however, lead to additional coal burning with the result of increasing NOx emissions from electricity generation. International shipping has been steadily increasing, as have the associated emissions, 25
BGD
9, 9349–9423, 2012Governing processes for reactive nitrogen
compounds
O. Hertel et al.
Title Page
Abstract Introduction
Conclusions References
Tables Figures
◭ ◮
◭ ◮
Back Close
Full Screen / Esc
Printer-friendly Version Interactive Discussion
Discussion
P
a
per
|
Dis
cussion
P
a
per
|
Discussion
P
a
per
|
Discussio
n
P
a
per
rec28E 13/) for the Baltic Sea and the North Sea. In urban streets, NO2 has not fol-lowed the decreasing trend observed for NOx, (Carslaw et al., 2007; Lambrecht, 2007). The explanation is that the NO2to NOxratio in road traffic emissions has changed sub-stantially in recent years as a result of late diesel technology vehicles and catalytic converters in gasoline driven vehicles that reduce the overall NOx emission but with 5
a higher NO2 fraction in the remaining emission (Carslaw and Beevers, 2005). EU limit values for NO2 are therefore currently exceeded in many European cities (Her-tel and Goodsite, 2009), and this will persist until stricter EURO 6 norms are imple-mented from 2015 (http://eur-lex.europa.eu/LexUriServ/LexUriServ.do?uri=CELEX: 32007R0715:EN:NOT).
10
2.3 Emissions of NO from ecosystems and soil
In a global perspective, NOx emissions from soil contribute >40 % (Davidson and Kingerlee, 1997) (IGAC Newsletter Dec 2000), and>10 % for some European coun-tries (Butterbach-Bahl et al., 2004; Skiba et al., 1997; Stohl et al., 1996). Estimates of emissions of NOx from agricultural soil varies by more than a factor of two and are 15
mainly related to grazing animals and fertilizer (de Vries et al., 2011c). Emissions that are related to application of fertilizer are estimated to account for 40 % of the soil emis-sions (IGAC Newsletter, 2000) and up to 65 % for the USA (Hall et al., 1996). Rural agricultural areas receiving N fertilizers in countries with long dry periods are likely the largest sources of soil NO where they can be of the same order of magnitude as N2O 20
fluxes (Loubet et al., 2011). The NitroEurope Integrated Project (Sutton et al., 2007; http://www.nitroeurope.eu) and the NOFRETETE (Nitrogen oxides emissions from Eu-ropean Forest Ecosystems) project point to EuEu-ropean forests being large sources of NO from soils (Pilegaard et al., 2006) presumably affected by enrichment with N from atmospheric deposition (Butterbach-Bahl et al., 2011a, b).
BGD
9, 9349–9423, 2012Governing processes for reactive nitrogen
compounds
O. Hertel et al.
Title Page
Abstract Introduction
Conclusions References
Tables Figures
◭ ◮
◭ ◮
Back Close
Full Screen / Esc
Printer-friendly Version Interactive Discussion
Discussion
P
a
per
|
Dis
cussion
P
a
per
|
Discussion
P
a
per
|
Discussio
n
P
a
per
|
3 Transformations
In the following a description of the most important chemical transformation processes for Nr is provided with highlights concerning where these processes play a significant role.
3.1 NHxchemistry in the atmosphere 5
New aerosol particles are formed in gas phase reactions between NH3and gas phase acids. However, NH3may also deposit onto existing atmospheric particles. Whenever sulphuric acid (H2SO4) is present, NH3practically always reacts with this compound in an irreversible process forming aerosol phase ammonium bisulphate (NH4HSO4) and ammonium sulphate ((NH4)2SO4). Naturally this reaction depends on the availability of 10
H2SO4 which is currently decreasing in concentrations in Europe. Early experiments showed that 50 % of the available NH3was converted in about 35 min at concentration levels in those days (20 µg m−3 SO2 and 2.7 µg m−3 NH3) (Mckay, 1971). H2SO4 is formed from gas phase oxidation of SO2by hydroxyl (OH) radical or from aerosol phase conversion by hydrogen peroxide (H2O2) and ozone (O3). The latter process is pH 15
dependent, and may be catalysed by NH3, since uptake of NH3 increases the pH of aerosols (ApSimon et al., 1994; Junge and Ryan, 1958).
The rate of conversion of gas phase SO2 and NH3 into aerosol phase ammonium sulphate has been studied in detail in laboratory experiments (Baldwin and Golden, 1979; Gupta et al., 1995; Huntzicker et al., 1980; McMurry et al., 1983). At high RH, 20
the limiting factor for the transformation is the molecular diffusion of NH3 to the acid particles, whereas at low RH only between 10 % and 40 % of the collisions between NH3 gas molecules and H2SO4-containing particles lead to reaction (Huntzicker et al., 1980; McMurry et al., 1983). For small particles, their relatively large surface area makes the diffusion process more efficient. It has, however, been shown that organic 25
BGD
9, 9349–9423, 2012Governing processes for reactive nitrogen
compounds
O. Hertel et al.
Title Page
Abstract Introduction
Conclusions References
Tables Figures
◭ ◮
◭ ◮
Back Close
Full Screen / Esc
Printer-friendly Version Interactive Discussion
Discussion
P
a
per
|
Dis
cussion
P
a
per
|
Discussion
P
a
per
|
Discussio
n
P
a
per
this is not always the case, and not the case for the reactions with other acid gases. While reaction to form ammonium sulphates is effectively not reversible when these exist in particulate form, the NH3can be returned back to the gas phase as a result of changes in atmospheric composition e.g. during cloud processing (Bower et al., 1995, 1997; Wells et al., 1997).
5
The presence of HNO3 and/or hydrochloric acid (HCl) together with NH3 leads to equilibrium between these gases and their aerosol phase reaction products – ammo-nium nitrate (NH4NO3) and ammonium chloride (NH4Cl). For this reaction an equilib-rium product,keq=[NH3][HNO3] of the gas phase concentrations of NH3and HNO3at saturation of the air is applied. Experimental studies show that this may be expressed 10
as a function solely of temperature and humidity (Stelson et al., 1979; Stelson and Se-infeld, 1982). Besides the reactions with H2SO4 and HNO3, NH3 may also react with HCl and form NH4Cl (Pio and Harrison, 1987; Raes et al., 2000). Whereas HCl is emit-ted as a primary pollutant from coal burning and waste incineration, HNO3is the main secondary pollutant from oxidation of NOx.
15
Ice core data have indicated that the HCl input from sea salt de-chlorination has been enhanced by a factor of 2–3 during the second half of the 20th century similarly to the increase of the atmospheric acidity in response to growing NOxand SO2 anthro-pogenic emissions (Legrand et al., 2002). New measurement data indicate that in NW Europe, HCl concentrations are similar (in terms of mixing ratio) to those of HNO3 in 20
summertime. However, NH4Cl concentrations are generally much lower than NH4NO3 concentrations. HCl is emitted from anthropogenic sources including domestic coal burning in Europe which was historically a significant source of NHxin the atmosphere (Sutton et al., 2008), but also released in displacement reaction in sea spray particles when these take up HNO3(Wall et al., 1988). This displacement is most likely the ex-25
BGD
9, 9349–9423, 2012Governing processes for reactive nitrogen
compounds
O. Hertel et al.
Title Page
Abstract Introduction
Conclusions References
Tables Figures
◭ ◮
◭ ◮
Back Close
Full Screen / Esc
Printer-friendly Version Interactive Discussion
Discussion
P
a
per
|
Dis
cussion
P
a
per
|
Discussion
P
a
per
|
Discussio
n
P
a
per
|
therefore been given considerable scientific attention as e.g. in the EU projects ANICE (de Leeuw et al., 2001) and MEAD (Spokes et al., 2006). Model estimates suggest that equilibrium between HNO3 and sea salt can take hours to days to reach steady state (Erickson et al., 1999; Keene et al., 2002), similar to time scales for transport across the coastal zone. Thus reactions may not be complete within the coastal zone and 5
HNO3concentrations relative to NO−3 can be highly variable depending on the history of the air mass and the history of the mixing between sea salt aerosols and polluted continental air (Fischer et al., 2006).
NO−3 aerosol is found in the coarse as well as the fine mode as a result of the dis-placement reaction whereas NH+4 is present in the fine mode and only in very small 10
amounts in the coarse mode (Yeatman et al., 2001) which affects the subsequent effi -ciency of deposition.
3.2 NOychemistry in the atmosphere
The chemistry of NOyand O3in the atmosphere has been discussed in numerous re-views (see e.g. Crutzen et al., 1999; Jenkin and Clemitshaw, 2000), so only an outline 15
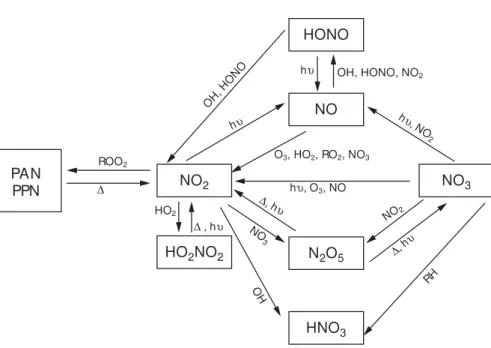
is given here. A sketch showing the main chemical paths of NOy is given in Fig. 7, and a short description including main research findings in this area is given in the following. The fraction of directly emitted NO2from road traffic in western countries has increased in recent years. However, in the tropospheric boundary layer the distribution between NO and NO2 is governed to a large degree by O3 that reacts quickly with 20
NO to form NO2. In sunlight NO2 photo-dissociates (wavelengths 290 to 420 nm) to form NO and the very short-lived oxygen (O(3P)) radical. The latter will in most cases again form O3in reaction with free oxygen (O2), involving a third body (either an N2or O2molecule) that absorbs excess vibrational energy and thereby stabilizes the formed O3 molecule. These reactions all have time-scales of seconds to minutes. The rate of 25
BGD
9, 9349–9423, 2012Governing processes for reactive nitrogen
compounds
O. Hertel et al.
Title Page
Abstract Introduction
Conclusions References
Tables Figures
◭ ◮
◭ ◮
Back Close
Full Screen / Esc
Printer-friendly Version Interactive Discussion
Discussion
P
a
per
|
Dis
cussion
P
a
per
|
Discussion
P
a
per
|
Discussio
n
P
a
per
will either lead to the complete conversion of all the O3 to NO2, or to the conversion of all NO to NO2 (Clapp and Jenkin, 2001). In a highly polluted atmosphere (e.g. an urban area) or close to pollution sources, the former behaviour is usually observed because, although O3 is widely distributed in the lower atmosphere, its concentration is not usually high compared with NO in the highly polluted atmosphere, and hence 5
O3 concentrations become rapidly depleted. During daylight, the main fate of NO2 is to undergo photolysis, which is reforming O3 and NO (Dickerson et al., 1982). This photolysis reaction has a typical rate coefficient under summer conditions in the mid-afternoon at mid-altitudes of about 7×10⁻³s−1. The NO-NO2-O3 chemistry in urban streets may be simplified (Palmgren et al., 1996), assuming that O3is reformed instan-10
taneously, and thereby disregarding the formation of O(3P). This is done in one of the most commonly applied street pollution models – OSPM (Berkowicz, 2000; Kakosimos et al., 2010).
The OH radical initiates the oxidation of a wide range of compounds in the atmo-spheric boundary layer. OH interacts with peroxy radicals that are responsible for the 15
formation of excess concentrations of photo-oxidants like O3. In the background tro-posphere, carbon monoxide (CO) plays a role in this system. In the reaction with OH radical CO is oxidized to CO2, and at the same time a hydroperoxy radical (HO2) is formed. Whenever NO is present, the most important atmospheric reaction of the hy-droperoxy radical (HO2) radical is the conversion of NO to NO2.The hydroperoxy radical 20
is one of many peroxy radicals that take part in the conversion of NO to NO2. Organic peroxy radicals (RO2) are likewise important and are mainly formed by the attack of the OH radical on the organic compounds ubiquitously present in the polluted atmosphere. These reactions follow a similar path as the CO oxidation, leading to formation of alkyl peroxy radicals (Jenkin and Clemitshaw, 2000) that subsequently convert NO to NO2 25
BGD
9, 9349–9423, 2012Governing processes for reactive nitrogen
compounds
O. Hertel et al.
Title Page
Abstract Introduction
Conclusions References
Tables Figures
◭ ◮
◭ ◮
Back Close
Full Screen / Esc
Printer-friendly Version Interactive Discussion
Discussion
P
a
per
|
Dis
cussion
P
a
per
|
Discussion
P
a
per
|
Discussio
n
P
a
per
|
and O2 with a reaction rate coefficient of 2.3×10−38cm6molecules−2s−1 (Hampson and Gavin, 1978) to give NO2. The further transformation of NO2to HNO3takes place with a typical rate of about 5 % per hour in the troposphere. The hydroxyl radical (OH) is formed in daytime in the presence of sunlight (Jenkin and Clemitshaw, 2000) The photo-dissociation of O3 leads to the formation of both O(3P) and O(1D) radicals; a 5
fraction of the latter reacts with water vapour to form two OH radicals. This reaction is in competition with O(1D)’s reaction with 3rd body O2or N2 molecules to form O(3P), that in turn reforms O3. The OH radicals initiate most of the degradation of hydrocar-bons in the atmosphere, a chain of reactions that e.g. lead to the formation of high O3 concentrations during summer.
10
In the night-time the nitrate (NO3) radical has a less important but still somewhat similar role for the degradation of hydrocarbons in the atmosphere as the OH radical in daytime (for an extensive review of the chemistry, see Wayne et al., 1991). Despite the considerably lower reactivity compared with OH, its higher peak concentrations in the night time troposphere allow the NO3 radical to play a major role in the transfor-15
mation of organic compounds. The NO3radical is formed during night-time in reaction with NO2. Dinitrogen pentoxide (N2O5) is a reservoir compound for the NO3 radical at low temperatures, but it is broken down to its precursors NO2 and NO3 at higher temperatures in the dark. The typical night time NO3 radical concentrations in the at-mospheric boundary layer are of the order 107to 108molecules cm−3(which is the pptv 20
range), although both measurements and modelling suggest that values away from the surface may reach 100s of ppt (e.g. Brown et al., 2006; Riemer et al., 2009). During the daytime both NO3 and N2O5 photo-dissociate so fast that the concentrations of these compounds are insignificant. In the tropospheric boundary layer the photolysis of NO3radical (with a typical noon lifetime of about 5 s) follows two different wavelength 25
BGD
9, 9349–9423, 2012Governing processes for reactive nitrogen
compounds
O. Hertel et al.
Title Page
Abstract Introduction
Conclusions References
Tables Figures
◭ ◮
◭ ◮
Back Close
Full Screen / Esc
Printer-friendly Version Interactive Discussion
Discussion
P
a
per
|
Dis
cussion
P
a
per
|
Discussion
P
a
per
|
Discussio
n
P
a
per
NO3close to ground-level. However, above the surface at night NO2 and O3can exist together in the absence of NO (at it has all been converted to NO2), leading to NO3 formation, as observed on a tower in London (Benton et al., 2010). During night time the heterogeneous conversion of N2O5 to HNO3is an important process. The lifetime of N2O5 with respect to this removal is of the order of minutes in the tropospheric 5
boundary layer. This production of HNO3 may in winter be equally important as day-time conversion of NO2by OH radical. As already described, particulate nitrate (NO−3) is formed when HNO3 reacts with NH3 and forms new aerosols, and when it sticks to existing particles in the atmosphere. In addition organic NO−3 may be formed from gaseous NO2on the surfaces of aerosols in other heterogeneous reactions. The NO3 10
radical attacks alkanes by hydrogen abstraction in a similar way as the reactions of the OH radical, and again leading to formation of a peroxy radical (RO2) that may oxidise an NO molecule to NO2. Also for alkenes, the attack of the NO3 radical is similar to the reactions of the OH radical; the NO3 radical adds to the double bond. This reac-tion is followed by rapid O2addition which leads to the production of a peroxy radical. 15
Reaction of soil emissions of NO with atmospheric OH has been suggested to pro-vide an in-canopy source of HNO3(Farmer et al., 2006). HNO3concentrations usually peak during the day, regulated by the emissions of NOx, photochemical activity and the gas/aerosol equilibrium of NH4NO3 shifting towards the gas phase with increas-ing temperature and decreasincreas-ing relative humidity (see e.g. Andersen and Hovmand, 20
1994).
A reaction similar to reaction between NO2and OH forming HNO3, but less impor-tant, is the reaction between NO and OH radical that leads to formation of nitrous acid (HONO). During daytime HONO photo dissociates (λ <400 nm) rapidly back to the reactants. Therefore, HONO formed in the late evening may serve as a night-time 25
BGD
9, 9349–9423, 2012Governing processes for reactive nitrogen
compounds
O. Hertel et al.
Title Page
Abstract Introduction
Conclusions References
Tables Figures
◭ ◮
◭ ◮
Back Close
Full Screen / Esc
Printer-friendly Version Interactive Discussion
Discussion
P
a
per
|
Dis
cussion
P
a
per
|
Discussion
P
a
per
|
Discussio
n
P
a
per
|
was taken as evidence for heterogeneous conversion on aerosol surfaces. Probably this type of conversion plays an important role also in many urban areas over Europe, but so far only few studies have been carried out. Similar heterogeneous reactions can also occur on land surfaces (Harrison et al., 1996), and daytime formation of HONO can take place due to photo-sensitised reduction of NO2on humid acid in soil (Stemm-5
ler et al., 2006). A recent study furthermore suggest that nitrate in agricultural soil may lead to emission of HONO (Su et al., 2011).
3.3 Organic nitrogen compounds in the atmosphere
The presence of atmospheric organic N compounds has been evident for years (Cape et al., 2011; Cornell et al., 2003; Neffet al., 2002), but direct measurements of individ-10
ual species (except PAN, discussed below) are rather sparse. The recent evidence for organic N comes from analysis of precipitation samples for total N and comparison with inorganic N content, to give “dissolved organic N” (DON) by difference. This approach has been prone to several analytical artefacts (Cape et al., 2001), but DON may in fact contribute up to half of total water-soluble N in precipitation.
15
The fraction of N in precipitation in organic form depends highly on location, and on whether air masses are of marine or terrestrial origin. DON has been large ignored in estimating environmental consequences of N deposition; such ecological impacts of DON depend on the bioavailability of the organic N, and there is reason to believe that many, if not all, components of DON are biologically available (Krab et al., 2008; Lipson 20
and Nasholm, 2001; Paerl and Whitall, 1999; Qualls and Haines, 1992).
DON appears to have multiple sources, including agricultural activities and many re-duced N compounds of biological origin, e.g. urea, amines, amino acids etc. (Cape et al., 2011). There appears to be a DON contribution from marine air masses (Cor-nell et al., 1995, 2001; Cor(Cor-nell, 2011), and DON proportions are consistently high in 25
unpolluted air, especially in the tropics. For continental/terrestrial samples, annual av-erage concentrations of DON in precipitation appear to correlate with total N and are better correlated with NH+4 than with NO−
BGD
9, 9349–9423, 2012Governing processes for reactive nitrogen
compounds
O. Hertel et al.
Title Page
Abstract Introduction
Conclusions References
Tables Figures
◭ ◮
◭ ◮
Back Close
Full Screen / Esc
Printer-friendly Version Interactive Discussion
Discussion
P
a
per
|
Dis
cussion
P
a
per
|
Discussion
P
a
per
|
Discussio
n
P
a
per
suggests a significant anthropogenic source of organic N either directly or via atmo-spheric reactions, and the better correlation with NH+4 than with NO−
3 support the sug-gestion of the importance of agricultural sources of DON emission to the atmosphere (Cape et al., 2011).
The seasonal variations in DON concentrations are not always correlated with NH+4 5
concentrations, implying that different sources are involved (Cape et al., 2004). There is limited evidence available from sampling of air directly using a nebulising mist sampler that both gas-phase and particle phase components contribute to water-soluble organic N (WSON) in the atmosphere, which leads to the occurrence of DON in precipitation (Benitez et al., 2010). Organic N has been measured in fog (Zhang and Anastasio, 10
2001) and cloud water (Hill et al., 2007), but there is some concern that most analyses for DON are made on bulk rainfall samples (i.e. collected using an open funnel) and that a significant fraction of the measured DON might have been dry-deposited on the funnel surface (Benitez et al., 2010). This presents problems of interpretation, but does not remove the problem of identifying the source, composition and fate of organic N 15
compounds.
Some measurements of individual components of reduced organic N in gas, particu-late and aqueous phases have been reported and indicate potential sources and fates of these compounds, but in most cases rather small concentrations are measured and these cannot account for the rather high proportions of DON in precipitation. Recent 20
very sophisticated analyses of the composition of DON aimed at identifying functional groups are consistent with an important source involving reduced N, probably via re-actions in the atmosphere (Altieri et al., 2012). Correlations between total N and DON in global databases and the remote atmosphere suggest DON represents on average about 25 % of atmospheric N deposition, although this proportion is highly variable in 25
space and time.
BGD
9, 9349–9423, 2012Governing processes for reactive nitrogen
compounds
O. Hertel et al.
Title Page
Abstract Introduction
Conclusions References
Tables Figures
◭ ◮
◭ ◮
Back Close
Full Screen / Esc
Printer-friendly Version Interactive Discussion
Discussion
P
a
per
|
Dis
cussion
P
a
per
|
Discussion
P
a
per
|
Discussio
n
P
a
per
|
dissociated or react with OH, an alkyl radical is formed, which in turn may form peroxy alkyl nitrates that serve as important reservoirs of NO2 (Fig. 8). The most abundant of these nitrates is the peroxyacetyl nitrate (PAN). PAN is thermally unstable and equi-librium between peroxy acetyl radical and NO2 on one side and PAN on the other side is established in the boundary layer. High PAN and O3 concentrations are often 5
observed together during photo chemical smog episodes. Thermal degradation gives PAN a lifetime of∼1.7 h at 273 K and 50 h at 263 K. The PAN formation competes with NO degradation of peroxy acetyl radical. This reaction is usually dominating at ppbv levels of NO meaning that PAN and other peroxy alkyl nitrates are usually formed only in the background atmosphere, but substantial PAN concentrations may still be ob-10
served in urban areas at relatively low temperatures. The peroxy alkyl nitrates include compounds produced in a similar way as PAN, but generated from biogenic isoprene emissions that may be of importance in southern Europe, and have similar thermal degradation pathways as PAN. PAN is an important atmospheric N reservoir species, but it is probably not an important source of DON (Cornell et al., 2003). PAN depo-15
sition has been modelled in many studies (Wu et al., 2012), and the dry deposition is much faster than expected on the basis of its solubility, with dry deposition veloci-ties in daytime up to 10 mm s−1, so much is still unknown about the mechanisms of its atmospheric removal (Turnipseed et al., 2006).
4 Dry deposition and bi-directional fluxes
20
Nr is monitored in many regional networks across the world, such as the European EMEP programme (www.emep.int) that includes both long-term observations (Tørseth et al., 2012 and campaign studies Aas et al., 2012), the NitroEurope Integrated Project (NEU; www.nitroeurope.eu; Sutton et al., 2007) the US National Atmospheric Depo-sition Network (NADP; http://nadp.sws.uiuc.edu/), the Acid DepoDepo-sition Monitoring Net-25
BGD
9, 9349–9423, 2012Governing processes for reactive nitrogen
compounds
O. Hertel et al.
Title Page
Abstract Introduction
Conclusions References
Tables Figures
◭ ◮
◭ ◮
Back Close
Full Screen / Esc
Printer-friendly Version Interactive Discussion
Discussion
P
a
per
|
Dis
cussion
P
a
per
|
Discussion
P
a
per
|
Discussio
n
P
a
per
using inferential modelling approaches (Erisman et al., 1994; Erisman and Draaijers, 1995), such as using measured air concentrations and meteorology in combination with a dry deposition algorithm (e.g. Flechard et al., 2011; Skjøth et al., 2002) which are underpinned by often sparse databases of campaign based process studies with limited geographical coverage. This is partly due to the fact that instrumentation to 5
measure fluxes of sticky compounds such as NH3, HNO3or HONO are expensive and labour intensive to operate. The measurement of each individual Nrcompound is tech-nically more challenging than that of CO2 fluxes. Robust low cost flux measurement approaches are lacking, although recent development of a Conditional Time-Averaged Gradient (COTAG) method (Famulari et al., 2010) shows promise for wiscale de-10
ployment over long periods for short vegetation.
A first European flux measurement network for reactive nitrogen compounds was established within the NitroEurope IP (2011) (Skiba et al., 2009; Sutton et al., 2007; Tang et al., 2009). This network applied at a three-tier approach, where selected Nr compounds were measured at a network of 13 supersites, using advanced micromete-15
orological flux measurement techniques. At a further 9 regional sites the novel COTAG systems combined with a low-cost time-integrated approach for measuring soil gas fluxes (System for Inert Gas flux Monitoring by Accumulation, SIGMA, Ambus et al., 2010) were deployed, while deposition was derived at a further 50+“inferential sites” from concentration measurements, using inferential techniques (Flechard et al., 2011; 20
Sutton et al., 2007; Tang et al., 2009).
A comprehensively detailed spatial coverage of Nr deposition can only be achieved through numerical modelling (e.g. Simpson et al., 2007, 2011). The gaseous Nr com-pounds usually making the biggest contribution to dry deposition are NH3, HNO3 and NO2. Their relative contributions to N deposition depend on the pollution climate. In 25
BGD
9, 9349–9423, 2012Governing processes for reactive nitrogen
compounds
O. Hertel et al.
Title Page
Abstract Introduction
Conclusions References
Tables Figures
◭ ◮
◭ ◮
Back Close
Full Screen / Esc
Printer-friendly Version Interactive Discussion
Discussion
P
a
per
|
Dis
cussion
P
a
per
|
Discussion
P
a
per
|
Discussio
n
P
a
per
|
the main agricultural areas, whereas oxidised nitrogen dry-deposits over much larger transport distances. In addition, NH3 deposition depends on the N status of the re-ceiving surface, with fertilised vegetation and vegetation rere-ceiving high atmospheric N deposition inputs acting as a less efficient sink or even, in the case of fertilized vegeta-tion, a net source of NH3(Loubet et al., 2009; Sutton et al., 1993). In wet regions, leaf 5
cuticles frequently provide an efficient sink for water soluble gases (NH3 and HNO3), although the cuticular sinks for both gases can become saturated under very dry con-ditions, increasing the importance of stomata as an uptake pathway (Nemitz et al., 2004b).
4.1 The dry deposition process
10
Dry deposition is the direct uptake of gases or aerosols at terrestrial or marine sur-faces. The dry deposition of gases and particles is a continuous process and governed by their air concentrations, turbulent transport processes in the boundary layer, the chemical and physical nature of the depositing species, and the biological and chemi-cal capability of the surface to capture or absorb the species (e.g. Fowler et al., 2009). 15
In relation to deposition transport, the boundary layer may be considered to consist of two layers: the fully turbulent layer and the quasi-laminar layer. The quasi-laminar layer is introduced to quantify the way in which pollutant transfer differs from momen-tum transfer in the immediate vicinity of the surface (Hicks et al., 1987). In this layer, the transport is dominated by molecular diffusion. Once at the surface, the chemical, 20
biological and physical nature of the surface determines the capture or absorption of the gases and particles. Deposition to water surfaces (oceans or fresh waters) may thus be very different from deposition to vegetated surfaces on land.
The deposition process may be considered as a series of resistances, by analogy with an electrical circuit (Monteith and Unsworth, 2008). The resistances refer to the 25
BGD
9, 9349–9423, 2012Governing processes for reactive nitrogen
compounds
O. Hertel et al.
Title Page
Abstract Introduction
Conclusions References
Tables Figures
◭ ◮
◭ ◮
Back Close
Full Screen / Esc
Printer-friendly Version Interactive Discussion
Discussion
P
a
per
|
Dis
cussion
P
a
per
|
Discussion
P
a
per
|
Discussio
n
P
a
per
a network of parallel resistances, representing transfer to the external leaf surface, through stomata, to water on the surface, or through the canopy to the underlying soil surface. The total resistance (Rt) is the sum of all the series and parallel resistances (Ra+Rb+Rc), and is usually expressed in units of s m−1. The inverse of the total re-sistance (1/Rt) is known as the deposition velocity (vd), representing the deposition 5
flux (F) normalized by the air concentration at heightz(Xz), i.e.vd(z)=−F/Xz and has units of m s−1(Fowler et al., 2001a; Hicks et al., 1987).
The turbulent transfer resistance (Ra) depends upon the height at which the deposi-tion flux is measured, so the total resistance (Rt) and deposition velocity (vd) also vary with height above the surface. The transfer flux (F) is defined as the product of the air 10
concentration of a gas or particles at heightz, multiplied by the deposition velocity at heightz, and in the absence of competing chemical reactions (Sorensen et al., 2005), does not vary with height, provided that the air concentration is horizontally uniform.
The resistance formulation described above assumes that the concentration of the gas at the absorbing surface is zero (e.g. on the leaf cuticle or within plant stomata). 15
Where this is not the case (see below) the effect can be described mathematically either as a decreased driving force for deposition (concentration difference between heightzand the non-zero surface concentration) or as an increased surface resistance. The interpretation as a surface resistance in this context has the disadvantage that it is unable to simulate the bi-directional fluxes induced by non-zero surface concentrations. 20
The deposition velocity (vd) is often reported as a constant even though it depends on a set of variables, e.g. wind speed, surface roughness and atmospheric stratifica-tion. Joffre (1988) has suggested a parameterization which depends on the meteo-rological conditions, roughness length and the molecular diffusion coefficient for the compound of interest. The various components of the total transport resistance can be 25