of Protection by BCG
Pere-Joan Cardona1,2,3*, Cristina Vilaplana1,2,3*
1Unitat de Tuberculosi Experimental, Fundacio´ Institut d’Investigacio´ en Cie`ncies de la Salut Germans Trias i Pujol, Badalona, Catalonia, Spain,2Universitat Auto`noma de Barcelona (UAB), Bellaterra, Catalonia, Spain,3Centro de Investigaciones Biome´dicas En Red Enfermedades Respiratorias (CIBERES), Madrid, Spain
Abstract
Although contacts between tuberculosis patients may result in multiple consecutive infections (MCI), no experimental animal models consider this fact when used in basic studies. Moreover, the current TB vaccine (BCG) has demonstrated a limited protection in humans. In this study we evaluate the effect of tuberculosis MCI by way of a simple mathematical analysis using data from the low dose aerosol murine experimental model. The results show that a higher number of, or shorter intervals between, multiple consecutive infections reduce the protective effect of BCG. This is due to both the increase in bacillary load at the stationary level of the infection, and the protective immune response induced by the infection itself. This factor must therefore be taken into account when designing new prophylactic strategies as candidate vaccines for the replacement of BCG.
Citation:Cardona P-J, Vilaplana C (2014) Multiple Consecutive Infections Might Explain the Lack of Protection by BCG. PLoS ONE 9(4): e94736. doi:10.1371/ journal.pone.0094736
Editor:Riccardo Manganelli, University of Padova, Medical School, Italy
ReceivedFebruary 11, 2014;AcceptedMarch 18, 2014;PublishedApril 16, 2014
Copyright:ß2014 Cardona, Vilaplana. This is an open-access article distributed under the terms of the Creative Commons Attribution License, which permits unrestricted use, distribution, and reproduction in any medium, provided the original author and source are credited.
Funding:This study was supported by the Spanish Government (project FIS 011/01702 and contract CP13/00174. The funders did not participate in the study design, collection, analysis and interpretation of data, writing of the manuscript, or in the decision to submit the manuscript for publication.
Competing Interests:The authors have declared that no competing interests exist. * E-mail: [email protected] (PJC); [email protected] (CV)
Introduction
Despite being an ancient disease and the enormous efforts devoted to its study, there are still many unknowns surrounding tuberculosis (TB). One of the main difficulties in controlling active disease (TB) is that onceMycobacterium tuberculosis (Mtb) infection has occurred, only 10% of infected subjects will go on to develop TB over a very variable length of time [1], although the highest risk of this happening is during the first two years postinfection. This is the reason for the ‘‘contact tracing’’ activity classically undertaken once a case of TB has been identified [2]: the people with whom the infected person has come into close contact are investigated, usually by performing a Tuberculin Skin Test (TST) or T-cell Interferon Gamma Release Assay (TIGRA) [3], to see whether they are also infected. Although very useful, these techniques are not able to discern how many times a contact case is infected. In the ‘‘contact tracing’’ strategy, three risk circles are usually drawn according to the number of hours of contact with the TB patient—the higher the number of contact hours, the higher the risk of becoming infected [2]. However, does this mean that infection is a single event and the number of hours simply reflects a higher probability of this single event happening? Currently it cannot be demonstrated that, once infected, the infected subject avoids another infection. Indeed, it is logical to suppose that this situation includes a population in an asymmetric distribution, with some people suffering ‘‘multiple consecutive infections’’ (MCI) of greater or lesser intensity. This is very relevant for two reasons. First of all because this will have an effect on the global infective dose of the subject; and secondly because Mtb infection generates a specific immune response as good as that induced by BCG [4].
One of the main objectives in the fight against TB over the past 20 years has been to develop a prophylactic vaccine that gives better protection than the Bacillus Calmette Guerin (BCG), which is widely used and administered to neonates despite having only a limited effect [5]. Unfortunately, the most developed candidate, known as MVA-Ag85, was recently shown to be unable to induce further protection [6], thereby suggesting the need to rethink prophylactic TB vaccine strategies [7,8].
In this regard, and in light of the usual preclinical assays for the development of such vaccines [8], it is interesting to note that, until very recently [7], no attention has ever been paid to testing the influence of MCI, even for the gold standard BCG. This means that in preclinical assays, and despite the large variety of experimental models used, all vaccines are tested against only a single infection. In particular, the low dose (about 100 bacilli) aerosol infection in mice, which achieves an exponential bacillary growth in lungs that reaches a stationary level on day 20 post-challenge, is the most widely used [9]. In this context, BCG vaccination provides a protection based on a 1-log reduction in pulmonary bacillary load from day 15 onwards due to an earlier accumulation of Mtb-specific Th1 lymphocytes in the lesions [10]. This is important because it is thought that lower stationary level leads to lower risk of developing active TB, although this concept is currently being challenged [7].
Material And Methods
The growth model
The following exponential equation was used in our study:
N~No2(t=2:3)
whereNois the initial dose (100 CFUs), andtis the time in days. Data were analysed using a spreadsheet (Microsoft Excel 2010).
Parameters for the infection evolution
1.-The total bacillary load in the lung. This indirectly reflects the level of bacillary concentration in the lymph nodes. It is assumed that the immune response is triggered once a certain concentration threshold is exceeded [11].
2.- The local bacillary load at each infection site. It is assumed that once a certain threshold concentration is reached at a site, there is sufficient capacity to attract the specific lymphocytes that will be needed to control the bacillary load [11].
3.- Stationary level. This is reached when the bacillary load at an infection site stabilizes. It is the final result of the previous parameters and requires a certain bacillary load in the lymph nodes, which is lower in vaccinated mice, to trigger the immune
response; and a certain bacillary load at the infection site to attract the specific lymphocytes. In the case of a single infection this parameter reaches about 6 log (1,195,374 bacilli precisely) at day 20 post-infection in naı¨ve animals but five days earlier and with a lower bacillary concentration (135,952 bacilli, about 5 logs) in BCG-vaccinated animals (Figure 1). This resembles data obtained in experimental in vivo modelling [10].
Model of multiple consecutive infections The time intervals considered were:
N
every 24 hours for 1, 3, 5, 10, 15, 20, 40 or 80 daysN
a total of 10 consecutive infections, one every 1.5, 3, 6, 12 or24 hours
The total bacillary load at each time interval was calculated as the sum of the bacillary load achieved as a result of replication of previous infections plus the new infections.
Results
A higher number of MCI results in a lower protective effect of BCG
It can be seen from Figures 1 and 2, which show the effect of MCI, that a higher number of infections results in a higher stationary level and less difference between vaccinated and naı¨ve mice. Moreover, the addition of different infections in naı¨ve mice increases the global bacillary load and curtails the exponential growth as it reaches earlier the minimum load need to trigger the immune response. Table 1 shows an example of one of the analyses in an attempt to understand this phenomenon. In this case, after only five consecutive infections the global bacillary load in naı¨ve mice stops by day 18, instead of increasing until day 20. These findings therefore clearly show that, in the context of MCI, a higher number of infections decreases the protection afforded by BCG vaccination.
Figure 1. Evolution of the bacillary load in the model of single or multiple consecutive infections (MCI). Progression of the bacillary concentration in both naı¨ve (A to C) and BCG-vaccinated mice (D to F) after single infection (A and B) or MCI with 10 (x10) or 40 (x40) infections. The red line represents the sum of the bacillary load at all individual infection sites.
doi:10.1371/journal.pone.0094736.g001
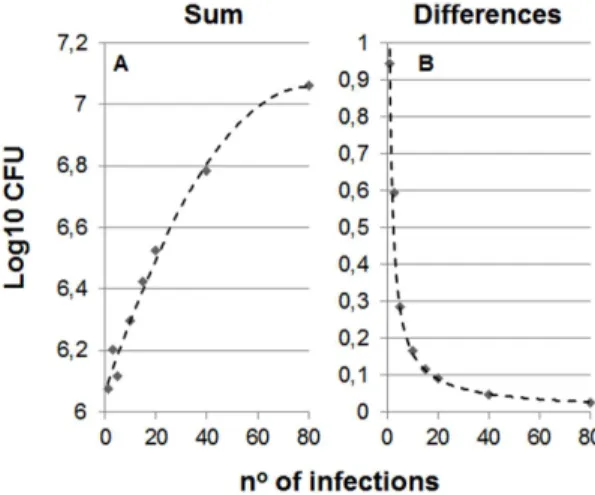
Figure 2. Influence of the number of multiple consecutive infections (MCI) to the stationary level. Picture A shows the evolution of the total bacillary load in the lung (sum) after different number of MCI in naı¨ve mice. The data have been adjusted to a polynomic formula: y~{0:0002x2z0:0245xz6,07 (R2= 0.9865). In
Picture B which shows differences between naı¨ve and vaccinated mice, the formula has been adjusted to an exponential one:y~1:158x{0,856 (R2= 0.9883).
doi:10.1371/journal.pone.0094736.g002
Multiple Consecutive Infections and BCG Failure
CFUs Naı¨ve (non-vaccinated mice) CFUs BCG-vaccinated mice
Infection Sites Infection Sites
Day 1 2 3 4 5 Sum 1 2 3 4 5 Sum
0 100 100 100 100
1 309 100 409 309 100 409
2 477 309 100 886 477 309 100 886
3 737 477 309 100 1623 737 477 309 100 1623
4 1138 737 477 309 100 2762 1138 737 477 309 100 2762
5 1759 1138 737 477 309 4420 1759 1138 737 477 309 4420
6 2716 1759 1138 737 477 6827 2716 1759 1138 737 477 6827
7 4196 2716 1759 1138 737 10546 4196 2716 1759 1138 737 10546
8 6481 4196 2716 1759 1138 16290 6481 4196 2716 1759 1138 16290
9 10010 6481 4196 2716 1759 25161 10010 6481 4196 2716 1759 25161
10 15462 10010 6481 4196 2716 38865 15462 10010 6481 4196 2716 38865
11 23883 15462 10010 6481 4196 60032 23883 15462 10010 6481 4196 60032
12 36890 23883 15462 10010 6481 92726 36890 23883 15462 10010 6481 92726
13 56982 36890 23883 15462 10010 143228 56982 36890 23883 15462 10010 143228
14 88016 56982 36890 23883 15462 221234 88016 56982 36890 23883 15462 221234
15 135952 88016 56982 36890 23883 341724 135952 88016 56982 36890 23883 341724
16 209995 135952 88016 56982 36890 527835 135952 135952 88016 56982 36890 453792
17 324364 209995 135952 88016 56982 815309 135952 135952 135952 88016 56982 552854
18 501022 324364 209995 135952 88016 1259348 135952 135952 135952 135952 88016 631824
19 501022 324364 209995 135952 135952 1307284 135952 135952 135952 135952 135952 679760
20 501022 324364 209995 135952 135952 1307284 135952 135952 135952 135952 135952 679760
Evolution of the infection at each site is followed over time using a spreadsheet (all data can be found as Table S1). We consider the formulaN~No2(t=2:3)whereNois the initial dose (100 CFUs), andtis the time in days. We highlight in bold italics the total bacillary load in the lung (sum) at the time when the immune response induced the stationary level in the model of single infection (1,195,374 and 135,952 CFUs for naı¨ve and vaccinated mice, respectively). At this time the stationary level is reached at each infection site where there is a minimal bacillary concentration (135,952 CFUs, in bold). This is why, in contrast to what happens in a single infection model, the first infection stops before reaching 1,195,374 CFUs (i.e. on day 18 at 501,022 CFUs). The stationary level is therefore reached at all sites except site 5, which has not reached the minimal bacillary concentration.
In the case of BCG-vaccinated mice, the stationary level at each site could be reached earlier as the sum on day 13 is 143,228. This exceeds the level of 135,952 bacilli, and thus the immune response is ready. However, there is insufficient bacillary load locally, which is why the stationary level is not immediately reached at each infection site. This illustrates how important it is for the local bacillary load to have the benefit of the immune response. doi:10.1371/journal.pone.0094736.t001
Multiple
Consec
utive
Infections
and
BCG
ONE
|
www.ploson
e.org
3
April
2014
|
Volume
9
|
Issue
Time between infections is critical in MCI
The results obtained when simulating infections on a time scale of a few hours show that the lower the interval between infections the lower the maximum overall bacillary load reached. This is due to the fact that, when infections occur at short intervals, the minimal bacillary concentration required to trigger the immune response is reached earlier, thus preventing higher concentrations from being reached as a result of exponential growth (Figure 3). As a result, shorter intervals between infections result in fewer differences between vaccinated and non-vaccinated animals.
Discussion
Experimental models have taught us that lesions in different evolutionary phases can be observed after a certain period of time [9,12,13], a situation that is also found in diseases caused by other pathogens controlled only by cellular immunity [14]. This diversity supports the dynamic hypothesis of latent infection, which is based on a process of constant endogenous reinfection [15] and considers that a certain number of infected macrophages are needed to attract specific lymphocytes, with granulomas being induced as protective structures upon generation of a sufficient local inflammatory response [11].
The mathematical model presented herein is the consequence of the effect of the global bacillary load of the whole lung, as it determines the concentration in the lymph nodes, and thus the ability to trigger an immune response [16,17]; and the bacillary load at each infection site, which will determine the capacity to attract this immune response and to stop bacillary growth at each site [11].
Our starting point was the experimental data from the mouse model: for a single infection, the bacillary load of a naı¨ve mouse increases until it reaches 1,195,374 bacilli, at which point it stabilizes. Vaccinated mice achieve the stationary level with a lower bacillary load (135,952 bacilli) and much earlier than naive animals [10]. Vaccination with BCG does not prevent Mtb infection in the mouse model, it simply reduces the stationary level of the bacillary load by causing it to be reached earlier. It is important to note that after the first Mtb infection, naı¨ve mice
reach a specific immune response as good as that induced by BCG[4]. This is the key to understanding why previous vaccination has less relevance when the animal suffers a number of MCI, or when there is a short interval between them, because naı¨ve mice become immune earlier.
In our experiment, we calculated the overall bacillary loads as well as the bacillary load for every infection simulated, considering each of them to occur at individual sites. Although it is true that the naı¨ve mouse has to mount a proper immune response and vaccinated animals already have such a response (and can therefore act several days earlier), vaccinated animals still need the bacillary load at a specific infection site to exceed a specific level in order to benefit from the effect of the immune response. This is why BCG vaccination cannot avoid MCI. What happens with other TB vaccines? If we extrapolate that the cellular immune response behaves as in the case of BCG, we should expect the same outcomes. However, this may not be the case, which is why it is very important to start to simulate MCI in preclinical experimental modelling to confirm the hypothesis in BCG and, of course, in all the other candidates designed to be better than BCG.
The time intervals in our study were decided arbitrarily in order to mimic the human situation in which a person would be in close contact with a TB patient and therefore submitted to a probable infection, while also taking into account a high incidence and the diagnostic delay. The hours’ rate was intended to mimic cohabitation with a TB patient (i.e. household contact), in which contacts are repeated at short time intervals. The daily rate during several days was intended to mimic a constant short contact with a TB patient (i.e. going to have tea served every day by a waiter who suffers from TB).
Although useful, some facts should be taken into account when extrapolating our data to humans. The stationary level for the bacillary load achieved in humans is probably much lower, at around 5 logs [11,13]. Similarly, the profibrotic environment in human lungs allows encapsulation of the lesions [13] and progressively stops the endogenous reinfection process. This is why, in light of the data obtained in the minipig model (also able to encapsulate the lesions), and in contrast to the situation found in mice, we believe that the stationary level is not that stationary and probably decreases with time, especially after the first two years post-infection [18] although this factor obviously affects both vaccinated and non-vaccinated subjects.
The main conclusion of our study is that MCI reduce the protective effect of BCG, thereby highlighting the need for a better understanding of this factor at both preclinical and clinical levels. MCI is a process that should be taken into account when studying prophylactic interventions, especially when developing candidate vaccines intended to replace BCG. Similarly, greater effort should be invested in promoting research into MCI analysis in different human populations in order to design the best possible prophy-lactic measures against TB.
Supporting Information
Table S1 Data of the evolution of the infection.Evolution
of the infection at each site, followed over time using a spreadsheet (all data included).
(XLS)
Author Contributions
Conceived and designed the experiments: PJC CV. Analyzed the data: PJC CV. Contributed reagents/materials/analysis tools: PJC CV. Wrote the paper: PJC CV.
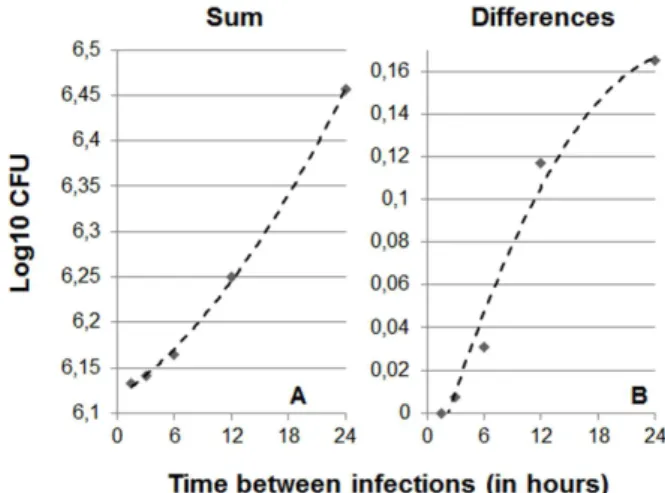
Figure 3. Influence of the interval between multiple consecu-tive infections (MCI) on the stationary level.Picture A shows the evolution of the total bacillary load in the lung (sum) considering 10 consecutive infections only. The data have been adjusted to a polynomic formula: y~0:0003x2z0:0072xz6:1178 (R2= 0.9988). In
Picture B, which show differences between naı¨ve and vaccinated mice, the formula is:y~{0:0003x2z0:0146x{0:031(R2= 0,9774).
doi:10.1371/journal.pone.0094736.g003
Multiple Consecutive Infections and BCG Failure
References
1. Parrish NM, Dick JD, Bishai WR (1998) Mechanisms of latency in Mycobacterium tuberculosis. Trends Microbiol 6: 107–112.
2. Rieder HL (2003) Contacts of tuberculosis patients in high-incidence countries. Int J Tuberc Lung Dis 7: S333–336.
3. Pai M, Menzies D (2007) The new IGRA and the old TST: making good use of disagreement. Am J Respir Crit Care Med 175: 529–531.
4. Mollenkopf H, Kursar M, Kaufmann S (2004) Immune response to postprimary tuberculosis in mice: Mycobacterium tuberculosis and Miycobacterium bovis bacille Calmette-Gue´rin induce equal protection. J Infect Dis 190: 588–597. 5. Trunz BB, Fine P, Dye C (2006) Effect of BCG vaccination on childhood
tuberculous meningitis and miliary tuberculosis worldwide: a meta-analysis and assessment of cost-effectiveness. Lancet 367: 1173–1180.
6. Tameris MD, Hatherill M, Landry BS, Scriba TJ, Snowden MA, et al. (2013) Safety and efficacy of MVA85A, a new tuberculosis vaccine, in infants previously vaccinated with BCG: a randomised, placebo-controlled phase 2b trial. Lancet 381: 1021–1028.
7. Delogu G, Manganelli R, Brennan MJ (2013) Critical research concepts in tuberculosis vaccine development. Clin Microbiol Infect.
8. Brennan MJ, Thole J (2012) Tuberculosis vaccines: a strategic blueprint for the next decade. Tuberculosis (Edinb) 92 Suppl 1: S6–13.
9. Orme IM (2005) Mouse and guinea pig models for testing new tuberculosis vaccines. Tuberculosis (Edinb) 85: 13–17.
10. Jung Y, Ryan L, LaCourse R, North R (2005) Properties and protective value of the secondary versus primary T helper type 1 response to airborne Mycobacterium tuberculosis infection in mice. J Exp Med 201: 1915–1924.
11. Bru A, Cardona P (2010) Mathematical modeling of tuberculosis bacillary counts and cellular populations in the organs of infected mice. PLoS One 5: e12985.
12. Johnson L, Dean G, Rhodes S, Hewinson G, Vordermeier M, et al. (2007) Low-dose Mycobacterium bovis infection in cattle results in pathology indistinguish-able from that of high-dose infection. Tuberculosis (Edinb) 87: 71–76. 13. Gil O, Dı´az I, Vilaplana C, Tapia G, Dı´az J, et al. (2010) Granuloma
encapsulation is a key factor for containing tuberculosis infection in minipigs. PLoS One 5: e10030.
14. Lewinsohn DA, Gold MC, Lewinsohn DM (2011) Views of immunology: effector T cells. Immunol Rev 240: 25–39.
15. Cardona P (2009) A dynamic reinfection hypothesis of latent tuberculosis infection. Infection 37: 80–86.
16. Chackerian AA, Alt JM, Perera TV, Dascher CC, Behar SM (2002) Dissemination of Mycobacterium tuberculosis is influenced by host factors and precedes the initiation of T-cell immunity. Infect Immun 70: 4501–4509. 17. Wolf AJ, Desvignes L, Linas B, Banaiee N, Tamura T, et al. (2008) Initiation of
the adaptive immune response to Mycobacterium tuberculosis depends on antigen production in the local lymph node, not the lungs. J Exp Med 205: 105– 115.