www.atmos-chem-phys.net/14/3739/2014/ doi:10.5194/acp-14-3739-2014
© Author(s) 2014. CC Attribution 3.0 License.
Atmospheric
Chemistry
and Physics
Ice particle habit and surface roughness derived from PARASOL
polarization measurements
B. H. Cole1, P. Yang1, B. A. Baum2, J. Riedi3, and L. C.-Labonnote3
1Department of Atmospheric Sciences, Texas A&M University, College Station, Texas, USA
2Space Science and Engineering Center, University of Wisconsin-Madison, Madison, Wisconsin, USA 3Laboratoire d’Optique Atmosphérique, UMR CNRS 8518, Université de Lille 1 – Sciences et Technologies, Villeneuve d’Ascq, France
Correspondence to:B. A. Baum ([email protected])
Received: 22 August 2013 – Published in Atmos. Chem. Phys. Discuss.: 12 November 2013 Revised: 21 February 2014 – Accepted: 2 March 2014 – Published: 11 April 2014
Abstract. Ice clouds are an important element in the ra-diative balance of the earth’s climate system, but their mi-crophysical and optical properties still are not well con-strained, especially ice particle habit and the degree of par-ticle surface roughness. In situ observations have revealed common ice particle habits and evidence for surface rough-ness, but these observations are limited. An alternative is to infer the ice particle shape and surface roughness from satel-lite observations of polarized reflectivity since they are sen-sitive to both particle shape and degree of surface roughness. In this study an adding–doubling radiative transfer code is used to simulate polarized reflectivity for nine different ice habits and one habit mixture, along with 17 distinct levels of the surface roughness. A lookup table (LUT) is constructed from the simulation results and used to infer shape and sur-face roughness from PARASOL satellite polarized reflectiv-ity data over the ocean. Globally, the retrievals yield a com-pact aggregate of columns as the most commonly retrieved ice habit. Analysis of PARASOL data from the tropics re-sults in slightly more aggregates than in midlatitude or polar regions. Some level of surface roughness is inferred in nearly 70 % of PARASOL data, with mean and median roughness nearσ= 0.2 and 0.15, respectively. Tropical region analyses have 20 % more pixels retrieved with particle surface rough-ness than in midlatitude or polar regions. The global asym-metry parameter inferred at a wavelength of 0.865 µm has a mean value of 0.77 and a median value of 0.75.
1 Introduction
There are still considerable uncertainties in the characteri-zation of the radiation balance of the earth, with the prob-lem of clouds in the earth’s atmosphere near the forefront (Forster et al., 2007). Even though ice clouds can be optically thin they are still important because of their spatial coverage, which can reach 70 % in the tropics (Nazaryan et al., 2008; Guignard et al., 2012). The ice habit and degree of surface roughness of the ice particles within natural ice clouds can have a large impact on the radiative properties of the clouds and affect estimates of their radiative forcing (Baran, 2009; Wendisch et al., 2005, 2007; Yang et al., 2008a, b; Yi et al., 2013). Assuming rough ice particles instead of smooth can lead to a twofold increase in the amount of solar energy re-flected back at the top of the atmosphere (Ulanowski et al., 2006; Baran, 2012). To reduce the uncertainties in the char-acterization of the microphysics of ice clouds, this study uses polarized reflectivity measurements from the PARA-SOL (Polarization and Anisotropy of Reflectances for At-mospheric Sciences coupled with Observations from a Lidar) platform along with simulations from a full-vector radiative transfer model to infer the habit and degree of surface rough-ness of particles within the ice clouds.
particle habit geometries can become quite complex, espe-cially for larger aggregates of particles. The particle habit depends on many different factors, including the temperature and relative humidity at which the ice formed (Gayet et al., 2011; Korolev et al., 1999). Heymsfield and Miloschevich (2003) showed that the distribution of ice varies from cloud top to base, depending on the updraft velocity. At low up-draft velocities (cm s−1), the particles tend to have size sort-ing with height, with more pristine shapes near the cloud top and more complex shapes near cloud base because the par-ticles grow, gain mass, fall through the cloud, and begin to sublimate as they encounter warmer temperatures. As updraft velocities approach m s−1or higher, large particles may be present near cloud top.
Baran (2009) showed images of ice particles from a Cloud Particle Imaging (CPI) probe that are representative of the ice seen in midlatitude and tropical cirrus (ice) clouds. At cloud top, some of the particles seen in the images are small and irregularly shaped, along with a few columns, bullets, and other habits. The abundance of small ice particles may be due to the shattering of large ice particles on the probe in-let, artificially increasing the number of small particles seen in the images (Korolev et al., 2011). Compact aggregates and spatial bullet rosettes are also seen and tend to be more common in the midlatitudes (Um and McFarquhar, 2007). Some of the particles observed by the CPI probe appear to have hollow structures, a feature noted by Magono and Lee (1966), Schmitt and Heymsfield (2007), Baran (2012), and Yang et al. (2008c, specifically, the photograph by Steven Warren shown in Fig. 1 of this reference).
Other types of instruments may be used infer the shapes of ice cloud particles, including the forward scattering spectrometer probe (FSSP), cloud and aerosol spectrome-ter (CAS), polar nephelomespectrome-ter, and the cloud integrating nephelometer (CIN); see Baumgardner et al. (2011) for an overview of the different measurement techniques. The CAS instrument uses a focused laser beam to measure the scatter-ing pattern of an ice particle and infer its shape based on theoretical scattering calculations. For measurements from July 2002 of a cirrus cloud, Baumgardner et al. (2005) found that 90 % of their observations could be explained with a model consisting of bullet rosettes, plates, and columns.
Surface roughness has been observed in laboratory mea-surements of ice and from in situ meamea-surements obtained in field campaigns (Korolev et al., 2011; Um and McFarquhar, 2007; Baumgardner et al., 2005, 2011; Neshyba et al., 2013). Thermodynamic conditions influence whether an ice particle is roughened and how rough it becomes (Baran et al., 2011), but it is currently unknown what percentage of ice particles in clouds might be roughened or how rough they are. The numerical treatment of surface roughening may be thought of as a surrogate for other imperfections in an atmospheric ice particle that include occlusions, impurities, air bubbles, and internal fractures. Nevertheless, observations from the PARASOL satellite indicate that a high percentage of ice
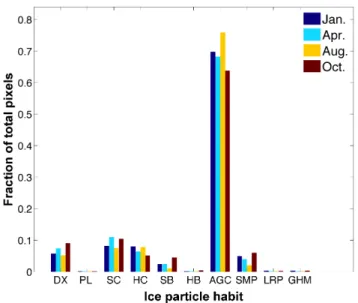
Fig. 1.Global inferred ice habit from four different months, shown as a histogram of the fraction of total pixels assigned as one of the 9 single habits or habit mixture. Results are for ice cloud pixels over ocean. DX=droxtal, PL=plate, SC=solid column, HC=hollow column, SB=solid bullet rosette, HB=hollow bullet rosette, AGC=compact aggregate of columns, SMP=5 member spatial aggregate of plates, LRP=10-member spatial aggregate of plates, and GHM= general habit mixture.
clouds have at least some roughness. Any roughness present will affect the radiative properties of ice clouds by changing the scattering phase function, resulting in less forward scat-tering and a lower value of the asymmetry parameterg(van Diedenhoven et al., 2012a).
The studies by Chepfer et al. (1998, 2001) showed that polarized reflectivities from an ice cloud are sensitive to the ice particle habit. Subsequent studies tested various habits for their fit to measured polarized reflectivity (C.-Labonnote et al., 2001; Cole et al., 2013). Columns that included air bub-bles (the “inhomogeneous hexagon model”, or IHM) were found to provide the best match for a single ice shape in the studies by Labonnote et al. (2001) and Baran and C.-Labonnote (2007), whereas a mixture of severely roughened ice habits was found to have the best fit in Cole et al. (2013). In contrast to previous studies that qualitatively compared simulated polarized reflectivity to measured polarized reflec-tivity, this study employs a rigorous retrieval method to quan-titatively select the best fit ice habit from the nine ice habits available in the database and a combination of habits called the general habit mixture (GHM) (Cole et al., 2013). Upon retrieving the ice particle habit and roughness, the asymmetry parametergis derived from single-scattering calculations.
al. (2012a) and the current study is that the lookup table in the current study contains 10 pre-defined geometries instead of a wide range of different aspect ratios.
Ice asymmetry parameters have been inferred from flux measurements and derived from theoretical modeling (Stephens et al., 1990; Platt et al., 1980) with values rang-ing between 0.7 and 0.85. In situ measurements have yielded values near 0.75 using cloud integrating nephelometer and polar nephelometer instruments (Garrett et al., 2005; Gayet et al., 1997; Gerber et al., 2000); however; in situ measure-ments generally have limited spatial and temporal resolution. Global retrievals of ice particle habit and roughness from PARASOL and subsequent retrieval of the inferred asymme-try parameter can overcome the limited nature of in situ stud-ies and provide a comprehensive perspective on the asymme-try parameter value in ice clouds.
The goal of the current research is to rigorously retrieve the ice particle habit and degree of surface roughness us-ing polarized reflectivity data from the PARASOL satellite and model output from full-vector adding–doubling radiative transfer simulations. These retrievals will be performed for global data from one full day of data selected from four dif-ferent months of the year. In addition, retrievals for a range of latitudes will be examined to investigate the sufficiency of a single global ice cloud model in climate simulations, or whether more accurate results might be obtained by assum-ing different cloud microphysics at different latitudes.
2 Data and methodology
2.1 Adding–doubling radiative transfer model
A full vector adding–doubling radiative transfer model de-veloped by de Haan et al. (1987) is used to simulate the top of atmosphere Stokes vector for a wide range of input cloud optical thicknesses, viewing geometries, and microphysical parameters. This model has been validated against the tables for Rayleigh scattering given by Natraj et al. (2009) and is accurate to at least six decimal places for all viewing geome-tries. This adding–doubling model has been widely used and verified in the literature (Chepfer et al., 1998, C.-Labonnote et al., 2001, van Diedenhoven et al., 2012a). In addition, Kokhanovsky et al. (2010) presented results comparing sev-eral radiative transfer codes for the case of a highly peaked phase function. All codes provided similar results, including a modified adding–doubling technique.
The wavelength used for all simulations is 0.865 µm. The US Standard Atmospheric Profile (1976) is used in the sim-ulations, with a total Rayleigh scattering optical thickness of 0.01587 for the 0.865 µm PARASOL band. All simulations are performed for a single-layer ice cloud above an ocean surface.
2.2 PARASOL satellite data
PARASOL is a French microsatellite that was launched in 2004 to study the radiative and microphysical properties of clouds and aerosols and improve understanding of the cli-mate system. The instrument onboard is a wide-field imaging radiometer/polarimeter named POLDER (POLarization and Directionality of the Earth’s Reflectances), capable of mea-suring theI,Q, andUStokes parameters at up to 16 viewing angles for each pixel (Deschamps et al., 1994). The Level-2 data are used in this study, a product that includes other pa-rameters of interest besides the Stokes papa-rameters including surface type, percentage cloud cover, optical thickness, and thermodynamic phase. The Level-2 products are provided for 3×3 pixels, or 18 km×18 km, which is three times the nom-inal pixel resolution of 6 km. The Level-2 resolution is used to minimize potential noise due to misregistration of multian-gle observations that can occur for an elevated target such as ice clouds. The PARASOL Level-2 cloud data are filtered for use in this study using the following criteria: the cloud must be ice phase, located over the ocean, have 100 % cloud cover, and have at least seven viewing geometries available cover-ing a scattercover-ing angle range of at least 50◦. This ensures that features in the scattering pattern over a large range of angles will be resolved in the retrieval method. Measurements in the sunglint region are excluded because the polarization contri-bution is large and would overwhelm a polarization signal from an ice cloud.
The PARASOL Level-1 data are produced by CNES (Cen-tre National d’Etudes Spatiales), and Level-2 products are produced at the ICARE Data and Services Center (http: //www.icare.univ-lille1.fr). The parameters used in this study are percentage cloud cover, surface type, optical thickness, thermodynamic phase, and normalized, modified, polarized reflectivity at 0.865 µm. The normalized, modified, polarized reflectivity is defined in the following way:
Lnmp(θv, φv, θs, φs)= π Lp
Es
cosθs+cosθv cosθs
, (1)
where subscript s is for the solar zenith angle, and subscript v is for the viewing angle.Esis the incident solar irradiance at the top of the atmosphere.Lpis the linearly polarized ra-diance, defined as
Lp= ± p
Q2+U2. (2)
The sign of Lp is determined as in C.-Labonnote et al. (2001). To compare satellite measurements with model-ing results, the addmodel-ing–doublmodel-ing radiative transfer model pro-duces Stokes parameters for the simulated ice cloud and cal-culates the polarized reflectivities in the same form as pro-vided by PARASOL. The satellite observations and the sim-ulated results can then be used in the inference of ice habit and roughness.
the satellite data are analyzed for each day. After applying the necessary filters, about 50 000–70 000 pixels are available for analysis from each of the selected days for use in comparison studies with modeled simulations.
2.3 Ice cloud bulk scattering properties
The simulations of polarized radiation from an ice cloud re-quire an assumption of a set of single-scattering properties. These single scattering properties are calculated at 0.86 µm for nine different ice habits plus GHM and nine levels of surface roughness from σ=0 (no roughness) to σ=0.8 (severely rough). The nine habits are droxtals, solid and hol-low columns, solid and holhol-low 3-D bullet rosettes, plates, a compact aggregate of columns, and a small and large spa-tial aggregate of plates.
The method for simulating the surface roughness is to ran-domly tilt the facet of the ice particle, with the parameter σ describing the level of roughness (Macke et al., 1996; Yang and Liou, 1998; Shcherbakov et al., 2006; Baran and C.-Labonnote, 2007). The calculations are performed for ice crystals with maximum diameters between 2 and 10 000 µm (Yang et al., 2013). The calculations are provided by the ADDA (Amsterdam Discrete Dipole Approximation, Yurkin and Hoekstra 2011) and the IGOM (Improved Geometric Optics Method, Yang et al., 2013) methods and the results are stored in a database and then used to calculate the bulk scattering properties. As shown in Baum et al. (2005, 2011), the bulk scattering properties are obtained by averaging over a particle size distribution, instrument spectral response func-tion, solar spectrum, and any habit distribution (none if con-sidering a single habit).
For both the single habits and the GHM, the bulk scattering properties are produced using a database of over 14 000 par-ticle size distributions measured by various field campaigns (Baum et al., 2011). The effective diameter is calculated for each size distribution, and the scattering phase matrix, asym-metry parameter, and other single scattering properties are calculated. The result is a large database of scattering proper-ties as a function of effective diameter. Since single scattering properties are desired for regular intervals of effective diam-eter, the results in the database that fall into predetermined size bins are averaged together to produce a set of scattering properties for a given effective diameter. Three effective di-ameters (30, 60, and 90 µm) will be used in this study, but a significant size dependency in the results is not expected be-cause the wavelength being used (0.865 µm) is fairly insen-sitive to particle size. However, most of the habits included in this study have aspect ratios that change with the size of the particle, with the exception being the compact aggregate of solid columns. This could introduce some variation in the polarized reflectivity as the size changes because the aspect ratio has changed (van Diedenhoven et al., 2012a).
As an example, the average single scattering phase matrix can be computed in the following way (Baum et al., 2011;
Cole et al., 2013):
P (2)= (3)
Rλ2
λ1
RDmax
Dmin
M P h=1
Ph(2, D, λ)σs, h(D, λ)fh(D)
Fs(λ)S(λ)n(D)dDdλ
Rλ2
λ1
RDmax
Dmin
M P h=1
σs, h(D, λ)fh(D)
Fs(λ)S(λ)n(D)dDdλ
,
whereσs indicates the scattering cross section,Dis the par-ticle maximum diameter, n(D)is the density, Fs(λ) is the spectral response function (SRF), andS(λ)is the solar irra-diance. The sum over h is considered in this study for the mixture of ice crystal habits (specifically, GHM); for a sin-gle habit this term is not needed. The habit fractionfh(D)is defined in the following way:
XM
h=1fh(D)=1, (4)
whereM is the number of habits. The other scattering pa-rameters of interest are determined in a similar fashion.
Because the scattering phase function for ice tends to be strongly peaked in the forward direction, the δ-fit trunca-tion method developed by Hu et al. (2000) is employed to truncate the forward scattering peak so that number of radi-ation streams can be substantially reduced in the radiative transfer simulations involved in this study. For this study, 36 streams are used, which gives an adequate representa-tion for ice clouds (Ding et al., 2009). The other phase ma-trix elements are normalized by the truncated phase function, and other scattering parameters of interest including optical thickness and asymmetry parameter are adjusted according to the similarity principle (Joseph et al., 1976).
2.4 Retrieval lookup table and methodology
Several previous studies have tried to infer ice shape from po-larization measurements. Chepfer et al. (2001) was one of the first efforts to use polarized reflectivities with a variety of ice models to try to find a best match to observations. Baran and C.-Labonnote (2006) took the same approach for a greater variety of ice models. In all cases ice particle models that had some kind of inclusion or roughening better matched mea-sured polarized reflectivities.
toσ =0.8 in 0.05 increments, for all nine ice habits and the GHM. All simulations are performed with an optical thick-ness value of 5 so that the polarized reflectivities are saturated (van Diedenhoven et al., 2013).
In all, 10 different habit assumptions and 17 roughness val-ues are considered, for a total of 170 combinations. A range of different viewing geometries are assumed for each combi-nation to reproduce the PARASOL observations. Solar zenith angles from 0 (nadir) to 80◦in 4◦increments are used, along with viewing zenith angles ranging from 0–75◦in 4◦ incre-ments and relative azimuth angles from 0–180◦in 4◦ incre-ments. This encompasses the viewing geometries typically seen from PARASOL (Breon, 2009).
The quantity to be minimized in the retrieval algorithm is the relative root mean square error (RRMSE) (van Dieden-hoven et al., 2012a) defined as
RRMSE= v u u u t
J P
j=1
h
1−Lnmp(sim)(2j,h,σ ) Lnmp(PAR)(2j,h,σ )
i2
J . (5)
Herehis habit,σ is level of roughness, andθ is scattering angle.Lnmpis the normalized, modified, polarized reflectiv-ity (see Eq. 1).
When a pixel is analyzed, the first step is to read the optical thickness from the PARASOL Level-2 data file and proceed only if the optical thickness is > 5 so that the polarized reflec-tivity is saturated. Then the viewing geometries are read in for up to a maximum of 16 viewing directions. For each set of viewing angles, the polarized reflectivity is calculated for ev-ery possible combination of habit and roughness in the LUT. The retrieval approach in this study is based on the 3×3
pixel cloud retrievals provided in the Level-2 products, us-ing up to 16 viewus-ing geometries per cloud sample as a sus-ingle set from which to find a best fit for ice habit and roughness. The viewing geometries provided in the Level-2 product are for the central pixel in the 3×3 set.
Once the polarized reflectivity for all possible combina-tions of habit and roughness have been calculated based on the LUT for all viewing geometries in the pixel, the RRMSE is calculated for each of the combinations. The habit and roughness associated with the smallest value of the RRMSE are considered to be the retrieved values. This procedure is repeated for all pixels in the PARASOL data set to give a global data set of retrieved habit and roughness.
3 Results
3.1 Ice habit retrieval
The retrieval algorithm minimizes the difference between the observed polarized reflectivities from PARASOL and the simulations. First, the optical thickness must be at least five so that the polarized reflectivity is saturated. Subsequently
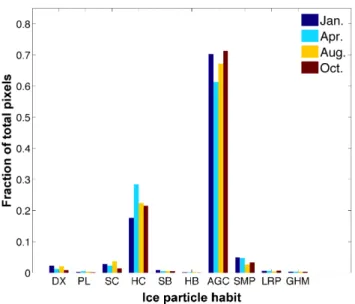
Fig. 2.Ice habit inferred in tropical regions for data from four dif-ferent months, shown as a histogram of the fraction of total pixels assigned as one of the 9 single habits or general habit mixture de-fined in Fig. 1.
the simulated polarized reflectivity is calculated for all pos-sible combinations of habit and roughness. The smallest RRMSE corresponds to the retrieved habit and roughness.
The output from the retrieval is a data set consisting of the retrieved ice particle habit and surface roughness for each pixel in the PARASOL data set. Four different months of data are considered with one full day of global observations over ocean for each month. The days are 1 January, 1 April, 1 August, and 15 October 2007. The number of retrieved pixels for each month is between 50 000 and 70 000.
The tropics are defined as less than 30◦ north or south latitude, the midlatitudes are defined as 30–60◦N and 30– 60◦S, and the polar regions are defined as latitudes>60◦. Because of restraints on surface type, scattering angle, and orbital characteristics, most of the observed PARASOL pix-els are from the midlatitudes.
Figure 1 shows the percentage of each ice habit inferred from PARASOL data for different months of the year. The results are provided for an effective ice particle diameter of 60 µm. This is nearly the mean effective diameter retrieved for ice from MODIS (Mace et al., 2005). The ordinate is the fraction of total pixels, and the abscissa shows the 9 indi-vidual ice habits and the GHM that are considered in the re-trieval. The aggregate of columns dominates as the preferred habit in 65–75 % of pixels for each month. Solid columns and hollow columns contribute another 15–20 %, with small fractions also of solid 3-D bullet rosettes and a 5-element spatial aggregate of plates. None of the other habits is cho-sen in a significant number of pixels.
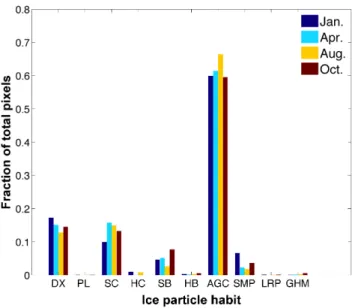
Fig. 3.Ice habit inferred for data from four different months in mid-latitude regions only, shown as a histogram of the fraction of total pixels assigned as one of the 9 single habits or general habit mixture defined in Fig. 1.
Fig. 4.Ice habit inferred for data from four different months in polar regions only, shown as a histogram of the fraction of total pixels as-signed as one of the 9 single habits or general habit mixture defined in Fig. 1.
the polarization signature of the retrieved habit in the lookup table. There are many possible ice habits not included in the lookup table and it is useful to note that an ice cloud scene retrieved as a particular habit may not be composed of those ice particles, but only has polarization properties similar to the retrieved habit. The inferred habit has a latitudinal de-pendence. Figure 2 shows results for the tropics, defined as 30◦N–30◦S. Two habits dominate, the compact aggregate of
Fig. 5.Ice habit inferred for three effective diameters from global data recorded on 1 August 2007. The histogram provides the frac-tion of total pixels assigned as one of the 9 single habits or general habit mixture defined in Fig. 1
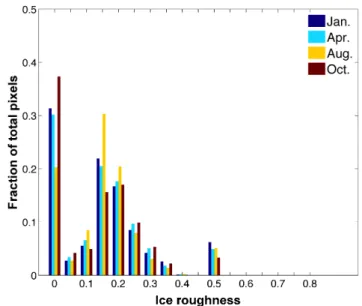
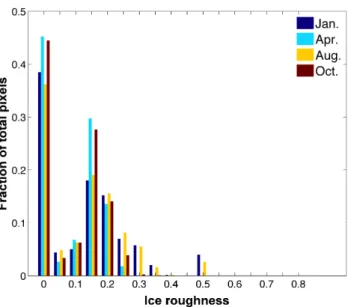
Fig. 6.The ice roughness inferred from global data over ocean from four different months, shown as the fraction of total pixels assigned one of the 17 values of roughness considered in the retrieval process. The roughness parameter ranges from 0 (smooth) to 0.8 (extremely rough).
columns and hollow columns. Aggregates comprise the same fraction of the total retrievals at 60–70 %. Hollow columns are 20 % or slightly more for most months and the 5-element aggregate of plates is less than 5 % in all cases.
Fig. 7.As in Fig. 6 but for the tropics only.
columns dominating, though in the polar regions the percent-age falls to 60 % or slightly below. Droxtals make up a larger fraction of the retrieved habit for PARASOL pixels located in polar regions, from 15 % to nearly 20 % for data from Jan-uary. Note that a habit is chosen when the differences are minimized between measured and simulated polarized re-flectivities on a pixel level using up to 16 viewing geometries per pixel, regardless of whether the habit may be a realistic choice from a microphysical perspective.
To investigate the sensitivity of the retrieval of habit to the ice effective diameter, Fig. 5 shows the retrieved habit for three different effective diameters: 30, 60, and 90 µm. 30 µm is smaller than the mean ice effective diameter retrieved from MODIS, 60 µm is near the mean, and 90 µm is larger. The PARASOL global data set from 1 August 2007 was used for this case. Little sensitivity to size is indicated, as expected at this 0.86 µm wavelength with little absorption within the ice particles. Additionally, with PARASOL data from 1 Jan-uary 2007, our analysis results in nearly the same habit frac-tions for each of the ice effective diameters.
3.2 Inference of ice roughness
The global retrieval of ice roughness for an effective diame-ter of 60 µm is presented in Fig. 6. About 20–30 % of pixels return as smooth (i.e., no ice surface roughness present), with the rest having a distribution centered near a roughness value ofσ=0.2, although another peak is present atσ=0.5. The data from August have the fewest pixels retrieved as smooth with 20 %, whereas October has the most at nearly 35 %.
Significant differences are seen when separating results for ice roughness by latitude. Pixels in the tropics as seen in Fig. 7 are smooth 5–10 % of the time depending on month, and a large fraction of pixels (25–40 %) are retrieved
Fig. 8.As in Fig. 6 but for midlatitude regions only.
at a roughness value of σ=0.5. The same distribution of roughness is seen at smaller roughness values, though the center shifts toward higher roughness atσ=0.25.
When roughness in the midlatitudes is considered as shown in Fig. 8, the distribution of roughness decreases to σ=0.15, and 20–40 % of pixels return as smooth. The frac-tion of smooth pixels varies considerably between August and October, which could indicate that smooth particles have a seasonal dependence, or could simply mean that the frac-tion of smooth pixels varies for other unknown reasons. The ice roughness in polar regions as seen in Fig. 9 again has a distribution centered nearσ=0.15, but even more pixels are retrieved as smooth, in about 35–45 % of the total.
Retrieved ice roughness has more of a dependence on the ice effective diameter. For PARASOL data from 1 Au-gust 2007, Fig. 10 indicates that especially at a roughness value ofσ =0.5, changing the effective diameter from 30 µm to 90 µm decreases the fraction of pixels that will be retrieved at that roughness value and shifts these retrievals to lower roughness. For 1 January 2007 PARASOL data, the analysis shows the same shifting of roughness. Some of the size de-pendency of the retrieved roughness may be due to the chang-ing aspect ratio of the ice particle as its size increases. All of the ice habits in the lookup table have varying aspect ratios as a function of maximum diameter except for the compact aggregate of solid columns.
Fig. 9.As in Fig. 6 but for polar regions only.
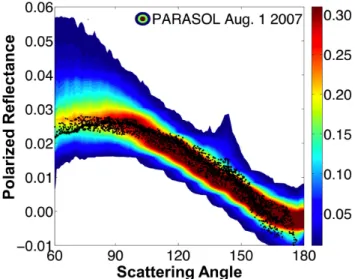
the outliers in the PARASOL data at scattering angles of 60– 90◦are not replicated in the simulations. The same mismatch at small scattering angles is also seen in previously published results (Knap et al. 2005; Baran and Labonnote, 2006; Cole et al. 2013). It should be possible with a large enough re-trieval database to span the entire range of the PARASOL observations, so it is possible the database is too limited. Though Figure 11 provides a good match to PARASOL po-larized reflectivities, it is likely that many combinations of habit and roughness could provide a similar match to PARA-SOL data. The results of the retrieval algorithm for the mean and median ice roughness are summarized in Table 1. The mean retrieved roughness varies between aσ value of 0.15 and 0.25, while the median roughness is consistently a σ value of 0.15 or 0.2. Mean retrieved roughness is larger if a smaller ice effective diameter is assumed in simulations, while the median roughness is the same for all four months of data no matter which effective diameter is used in simula-tions.
3.3 Inference of asymmetry parameter
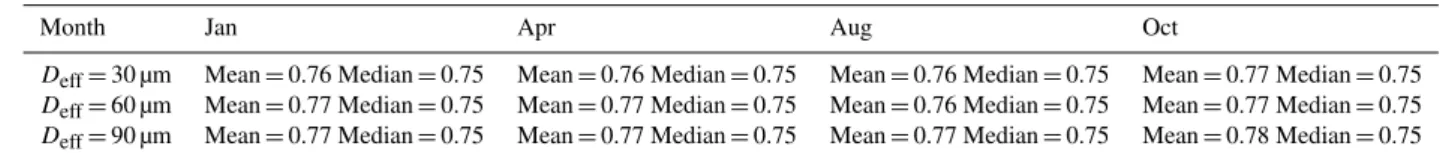
Upon retrieving the ice particle roughness and habit and as-suming an effective diameter, the ice asymmetry parameterg is obtained from single-scattering calculations. The asymme-try parameter is a measure of the relative amounts of forward and backward scattering, with complete forward scattering represented by a g value of 1 and lower values indicating more backscattering. Table 2 provides values for the retrieved asymmetry parameter for all four days of data and three ef-fective diameters. Mean values for all cases are near 0.77, while median values are slightly lower near 0.75. The mean asymmetry parameter increases if the assumed effective di-ameter increases, while the median value decreases slightly.
Fig. 10.Ice roughness inferred for 3 effective diameters from data recorded on 1 August 2007, with roughness defined as in Fig. 6.
4 Summary
In this study an adding–doubling radiative transfer model is used to simulate the polarized reflectivity at 0.865 µm ob-served at the top of the atmosphere for nine different ice habits and a general habit mixture. The simulations are per-formed for 17 different roughness values over the entire range of viewing geometries observed by the PARASOL in-strument, and the results are stored in a lookup table for use in a retrieval algorithm. The retrieval method employed here is similar to van Diedenhoven et al. (2012a), with the major difference being the varying aspect ratios used in the retrieval lookup table in van Diedenhoven et al. (2012a).
Retrievals of ice particle shape and roughness from satel-lite measurements of polarized reflectivity are performed by minimizing the differences between simulated polarized re-flectivity and the PARASOL measurements at up to 16 view-ing geometries for each PARASOL pixel. Retrievals are per-formed for four days of global data over ocean from four different months of the year. Each day of data contain be-tween 50 000 and 70 000 pixels after filtering by cloud phase and ensuring that there are sufficient viewing geometries for each pixel.
Table 1.Mean and median retrieved ice roughness for all 4 days of data and three effective diameter sizes.
Month Jan Apr Aug Oct
Deff=30 µm Mean: 0.25 Median: 0.2 Mean: 0.2 Median: 0.15 Mean: 0.25 Median: 0.15 Mean: 0.25 Median: 0.15 Deff=60 µm Mean: 0.2 Median: 0.2 Mean: 0.15 Median: 0.15 Mean: 0.2 Median: 0.15 Mean: 0.15 Median: 0.15 Deff=90 µm Mean: 0.2 Median: 0.2 Mean: 0.15 Median: 0.15 Mean: 0.2 Median: 0.15 Mean: 0.15 Median: 0.15
Table 2.Retrieved values of the asymmetry parametergfor all 4 months of data and three effective diameter sizes considered.
Month Jan Apr Aug Oct
Deff=30 µm Mean=0.76 Median=0.75 Mean=0.76 Median=0.75 Mean=0.76 Median=0.75 Mean=0.77 Median=0.75
Deff=60 µm Mean=0.77 Median=0.75 Mean=0.77 Median=0.75 Mean=0.76 Median=0.75 Mean=0.77 Median=0.75
Deff=90 µm Mean=0.77 Median=0.75 Mean=0.77 Median=0.75 Mean=0.77 Median=0.75 Mean=0.78 Median=0.75
and “severe” surface roughness values (0.03, 0.50) reported in the literature (Cole et al., 2013; Yang et al., 2008a, b).
The inferred roughness varies considerably depending on latitude. If PARASOL data are considered from only the tropics (30◦N–30◦S), smooth ice particles are retrieved in only 5–10 % of the data, depending on month. Severely roughened ice (σ =0.5) is inferred in approximately 30– 40 % of the data. For midlatitude data, smooth ice is in-ferred in 20–40 % of the data, while for polar regions the inference of smooth particles can reach 45 %. The small amount of smooth ice in the tropics may be due to differ-ent dynamical processes generating the ice clouds. Most of the ice clouds in the tropics are associated with deep con-vection (Baran, 2009). In situ studies have found aggregates are common in deep convective ice clouds (Um and McFar-quhar, 2007), and the riming processes within the thunder-storm anvil may be contributing to the surface roughness measured for pixels in the tropics (Baran et al., 2011). Van Diedenhoven et al. (2012b) examined POLDER measure-ments above deep convection and found that the polarized reflectivity of cold clouds were consistent with rough com-pact crystals with an asymmetry parameter of 0.74, while warmer clouds (>−40◦C) were found to be consistent with
rough plate-like particles with larger asymmetry parameters. Ice clouds in the midlatitudes and polar regions are gen-erated more often by synoptic processes, where mixed-phase riming would be less likely and the ice forms at colder tem-peratures. Smooth ice tends to form when the temperature is very low (Ulanowski et al., 2006).
The retrieved habit does not depend on the ice effective di-ameter used in the simulations, which is expected since po-larization has little dependence on the ice particle size. How-ever, the inferred roughness does have some dependence on ice size, especially for larger values of roughness. This size dependency of the retrieved roughness may be due to the fact that the aspect ratios of most of the ice habits in the lookup table vary as a function of maximum diameter. One way of mitigating this issue is to adopt a retrieval algorithm that in-corporates infrared wavelengths to determine the ice
parti-cle effective diameter before proceeding with a retrieval of roughness using polarization. This approach may be useful for further studies. However, because the dependence is not strong, retrievals using an average value for ice effective di-ameter should not have large errors in retrieved roughness.
Various field campaigns have noted that aggregates are a very common ice habit, especially near deep convection (Baran et al., 2011; Garrett et al., 2005). Van Diedenhoven et al. (2013) found that ice which had a low asymmetry pa-rameter and high distortion best matched measurements from the research scanning polarimeter (Cairns et al., 2003) instru-ment. Collocated in situ probes indicated a high level of ag-gregate ice particles, indicating a low asymmetry parameter below 0.8.
The compact aggregate of columns has the lowest asym-metry parameter values among the 9 habits and the GHM considered in the present study. Because aggregates are the most commonly retrieved habit, the retrieved asymmetry parameter should also be low. The asymmetry parameter for all data considered has a mean value near 0.77 for all months, with a median value closer to 0.75. Van Dieden-hoven et al. (2013) report retrieved asymmetry parameter val-ues of between 0.76 and 0.8 with a median value of 0.78, so the asymmetry parameter retrieved in this study is slightly lower but still comparable. However, other results in the lit-erature report asymmetry parameters of about 0.73 (Gerber et al., 2000), slightly lower than the values from the present study.
It is important to note that the surface roughness in the present model cannot be related to any physical size, and as such it is difficult to compare the retrieved roughness to in situ measurements of ice roughness. These retrieval results can, however, serve as a guide for ice model development with the goal of reducing uncertainties in the description of the radiative properties of ice clouds.
Fig. 11.Polarized reflectivities simulated for the “best” combination of the retrieved habits and roughnesses calculated for data recorded on 1 August 2007. The polarized reflectivities were calculated for the habit and roughness value inferred for each of the 16 available PARASOL pixel directions. The effective diameter is 60 µm. Color contours are density of PARASOL polarized reflectivity observa-tions, and black dots are simulations. Each dot represents a calcu-lation of the resulting polarized reflectivity for a single viewing ge-ometry.
roughness values, such as in Fig. 11 or the general habit mix-ture (Cole et al., 2013), provide consistent comparisons with PARASOL polarized reflectivity over a wide range of scatter-ing angles. Based on the results of this study, a sscatter-ingle-habit ice model that best captures the polarization properties on a global scale of the large majority of ice cloudy scenes over ocean observed by PARASOL is the compact aggregate of columns with a roughness value ofσ=0.2.
Acknowledgements. We thank the ICARE Data and Services
Center for providing access to the data used in this study, and for the software used in the data processing. Bryan Baum and Ping Yang also gratefully acknowledge the support from NASA grants NNX11AR06G and NNX11AF40G. We also thank the referees for their careful reviews of this manuscript.
Edited by: B. Mayer
References
Baran, A. J.: A review of the light scattering properties of cirrus, J. Quant. Spectrosc. Radiat. Transfer, 110, 1239–1260, 2009. Baran, A. J.: From the single-scattering properties of ice crystals
to climate prediction: a way forward, Atmos. Res., 112, 45–69, 2012.
Baran, A. J. and C.-Labonnote, L.: On the reflection and polariza-tion properties of ice cloud, J. Quant. Spectrosc. Ra., 100, 41–54, 2006.
Baran, A. J. and C.-Labonnote, L.: A self-consistent scattering model for cirrus, I: The solar region, Q. J. Roy. Meteor. Soc., 133, 1899–1912, 2007.
Baran, A. J., Connolly, P. J., Heymsfield, A. J., and Bansemer, A.: Using in situ estimates of ice water content, volume extinction coefficient, and the total solar optical depth obtained during the tropical ACTIVE campaign to test an ensemble model of cirrus ice crystals, Q. J. Roy. Meteor. Soc., 137, 199–218, 2011. Baum, B. A., Yang, P., Heymsfield, A. J., Platnick, S., King, M. D.,
and Bedka, S. T.: Bulk scattering models for the remote sensing of ice clouds. Part 2: Narrowband models, J. Appl. Meteorol., 44, 1896–911, 2005.
Baum, B. A., Yang, P., Heymsfield, A. J., Schmitt, C., Xie, Y., Bansemer, A., Hu, Y.-X., and Zhang, Z.: Improvements to short-wave bulk scattering and absorption models for the remote sens-ing of ice clouds, J. Appl. Meteorol. Clim., 50, 1037–1056, 2011. Baumgardner, D., Chepfer, H., Raga, G. B., and Kok, G. L.: The shapes of very small cirrus particles derived from in situ measurements, Geophys. Res. Lett., 32, L01806, doi:10.1029/2004GL021300, 2005.
Baumgardner, D., Brenguier, J. L., Bucholtz, A., Coe, H., De-Mott, P., and Garrett, T. J.: Airborne instruments to measure at-mospheric aerosol particles, clouds and radiation: a cook’s tour of mature and emerging technology, Atmos. Res., 102, 10–29, 2011.
Breon, F. M.: Parasol Level-2 Product Data Format and User Man-ual. Ed 1 - Rev. 3, 1–32, 2009.
C.-Labonnote, L., Brogniez, G., Buriez, J. C., and Doutriaux-Boucher, M.: Polarized light scattering by inhomogeneous hexagonal monocrystals: validation with ADEOS-POLDER measurements, J. Geophys. Res. 106, 12139–12153, 2001. Cairns, B., Russell, E. E., LaVeigne, J. D., and Tennant, P. M. W.:
Research scanning polarimeter and airborne usage for remote sensing of aerosols, Proc. SPIE, 5158, 33–44, 2003.
Chepfer, H., Brogniez, G., and Fouquart, Y.: Cirrus clouds’ mi-crophysical properties deduced from POLDER observations, J. Quant. Spectrosc. Radiat. Transfer, 60, 375–390, 1998. Chepfer, H., Goloub, P., Riedi, J., de Haan, J. F., and
Hove-nier, J. W.: Ice crystal shapes in cirrus clouds derived from POLDER-1/ADEOS-1, J. Geophys. Res., 106, 7955–7966, doi:10.1029/2000JD900285, 2001.
Cole, B. H., Yang, P., Baum, B. A., Riedi, J., C.-Labonnote, L., Thieuleux, F., and Platnick, S.: Comparison of PARASOL obser-vations with polarized reflectances simulated using different ice habit mixtures, J. Appl. Meteor. Climatol., 52, 186–96, 2013. de Haan, J. F., Bosma, P. B., and Hovenier, J. W.: The adding
method for multiple scattering calculations of polarized light, Astron. Astrophys., 183, 371–391, 1987.
Deschamps, P., Breon, F. M., Leroy, M., Podaire, A., Bricaud, A., Buriez, J. C., and Seze, G.: The POLDER mission: instrument characteristics and scientific objectives, IEEE Trans. Geosci. Rem. Sensing, 32, 598–615, 1994.
Ding, S., Xie, Y., Yang, P., Weng, F., Liu, Q., Baum, B. A., and Hu, Y.-X.: Estimates of radiation over clouds and dust aerosols: optimized number of terms in phase function expansion, IEEE T. Geosci. Remote, 110, 1190–1198, 2009.
Changes in Atmospheric Constituents and in Radiative Forcing, in: IPCC Fourth Assessment Report WG 1, edited by: Solomon, S., Qin, D., Manning, M., Chen, Z., Marquis, M., Averyt, K. B., Tignor, M., and Miller, H. L., Cambridge University Press, Cam-bridge, 129–234, 2007.
Garrett, T. J., Navarro, B. C., Twohy, C. H., Jensen, E. J., Baum-gardner, D. G., Bui, P. T., Gerber, H., Herman, R. L., Heymsfield, A. J., Lawson, P., Minnis, P., Nguyen, L., Poellot, M., Pope, S. K., Valero, F. P. J., and Weinstock, E. M.: Evolution of a Florida Cirrus Anvil, J. Atmos. Sci., 62, 2352–2372, 2005.
Gayet, J. F., Crépel, O., Fournol, J. F., and Oshchepkov, S.: A new airborne polar Nephelometer for the measurements of optical and microphysical cloud properties. Part I: Theoretical design, Ann. Geophys., 15, 451–459, doi:10.1007/s00585-997-0451-1, 1997. Gayet, J.-F., Mioche, G., Shcherbakov, V., Gourbeyre, C.,
Busen, R., and Minikin, A.: Optical properties of pristine ice crystals in mid-latitude cirrus clouds: a case study during CIRCLE-2 experiment, Atmos. Chem. Phys., 11, 2537–2544, doi:10.5194/acp-11-2537-2011, 2011.
Gerber, H., Takano, Y., Garrett, T. J., and Hobbs, P. V.: Nephelome-ter measurements of the asymmetry parameNephelome-ter, volume extinc-tion coefficient, and backscatter ratio in Arctic clouds, J. Atmos. Sci., 57, 3021–3034, 2000.
Guignard, A., Stubenrauch, C. J., Baran, A. J., and Armante, R.: Bulk microphysical properties of semi-transparent cirrus from AIRS: a six year global climatology and statistical analy-sis in synergy with geometrical profiling data from CloudSat-CALIPSO, Atmos. Chem. Phys., 12, 503–525, doi:10.5194/acp-12-503-2012, 2012.
Heymsfield, A. J. and Miloschevich, L. M.: Parameterizations for the cross-sectional area and extinction of cirrus and stratiform ice cloud particles, J. Atmos. Sci., 60, 936–956, 2003.
Hu, Y. X., Wielicki, B., Lin, B., Gibson, G., Tsay, S. C., and Stamnes, K., and Wong, T.: delta-fit: a fast and accurate treatment of particle scattering phase functions with weighted singular-value decomposition least-squares fitting, J. Quant. Spectrosc. Ra., 65, 681–90, 2000.
Joseph, J. H., Wiscombe, W. J., and Weinman, J. A.: Delta-Eddington approximation for radiative flux-transfer, J. Atmos. Sci., 33, 2452–2459, 1976.
Knap, W. H., C.-Labonnote, L., Brogniez, G., and Stammes, P.: Modeling total and polarized reflectances of ice clouds: Evalu-ation by means of POLDER and ATSR-2 measurements, Appl. Optics, 44, 4060-4073, 2005.
Kokhanovsky, A. A., Budak, V. P., Cornet, C., Duan, M., Emde, C., Katsev, I. L., Klyukov, D. A., Korkin, S. V., C-Labonnote, L., Mayer, B., Min, Q., Nakajima, T., Ota, Y., Prikhach, A. S., Rozanov, V. V., Yokota, T., and Zege, E. P.: Benchmark results in vector atmospheric radiative transfer, J. Quant. Spectrosc. Ra., 111, 1931-1946, 2010.
Korolev, A. V., Isaac, G. A., and Hallett, J.: Ice particle habits in Arctic clouds, Geophys. Res. Lett., 26, 1299–1302, doi:10.1029/1999GL900232, 1999.
Korolev, A. V., Emery, E. F., Strapp, J. W., Cober, S. G., Isaac, G. A., Wasey, M., and Marcotte, D.: Small ice particles in tropospheric clouds: fact or artifact? B. Am. Meteorol. Soc., 92, 967–73, 2011. Mace, G. G., Zhang, Y., Platnick, S. E., King, M. D., Minni, S. P., and Yang, P.: Evaluation of cirrus cloud properties derived from MODIS data using cloud properties derived from ground-based
observations collected at the ARM SGP site, J. Appl. Met. Clim., 44, 221–240, 2005.
Macke, A., Mueller, J., and Raschke, E.: Single scattering properties of atmospheric ice crystals, J. Atmos. Sci., 53, 2813–25, 1996. Magono, C. and Lee, C. W.: Meteorological Classification of
Natu-ral Snow Crystals, J. Fac. Sci., Hokkaido University, II, 321–35, 1966.
Natraj, V., Li, K. F., and Yung, Y. L.: Rayleigh scattering in plane-tary atmospheres: corrected tables through accurate computation of X and Y functions, Astrophys. J., 69, 1909–1920, 2009. Nazaryan, H., McCormick, M. P., and Menzel, W. P.: Global
char-acterization of cirrus clouds using CALIPSO data, J. Geophys. Res., 113, D16211, doi:10.1029/2007JD009481, 2008.
Neshyba, S. P., Lowen, B., Benning, M., Lawson, A., and Rowe, P. M.: Roughness metrics of prismatic facets of ice, J. Geophys. Res. Atmos., 118, 3309–3318, 2013.
Platt, C. M. R., Reynolds, D. W., and Abshire, N. L.: Satellite and Lidar observations of the albedo, emittance and optical depth of cirrus compared to model calculations, Mon. Weather Rev., 108, 195–204, 1980.
Schmitt, C. G. and Heymsfield, A. J.: On the occurrence of hollow bullet rosette and column shaped ice crystals in midlatitude cir-rus, J. Atmos. Sci., 64, 4515–4520, 2007.
Shcherbakov, V., Gayet, J.-F., Baker, B., and Lawson, P.: Light scat-tering by single natural ice crystals, J. Atmos. Sci., 63, 1513– 1525, 2006.
Stephens, G. L., Tsay, S. C., Stackhouse, Jr. P. W., and Flatau, P. J.: The relevance of the microphysical and radiative properties of cirrus clouds to climate and climatic feedback, J. Atmos. Sci., 47, 1742–1754, 1990.
Ulanowski, Z., Hesse, E., Kaye, P. H., and Baran, A. J.: Light scat-tering by complex ice-analogue crystals, J. Quant. Spec. Rad. Trans., 100, 382–392, 2006.
Um, J. and McFarquhar, G. M.: Single-scattering properties of ag-gregates of bullet rosettes in cirrus, J. Appl. Meteorol. Clim., 46, 757–775, 2007.
van Diedenhoven, B., Cairns, B., Geogdzhayev, I. V., Fridlind, A. M., Ackerman, A. S., Yang, P., and Baum, B. A.: Remote sensing of ice crystal asymmetry parameter using multi-directional polarization measurements – Part 1: Methodology and evaluation with simulated measurements, Atmos. Meas. Tech., 5, 2361–2374, doi:10.5194/amt-5-2361-2012, 2012a. van Diedenhoven, B., Fridlind, A. M., Ackerman, A. S., and
Cairns, B.: Evaluation of hydrometeor phase and ice properties in cloud-resolving model simulations of Tropical deep convection using radiance and polarization measurements, J. Atmos. Sci., 69, 3290-3314, 2012b.
van Diedenhoven, B., Cairns, B., Fridlind, A. M., Ackerman, A. S., and Garrett, T. J.: Remote sensing of ice crystal asymmetry pa-rameter using multi-directional polarization measurements – Part 2: Application to the Research Scanning Polarimeter, Atmos. Chem. Phys., 13, 3185–3203, doi:10.5194/acp-13-3185-2013, 2013.
Wendisch, M., Yang, P., and Pilewskie, P.: Effects of ice crys-tal habit on the thermal infrared radiative properties and forcing of cirrus clouds, J. Geophys. Res., 112, D08201, doi:10.1029/2006JD007899, 2007.
Yang, P. and Liou, K. N.: Single-scattering properties of complex ice crystals in terrestrial atmosphere, Contr. Atmos. Phys., 71, 223–248, 1998.
Yang, P., Kattawar, G. W., Hong, G., Minnis, P., and Hu, Y. X.: Un-certainties associated with the surface texture of ice particles in satellite-based retrieval of cirrus clouds, Part I: Single scattering properties of ice crystals with surface roughness, IEEE T. Geosci. Remote, 46, 1940–7, 2008a.
Yang, P., Hong, G., Kattawar, G. W., Minnis, P., and Hu, Y. X.: Un-certainties associated with the surface texture of ice particles in satellite-based retrieval of cirrus clouds, Part II: Effect of par-ticle surface roughness on retrieved cloud optical thickness and effective particle size, IEEE T. Geosci. Remote, 46, 1948–1957, 2008b.
Yang, P., Zhang, Z., Kattawar, G. W., Warren, S. G., Baum, B. A., Huang, H.-L., Hu, Y., Winker, D., and Iaquinta, J.: Effect of cav-ities on the optical properties of bullet rosettes: implications for active and passive remote sensing of ice cloud properties, J. Appl. Meteorol. Clim., 47, 2311–2330, 2008c.
Yang, P., Bi, L., Baum, B. A., Liou, K. N., Kattawar, G. W., and Mishchenko, M.: Spectrally consistent scattering, absorp-tion, and polarization properties of atmospheric ice crystals at wavelengths from 0.2 µm to 100 µm, J. Atmos. Sci., 70, 330–347, 2013.
Yi, B., Yang, P., Baum, B. A., L’Ecuyer, T., Oreopoulos, L., Mlawaer, E. J., Heymsfield, A. J., and Liou, K. N.: Influence of ice particle surface roughening on the global cloud radiative effect, J. Atmos. Sci., 70, 2794–2807, 2013.