www.ann-geophys.net/26/2515/2008/ © European Geosciences Union 2008
Annales
Geophysicae
Upper-mesospheric temperatures measured during intense
substorms in the declining phase of the January 2005 solar proton
events
H. Nesse Tyssøy1,2, D. Heinrich1, J. Stadsnes2, M. Sørbø2, U.-P. Hoppe1, D. S. Evans3, B. P. Williams4, and F. Honary5
1Norwegian Defence Research Establishment, Kjeller, Norway 2University of Bergen, Bergen, Norway
3NOAA Space Environment Center, Boulder, USA
4NorthWest Research Associates/Colorado Research Associates Division, Boulder, USA 5Lancaster University, Lancaster, UK
Received: 7 August 2007 – Revised: 19 December 2007 – Accepted: 21 January 2008 – Published: 1 September 2008
Abstract. Temperature measurements from the ALOMAR Weber Na lidar together with cosmic radio noise absorption measurements from IRIS and particle measurements from NOAA 15, 16 and 17 are used to study effects of geomag-netic activity on the polar winter upper-mesospheric temper-ature. On 21–22 January 2005 we have 14 h of continuous temperature measurement with the Na lidar coinciding with strong geomagnetic activity in the declining phase of one of the hardest and most energetic Solar Proton Event (SPE) of solar cycle 23. According to measurements by the imaging riometer IRIS in northern Finland, the temperature measure-ments coincide with two periods of increased cosmic radio noise absorption. Particle measurements from the three satel-lites, NOAA 15, 16 and 17 that pass through and near our region of interest confirm that the absorption events are prob-ably due to particle precipitation and not due to changes in e.g. the electron recombination coefficient.
The measured temperature variation at 85 and 90 km is dominated by a 7.6-h wave with downward phase propaga-tion and a vertical wavelength of approximately 10 km. As-suming that the wave is due to a lower altitude source inde-pendent of the particle precipitation, we do not find any tem-perature modification that seems to be related to the absorp-tion events. The average temperature is larger than expected above 90 km based on MSIS and the monthly mean from falling spheres, which could be due to particle precipitation and Joule heating prior to our measurement period. There is also a possibility that the identified wave phenomenon is an effect of the geomagnetic activity itself. Earlier studies have reported of similar wavelike structures in wind observations made by the EISCAT VHF radar during SPEs, and found it Correspondence to:H. Nesse Tyssøy
conceivable that the wave could be excited by the effect of energetic particles precipitating into the mesosphere.
Keywords. Atmospheric composition and structure (Pres-sure, density, and temperature) – Ionosphere (Ionosphere-atmosphere interactions; Particle precipitation)
1 Introduction
The upper mesosphere and lower thermosphere are the least known regions in our atmosphere when considering the ergy budget. A large number of parameters influence the en-ergy balance. Electromagnetic radiation from the sun, par-ticle precipitation, Joule heating, atmospheric waves, winds, turbulence, chemical reactions, infrared cooling, photoelec-trons and heat conduction do all play an important part in the cooling and heating processes. The energy balance gets even more complicated when considering their internal in-teractions, and that some of the processes are able to heat the atmosphere as well as to cool it, depending on the specific conditions present (Offermann, 1985; Roble, 1995).
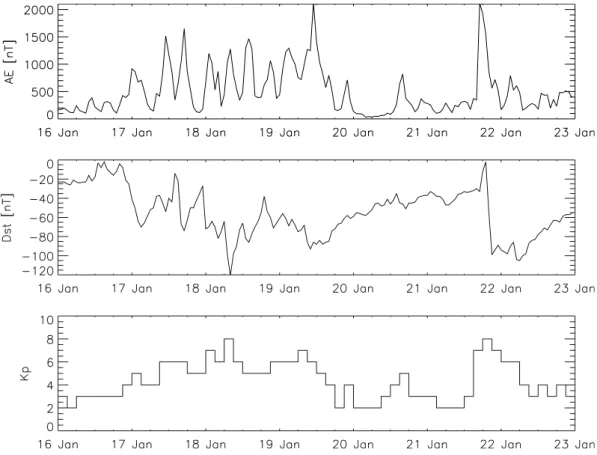
Fig. 1.Hourly AE andDst (upper and middle plot), and 3-hourlyKp(bottom plot) for the period from 16–22 January 2005.
impact on the upper and middle atmosphere due to highly energetic particles precipitating in the atmosphere (Banks, 1979; Jackman and McPeters, 1985; Roble et al., 1987; Reid et al., 1991; Zadorozhny et al., 1994; Jackman et al., 1995, 2007; Krivolutsky et al., 2006). These studies are mostly based on model calculations that use measurements of e.g. particle fluxes and electric fields, and not actual temperature measurements. There is also a group of studies suggesting a temperature enhancement associated with SPEs or other par-ticle precipitation events partly based on observations of the disappearance of noctilucent clouds and polar mesospheric summer echoes during SPEs (Kubo et al., 2003; von Savi-gny et al., 2007), or observations of enhanced upward winds in the upper mesosphere or lower thermosphere (Peterherych et al., 1985; Price and Jacka, 1991). Efforts to measure the temperatures directly during SPEs have been made by e.g. Zadorozhny et al. (1994). Based on rocket measurement they found a temperature decrease from the stratopause up to ap-proximately 70 km. The Microwave Limb Sounder onboard the Aura satellite detected a temperature increase at 85 km altitude coinciding with the January 2005 SPE (von Savigny et al., 2007). Pancheva et al. (2007) found a significant tem-perature drop of approximately 25 K, detected by the meteor radar at Andenes at an altitude of about 90 km during one of the October 2003 SPEs. The contradictory results in the up-per mesosphere may be due to the complexity of the energy
budget. Additionally, there are very few studies where both the upper mesospheric temperature and the local particle pre-cipitation are observed.
On 16 January 2005 a series of Solar Proton Events (SPEs) began. A SPE starts as emission of high energy charged par-ticles on the surface of the sun associated with solar flares and coronal mass ejections (CME). Energetic particles are also generated in the interplanetary medium by interactions with shocks. The particle flux is dominated by protons, ac-companied by heavier ions and electrons. Guided by the in-terplanetary and Earth’s magnetic field, the energetic parti-cles precipitate their energy in both the upper and middle atmosphere in the polar cap and the auroral zone. The X7 flare and CME on 20 January marked the start of the so far hardest and most energetic SPE of Cycle 23. The>10 MeV proton flux peaked on 20 January UTC and showed an en-hanced level until about 18:00 UT 22 January. Additionally, the declining phase of the SPE (21–22 January) is accompa-nied by an intense geomagnetic storm and strong substorm activity. The 3-hourlyKp index was 7 and 8 late on 21 Jan-uary accompanied by strong deflection in both theDst and AE index as shown in Fig. 1.
combining particle measurements on board NOAA 15, 16 and 17 together with cosmic radio noise absorption observa-tions by the Imaging Riometer for Ionospheric Studies (IRIS) in Kilpisj¨arvi, Finland. These measurements give us a valu-able opportunity to search for possible temperature effects caused by particle precipitation during a relatively strong ge-omagnetic event. Since very few studies consider simulta-neous observations of both upper mesospheric temperature and local particle precipitation, the following analysis is im-portant for our understanding of the energy budget in this re-gion. The instrumentation used is presented in Sect. 2, while the measurements and associated discussion are presented in Sect. 3. In Sect. 4 we will evaluate possible theories explain-ing our results.
2 The instrumentation
2.1 The ALOMAR Weber Na lidar
The ALOMAR Weber Na lidar is a sodium (Na) fluorescence lidar (She et al., 2002; Vance et al., 1998; Arnold and She, 2003). This instrument is used to determine the Na density profiles, as well as atmospheric temperature and wind from about 80 to 100 km by remote spectroscopy. The instrument is part of the Arctic Lidar Observatory for Middle Atmo-sphere Research (ALOMAR), located at Andøya in Norway (69.2◦N, 16.0◦E).
The lidar system emits light at three known frequencies in sequential order. A small fraction of the emitted light is resonantly scattered by atmospheric Na atoms, which exist in the mesopause region due to meteor ablation. The measured intensities are fitted to the theoretical shape of the spectrum of theD2atransition of the Na atom, which depends on the atmospheric temperature (Doppler broadening) and the line-of-sight wind (Doppler shift). The Na density is proportional to the ratio of the observed count rates in the Na layer and the Rayleigh reflected signal from the stratosphere (Fricke and von Zahn, 1985; Heinrich et al., 2005).
2.2 IRIS
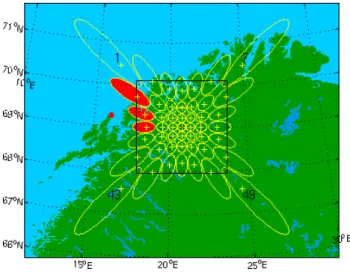
The Imaging Riometer for Ionospheric Studies (IRIS) in Kilpisjarvi in northern Finland (69.05◦N, 20.79◦E) mea-sures ionospheric absorption of cosmic radio noise at 38.2 MHz in 49 beams (Browne et al., 1995). The projection of these beams at 90 km spans the area of 67.8◦–70.2◦N, and 17.8◦–23.8◦E, as seen in Fig. 2. None of the riometer beams overlaps with the ALOMAR Weber Na lidar, but beam 8, 15 and 22 might be representative for the absorption above Andøya.
Cosmic radio noise is of galactic origin and is a known quantity (varying with e.g. location and time of day and year), so that any deviation in the expected signal observed on the ground is due to changes in the ionospheric absorp-tion. There are several sources causing ionization in the
D-Fig. 2. The beam projection for the 49 beams of IRIS at 90 km (Map: S. Marple, Lancaster University). None of the riometer beams overlap with the ALOMAR Weber Na lidar (marked as a red dot), but beam 8, 15 and 22 (coloured red) might be representative for the absorption above Andøya.
region, such as solar electromagnetic emissions, solar pro-tons and energetic electrons. The ionospheric effects of SPE were already identified in the 1950s, after a large so-lar fso-lare was followed by radio communication blackout due to the enhancement of electron densities, thus these events were named polar cap absorption (PCA) in the field of radio physics.
There have been several attempts to derive an empirical relationship between the cosmic radio noise absorption and the precipitating flux of the solar protons (e.g. Kavanagh et al., 2004; Hargreaves, 2005; Rodger et al., 2006). One chal-lenge is the electron recombination coefficient and its sensi-tivity to the solar zenith angle. During night-time the free electrons are removed at the lower altitudes by attachment to oxygen. Hargreaves (2005) showed that the altitudes from about 45–65 km typically account for 80% of the total day-time absorption. At night most of the absorption takes place in the interval from 75–85 km. The criterion for “night” is met when the sun is more than 10◦below the horizon.
Fig. 3. The cosmic radio noise absorption measured by IRIS in beam 8 (solid line), 15 (dotted line), and 22 (dashed line) from 15:38 UT 21 January to 08:38 UT 22 January 2005.
Sect. 3.1, where we compare the absorption measurement to particle measurement performed by satellite borne detectors. 2.3 The NOAA/POES satellites
The NOAA/POES (National Oceanic and Atmospheric Ad-ministration/Polar Orbiting Environmental Satellites) are part of NOAA’s operational weather satellite system. In Jan-uary 2005 three satellites, NOAA 15, 16 and 17 were orbiting the Earth in a polar, sun-synchronous at 850 km altitude with a period of approximately 100 min. Each satellite carries two types of particle sensors, Total Energy Detector (TED) and Medium Energy Proton and Electron Detector (MEPED) (Evans and Greer, 2000).
TED monitors electron and proton fluxes with energies in the range between 50 and 20 000 eV, divided into 16 energy intervals. Four detectors (two electron and two proton detec-tors) are mounted in two groups, where one group is viewing radially outward from the Earth and the other group viewing at 30◦. Every group has a proton detector and an electron detector. At auroral altitudes the first group, looks approxi-mately along the field line and we refer to it as the vertical detector. We will use the electron fluxes measured in the energy intervals 2116–3075 eV, and 6503–9467 eV from the vertical detector.
MEPED provides directional measurement of energetic particles. The instrument holds four directional solid-state detectors, pointing 9◦and 89◦to the local vertical. We refer to these detectors as the vertical and the horizontal detector, respectively. At high latitudes the vertical detector measures particles in the loss cone, while the horizontal detector mea-sures particles that mirror or are close to mirroring at satellite altitude. The detectors have a±15◦(total 30◦) field of view. The protons are measured in six energy ranges: 30–80, 80– 250, 250–800, 800–2500, 2500–6900 and>6900 keV. The
electrons are measured in three energy channels:>30,>100, and>300 keV.
3 Observations
On the 16 January a series of SPEs began causing periods of strong particle precipitation and geomagnetic disturbances as seen in the geomagnetic indicies in Fig. 1. In the declining phase of the so far hardest and most energetic SPE of So-lar Clycle 23, the AE index reveals strong substorm activ-ity. In particular, a large geomagnetic disturbance occurred at 21–22 January starting around 15:00–19:00 UT, reaching AE values of 2000 nT andKpof 7–8. In this period we have 14 h of continuous nighttime temperature measurement with the Na lidar. In this period we also have continuous absorp-tion measurement from IRIS. The three satellites, NOAA 15, 16, and 17, passes through or near our region of interest. The first part of this section will be devoted to the observations concerning the particle precipitation, while the second part focuses on its possible influence on the temperature. 3.1 Absorption and particle measurements
Figure 3 shows the cosmic radio noise absorption measured by IRIS in beam 8, 15, and 22 from 16:00 UT 21 January to 08:00 UT 22 January 2005. At about 15:30 UT an absorp-tion event starts. The three beams show more or less the same values, which indicates that the particle precipitation is fairly uniform over a large area. The absorption decreases to quiet values around 21:00 UT and it remains quiet till about 04:00 UT when a second absorption event starts. The absorp-tion values in the different riometer beams indicate, however, that the precipitation has some localized variations. The so-lar elevation angle was more than 10◦below the horizon from the beginning of this period until about 06:45 UT on the 22 January. Consequently the criterion for nighttime conditions is fulfilled for most of this period. Even so, we wish to in-vestigate if the changes in the absorption are actually due to changes in the particle precipitation and not an effect of changes in the electron recombination coefficient.
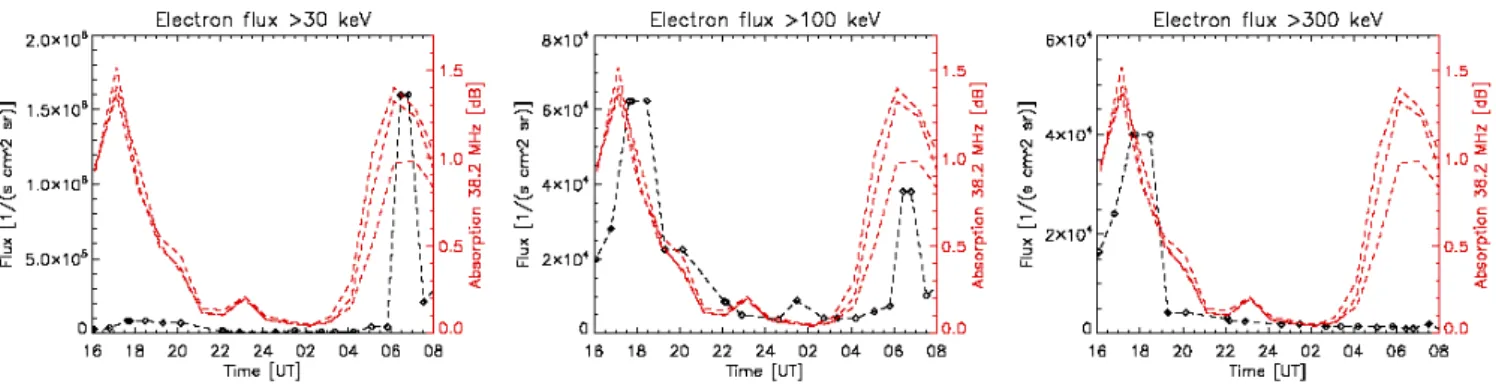
Fig. 4. The black diamonds show the electron flux in three energy channels,>30 keV,>100 keV, and>300 keV above Andøya found by interpolating measurement from the MEPED vertical detector on NOAA 15, 16, and 17 on 21–22 January 2005. The red dashed lines show the cosmic radio noise absorption measured by IRIS in beam 8, 15, and 22.
Fig. 5.The black diamonds show the proton flux in three energy channels, 240–800 keV, 800–2500 keV, and 2500–6900 keV above Andøya found by interpolating measurement from the MEPED vertical detector on NOAA 15, 16, and 17 on 21–22 January 2005. The red dashed lines show the cosmic radio noise absorption measured by IRIS in beam 8, 15 and 22.
differences between the satellite passes, and the coarse grid averaging out possible local effect, we do not expect a per-fect correlation between IRIS and the fluxes retrieved from the NOAA satellites.
Figure 4 shows the electron flux in the energy channels
>30 keV,>100 keV, and>300 keV above Andøya using the interpolation method. The red dashed lines show the cos-mic radio noise absorption measured by IRIS in beam 8, 15 and 22. We find that both the absorption events are asso-ciated with increased electron flux. Focusing on the energy channel>30 keV, we find the strongest electron flux during the second absorption event in the period 06:00–07:00 UT. The maximum of the electron flux fits well with the maxi-mum in the absorption in this period. The first absorption event is also associated with an increase in the precipitating electron flux, but the electron flux is more than a factor 10 less than the electron flux at 06:00–07:00 UT. In the energy channels>100 keV and>300 keV we have the opposite re-lation between the two absorption event. The electron flux at these energies associated with the first absorption event is larger than during the second absorption event. In fact, we do not see any increase in precipitating electrons with energies
>300 keV associated with the second absorption event.
Figure 5 shows the proton flux in the energy channels 240– 800 keV, 800–2500 keV, and 2500–6900 keV. We find that there are more protons associated with the first absorption event compared to the second one in all the energy channels. The maximum in the proton flux in the three channels seems to fit fairly well with the first absorption maximum. How-ever, we do not find increased proton fluxes coinciding with the second absorption event.
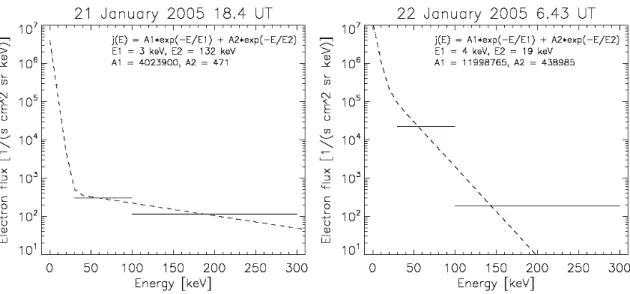
The particle measurements by the MEPED detectors could also indicate the hardness of the energy spectrum based on the ratio between the particle fluxes in the different en-ergy channels. In Fig. 6 we have estimated a differential electron energy spectrum based on the electron flux in the vertical TED and MEPED detectors at two different times. The first point in time is associated with the first absorption event, while the other spectrum is based on observations dur-ing the second absorption event. The electron fluxes mea-sured by the MEPED detector are integral fluxes. However, by combining the three channels,>30 keV,>100 keV, and
Fig. 6.The horizontal lines mark the electron flux in four channels 2.166–3.075 keV, 6.503–9.467 keV, 30–100 keV, 100–300 keV retrieved by interpolating measurement from the vertical TED and MEPED detectors on NOAA 15, 16, and 17 on 21–22 January 2005 at two selected times. The dashed line is the electron differential spectrum fitted to the flux in the four energy intervals.
Fig. 7.The horizontal lines show the proton flux in five energy channels, 30–80 keV, 80–240 keV, 800–2500 keV, and 2500–6900 keV above Andøya retrieved by interpolating measurement from the MEPED detectors on NOAA 15, 16, and 17 on 21–22 January 2005 at two selected times. The dashed line is the proton energy spectra fitted to the flux in five energy channels.
2116–3075 eV and 6503–9467 eV from TED, we have 4 dif-ferential energy channels with measured electron fluxes. The fluxes are fitted to a double exponential spectrum on the form:
j (E)=A1·e −EE
1 +A2·e −EE
2 (1)
The characteristic energies,E1andE2, and the factors A1 andA2are determined so that the estimated differential spec-trum reproduces the actual measurements when integrated over the respective energy intervals. We find a very hard en-ergy spectrum associated with the first absorption event. As shown in Fig. 6 the characteristic energies are 4 and 132 keV.
Vertical incident electrons with the latter energy can pene-trate the atmosphere down to almost 70 km. Particles with characteristic energies associated with the second absorption event, will penetrate down to about 90 km. The proton en-ergy spectra based on five MEPED enen-ergy channels for the same points in time are shown in Fig. 7, but as a combination of three exponential functions.
Fig. 8.Energy deposition height profiles estimated based on the electron and proton spectra found in Figs. 5 and 6. The dashed line is the energy deposited by electrons, the dotted line is the energy deposited by protons, and the solid line is the total energy deposited by both protons and electrons.
Baron, 1976; Vondrak and Robinson, 1985). MANGLE uses the value of 35 eV for the energy expended by the primary precipitation electrons for each ion-electron pair produced, which is in accordance with Rees (1989). The energy height profile for proton is calculated based on the simple formula presented in Mæhlum (1973):
dE
dz = −236·E
−0.78
(2) where the energy loss,dE/dz, is given in units MeV cm2g−1. We assume that the precipitating protons are vertically inci-dent. Atmospheric densities are estimated using MSIS-E-90. On 21 January 18:40 UT we find that the energy deposition rate has two local maxima, at 85 km and 105 km. The energy deposition rate is dominated by protons, possibly solar pro-tons based on their initial energy. However, on 22 January 06:43 UT we find a more typical energy deposition height profile peaking at one height, dominated by electrons with initial energies similar to auroral particles.
According to Fig. 8 we find an energy deposition rate of about 180 keV cm−3s−1at 95 km at 06:43 UT. Converted to SI units this corresponds to 2.88×10⁻⁸Jm−3s−1.The energy transfer to an individual neutral atmospheric particle per time at 95 km,1E95 km/1t, is approximately:
1E95 km
1t =
2.88×10⁻⁸Jm−3s−1
0.22×10²⁰m−3 ≈1.31×10
−27Js−1 (3)
where the number density at 95 km, 0.22×10²⁰ m−3, is found using MSIS. According to Rees et al. (1983) about half of the energy,1Etherm, results in local atmospheric heating, which gives rise to a heating rate of approximately:
1T 1t =
2 5
1Etherm
1t·k ≈2.00×10
−5Ks−1≈0.07 Kh−1 (4)
assuming that the atmosphere at 95 km is an ideal diatomic gas.kis the Boltzmann constant.
In summary, based on the particle fluxes retrieved from the particle detectors on the NOAA satellites the first absorp-tion event observed by IRIS seem to be dominated by proton fluxes with initial energies similar to precipitating solar pro-tons. The second absorption event observed by IRIS is as-sociated with enhanced electron fluxes with energies similar to auroral electrons. Based on the electron and proton spec-tra from two selected periods in time we estimate the energy deposition height profiles, and the resulting heating rate at 95 km altitude.
3.2 Temperature and absorption measurement
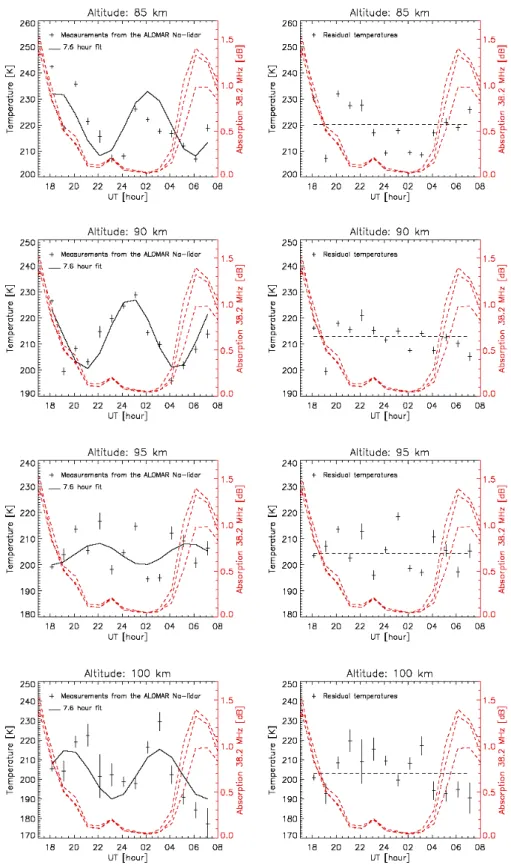
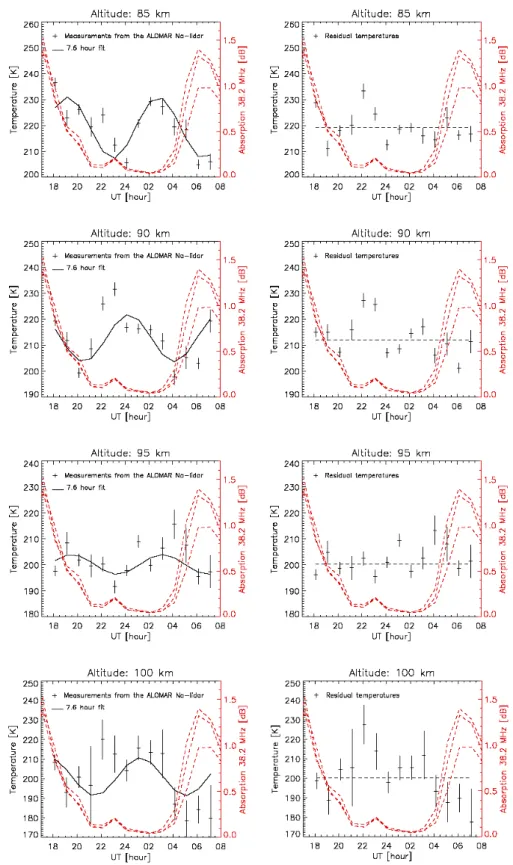
On 21–22 January 2005 we have 14 h of night time measure-ments with the ALOMAR Weber Na lidar. Figure 9 shows contour plots based on hourly averaged temperatures mea-sured in beam 1 and beam 2. Beam 1 points 20◦W of zenith, which corresponds to about 32 km (0.8◦longitude) at 90 km altitude. Beam 2 points 20◦E of zenith. The contour plots reveal a complex temperature structure in our height interval of interest. In particular, we see a wavelike perturbation with a period of approximately 8 h and a vertical wavelength of about 10 km. In the following we wish to analyze the gravity wave field in order to distinguish possible energetic particle precipitation effects from gravity waves effect.
Fig. 9.Contour plots of hourly averaged temperatures from the ALOMAR Weber Na lidar on 21 and 22 January 2005. Beam 1 (left): 20◦W of zenith. Beam 2 (right): 20◦E of zenith.
100 km the 7.6-h wave is no longer that prominent, which could be due to e.g. dissipation of the wave, changes in the at-mosphere’s refractive index or background winds. The right panel in Figs. 9 and 10 shows the residual temperature af-ter subtracting the 7.6-h wave. Looking at 90 km, we do not find a temperature increase associated to the absorption event, marked with the red dashed lines. In fact, the largest temperature residual, found in beam 1 at the end of the first absorption event, is approximately 15 K cooler than the av-erage temperature. The second absorption event is also as-sociated with temperatures less than the mean value of the residual temperatures. At 95 km we do not see any obvi-ous correlation between the temperature and the absorption events, while at 100 km we find temperatures below average in the periods of increased absorption in both beams.
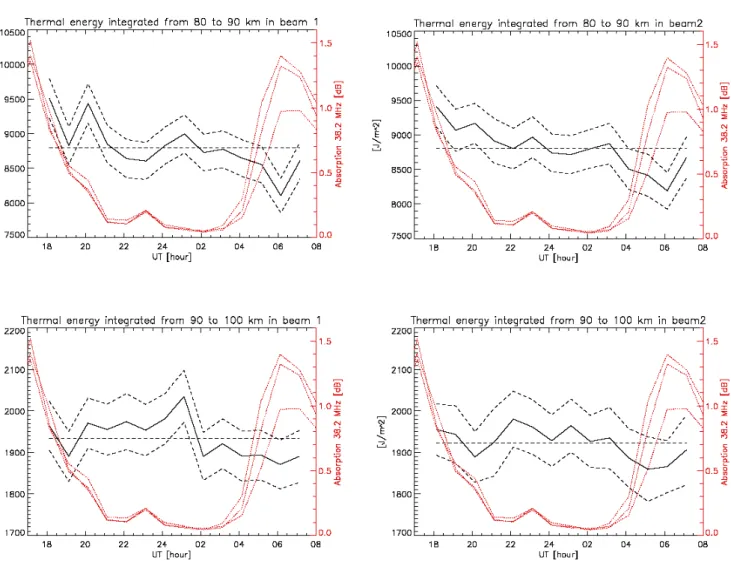
Another way to eliminate the dominant temperature varia-tions due to the 7.6-h wave could be to integrate the thermal energy over the vertical wavelength of the wave, assuming that the wave does not dissipate energy. Using the thermal energy instead of the temperature itself will average out the wave effect within the height interval. This will also reduce possible temperature effects from other possible waves with shorter vertical wavelengths than the 7.6-h wave. As men-tioned above, we find the vertical wavelength of the 7.6-h wave to be about 10 km. Figure 12 shows the height in-tegrated energy at two height intervals, 80–90 km, and 90– 100 km, respectively. The atmospheric densities are found using MSIS-E-90. Since a wave also will cause variation in the background density, we have included an uncertainty of 3% in the density in addition to the temperature uncertain-ties. In the height interval 80–90 km it seems like the height integrated energy experiences a general decrease during our
14 h of observations. However, we do not find any correla-tion between the absorpcorrela-tion events and the height integrated energies in either of the two beams. The same conclusion applies to the height interval 90–100 km.
4 Discussion
4.1 Expected temperature changes
Fig. 12.The black solid line shows the thermal energy integrated from 80 to 90 km and 90 to 100 km in beam 1 (right column) and beam 2 (left column). The black dashed lines show the error estimate including 3% density variation in addition to the temperature uncertainties. The red dashed lines show the cosmic radio wave absorption measured by IRIS in beam 8, 15, and 22.
by the Microwave Limb Sounder onboard the Aura satellite coinciding with the January 2005 SPEs (von Savigny et al., 2007). However, von Savigny et al. (2007) also covered the main phase of the January 2005 SPEs, and we might not ex-pect to find similar heating rates in the declining phase of these events where our observations were done.
The particle precipitation does not only deposit energy, but also modifies the gas composition through ionization, disso-ciation and excitation. In particular, there has been found a strong correlation between the production of odd nitrogen, NOx and odd hydrogen HOx species and energetic particle precipitation (e.g. Crutzen et al., 1975; Swider and Kenesha, 1973; Jackman et al., 1980; Solomon et al., 1981; Sætre et al., 2004). These minor constituents reduce the ozone con-centration through catalytic processes. Ozone is an important heating source in the mesopause region both as an absorber of solar radiation and through chemical reactions (Mlynczak and Solomon, 1993; Berger and von Zahn, 1999).
There-fore any decrease in ozone ultimately results in less heating, in particular in the sunlit atmosphere, explaining the cooling below 80 km altitude associated with the October 1989 SPEs observed by Zadorozhny et al. (1994).
Fig. 13.The average temperature profiles based on 14 h of measure-ment in beam 1 (black solid line) and beam 2 (black dashed-dotted line) with the ALOMAR Weber Na lidar on 21–22 January 2005. The red dotted line shows the temperature predicted by the MSIS model. The blue dashed line shows the temperature climatology found by L¨ubken and von Zahn (1991) based on falling spheres above Andøya.
in the period we were measuring. Additionally, Pancheva et al. (2007) suggested that the heating via precipitating pro-tons in the middle atmosphere could cause upwelling of the air cooling the upper mesospheric air adiabatically. As men-tioned above, we did not find evidence for a heating that could be responsible for a potential upwelling at any of the observed heights. However, we cannot exclude the possibil-ity of a potential heating or cooling effect occurring in the main phase of the January 2005 SPEs.
A cooling in the middle mesosphere as observed by Zadorozhny et al. (1994), could initiate a small downwelling. Model calculation by Jackman et al. (2007) suggested down-ward vertical winds of the order of mm/s. Even though the wind was relatively small it could cause an increased downward transport enhancing the atomic oxygen abun-dance. More atomic oxygen leads to more O-CO2collisions, which results in more excited CO2, and an enhanced infrared cooling rate (Jackman et al., 2007). The vertical transport could also change the CO2abundance, as the CO2 concen-tration is not a constant fraction of the total atmospheric gas above∼65 km. However, a larger atomic oxygen concentra-tion also strengthens the exothermic reacconcentra-tion O-HOxand in that manner the chemical heating rate. The downward verti-cal wind could also cause adiabatic heating (Jackman et al., 2007).
All in all, energetic particles can cause both heating and cooling depending on which altitude we focus on and the specific conditions present. A sensitivity analysis made by Jackman et al. (2007) shows that the temperature
modifica-tion is seasonally dependent. In the sunlit hemisphere, we might expect a heating at altitudes above 80 km and a cooling below 80 km. However, they found little temperature modi-fication in the winter hemisphere. In other words, we might not expect to see any temperature changes in the Northern Hemisphere during the January 2005 SPEs. The temperature increase reported by von Savigny et al. (2007) was observed in the Southern Hemisphere during this event. In addition, considering the size of the heating and cooling rates asso-ciated with SPEs and other energetic particle precipitation events, the discrimination of solar influences and influences by e.g. tidal and gravity waves, remains an almost impossible challenge. Analysing the temperature field on 21 and 22 Jan-uary 2005, we found a possible wave field with a period of 7.6 h and amplitude of 20–25 K at 90 km. A potential heat-ing of 10 K/d would more or less be impossible to extract in a case study like ours.
4.2 Time constants
When looking for potential temperature changes associated with energetic particle precipitation we should also consider the time constants involved. Since radiative relaxation times in the upper mesosphere are of the orders of several days (Barabash et al., 2004) a potential temperature modification is expected to be rather stable and last several days after the event. As mentioned, the solar proton events in Jan-uary 2005 started already on 16 JanJan-uary, which means that the temperature observed on 21 and 22 January could be in-fluenced by days of increased particle precipitation and not just the precipitation coinciding with our measurement pe-riod. In Fig. 13 we have plotted the average temperature profiles based on our 14 h of measurements, the MSIS tem-perature profile, and the monthly mean based on the clima-tology found from falling spheres on Andøya (L¨ubken and von Zahn, 1991). We find that above 90 km our average temperature is larger than both the MSIS and the monthly mean falling sphere predictions. The deviation between the measured and predicted profiles increases with height, as we also would expect if the higher temperatures were due to e.g. Joule heating. However, we should interpret the comparison between the profiles with care because of the existence of a diurnal tidal wave or other long period waves, as our average temperature profile is only based on 14 h.
4.3 Long period waves
of about 10 km and large amplitudes due to a wave with downward phase progression and 8–10 h period at altitudes of 60–80 km during three different SPEs in 1989 and 1990. R¨ottger (1994) points out that this period range, the large am-plitude and the rather short vertical wavelength of 10 km is unlikely to be caused by the tidal variations below 75 km at high latitudes. They suggest that the waves could be excited by the thermodynamical and chemical effects created by so-lar protons precipitating the middle atmosphere.
In particular, R¨ottger (1994) focuses on the periodicity of the potential change in heating rates during SPEs. For in-stance there is strong dependence of the electron density on the solar zenith angle due to the formation of negative ions in darkness (Collis and Rietveld, 1990). This results in a diur-nal and seasodiur-nal variation of the electron density below this altitude. The magnetospheric electric field also has a diurnal variation. The time scale of these changes is often consis-tent with a substantial 6–10 h spectral component in the elec-tric field variations R¨ottger (1994). The combined effect of the varying electron density and electric field could perhaps cause noticeable variation in the Joule heating. Furthermore, the temporal variation in the SPEs itself often show quasi-periodicities of several hours to days, and is usually charac-terized by impulsive increases. Additionally, there could also be a change in the heating rates due to the production of NOx and HOy, and the subsequent destruction of ozone.
5 Summary and future work
On 16 January 2005 began a series of SPEs, which ended with the so far hardest and most energetic SPE of Solar Cy-cle 23 on 20–22 January. In the declining phase of the SPE on 21–22 January 2005 coinciding with a large geomagnetic storm we have 14 h of continuous temperature measurement with the ALOMAR Na lidar, which according to the IRIS measurements includes 2 absorption events. Particle mea-surements from the three satellites, NOAA 15, 16 and 17 that pass through or near our region of interest confirms that the absorption events are probably due to particle precipita-tion and not due to changes in the electron recombinaprecipita-tion coefficient. This gave us an opportunity to search for possi-ble temperature effects caused by local particle precipitation during a relatively strong geomagnetic event.
The temperature variations at 85 and 90 km is dominated by a 7.6 h downward propagating wave with vertical wave-length of approximately 10 km. Assuming that the wave is due to tidal or gravity waves independent of the particle pre-cipitation, we do not find any temperature modification that seems to be related to the absorption events. However, a po-tential temperature modification could be too small to iso-late in a system of tides and gravity waves in a single case study. Above 90 km the measured average temperature is larger than predicted from both MSIS and the monthly mean climatology based on falling spheres, which could be due to
energy deposited by particle precipitation and Joule heating prior to our measurement period. There is also a possibility that the identified wave phenomenon is an effect of the SPEs itself. Rietveld et al. (1992) and R¨ottger (1994) have reported of similar wavelike structures in wind observations made by the EISCAT VHF radar during SPEs, and found it conceiv-able that the wave could be exited by the effects of energetic particles precipitating the mesosphere.
Considering the size of the calculated heating rate we find it likely to be no immediate significant temperature effects of the particle precipitation in the upper mesosphere above Andøya on the 21–22 January 2005. If any measurable tem-perature effects take place, we find it most likely to be heat-ing caused by particle precipitation over a longer time period prior to our measurement period. A wave with downward phase propagation would have to be triggered by a lower al-titude source. Due to higher densities at lower alal-titudes the particle energy input would have to be significantly larger than measured in our case. However, taking into consid-eration that this paper only addresses one case and the dif-ferent results reported on energetic particle precipitation and temperatures in the upper mesosphere, we choose to be pru-dent in making a general conclusion. Instead, we point out the need for future work and studies of simultaneous mea-surements of both the upper mesospheric temperatures and local energetic particle precipitation. First of all, we wish to address a similar study using the ALOMAR Na lidar in summer time, since earlier studies have shown a larger tem-perature effect due to strong particle precipitation in sunlit areas. Recent improvements of the lidar system have sig-nificantly improved our daylight measurements making this a strong possibility in the future. Independently of season, we should look for wave structures similar to the downward propagating wave of∼8 h and short vertical wavelength both in geomagnetically quiet and disturbed periods using both lidar and other available instruments. An updated lidar cli-matology could also be useful when comparing temperature measurements retrieved in regions influenced by significant particle precipitation.
Acknowledgements. The ALOMAR Weber Na lidar is a
coopera-tive effort of Colorado State University, NorthWest Research As-sociates/ Colorado Research Associates Division (NWRA/CoRA), the Norwegian Defence Research Establishment (FFI), the Leibniz-Institute of Atmospheric Physics, and Andøya Rocket Range. This research was supported by The Research Council of Norway projects 165573 and 170855, by AFSOR under contracts F49620-03-C-0045 and FA9550-06-C-0129, and by the NSF under grants ATM-0545262 and ATM-0436703.
References
Arnold, K. S. and She, C.-Y.: Metal fluorescence lidar (light detec-tion and ranging) and the middle atmosphere, Contemp. Phys., 44, 35–49, 2003.
Banks, P. M.: Observation of Joule and particle heating in the auro-ral zone, J. Atmos. Terr. Phys., 39, 179–193, 1977.
Banks, P. M.: Joule heating in the high-latitude mesosphere, J. Geo-phys. Res., 84, 6709–6712, 1979.
Barabash, V., Kirkwood, S., Feofilov, A., and Kutepov, A.: Polar mesosphere summer echoes during the July 2000 solar proton event, Ann. Geophys., 22, 759–771, 2004,
http://www.ann-geophys.net/22/759/2004/.
Berger, U. and von Zahn, U.: The two-level structure of the mesopause: A model study, J. Geophys. Res., 104, 22 083– 22 093, 1999.
Browne, S., Hargreaves, J. K., and Honary, B.: An imaging riome-ter for ionospheric studies, Electronics & Communication En-geenering Journal, 7, 209–217, 1995.
Collis, P. N. and Rietveld, M. T.: Mesospheric observations with the EISCAT UHF radar during polar cap absorption: 1. Electron densities and negatice ions, Ann. Geophys., 8, 809–824, 1990, http://www.ann-geophys.net/8/809/1990/.
Crutzen, P. J., Isaksen, I. S. A., and Reid, G. C.: Solar Proton Events: Stratospheric Sources of Nitric Oxide, Science, 189, 457–459, 1975.
Evans, D. S. and Greer, M. S.: Polar orbiting environmental satellite space environment monitor 2: Instrument description and archive data documentation, NOAA Tech. Memo, 2000.
Fang, X., Liemohn, M. W., Kozyra, J. U., Evans, D. S., DeJong, A. D., and Emery, B. A.: Global 30-240 keV proton precipita-tion in the 17–18 April 2002 geomagnetic storms: 1. Patterns, J. Geophys res., 112, A05301, doi:10.1029/2006JA011867, 2007. Fricke, K. H. and von Zahn, U.: Mesopause temperatures derived
from probing the hyperfine structure of the D2resonance line of
sodium by lidar, J. Atmos. Terr. Phys., 47, 499–512, 1985. Hargreaves, J. K.: A new method of studying the relation between
ionization rates and radio-wave absorption in polar-cap absorp-tion events, Ann. Geophys., 23, 359–369, 2005,
http://www.ann-geophys.net/23/359/2005/.
Heinrich, D., Blum, U., Williams, B., Vance. J., She, C.-Y., Singer, W., and Hoppe, U.-P.: Observations of wintertime mesopause temperatures with the ALOMAR Weber Na lidar during winter 2004/05, ESA SP-590, 133–137, 2005.
Jackman, C. H., Frederick, J. E., and Stolarski, R. S.: Production of odd nitrogen in the stratosphere and mesosphere: an intercom-parison of source strengths, J. Geophys. Res., 85, 7495–7505, 1980.
Jackman, C. H. and McPeters, R. D.: The response of ozone to solar proton events during solar cycle 21: A theoretical interpretation, J. Geophys. Res., 90, 7955–7966, 1985.
Jackman, C. H., Ceriglia, M. C., Nielsen, J. E., Allen, D. J., Za-wodny, J. M, McPeters, R.D., Douglass, A. R., Rosenfield, J. E., and Rood, R. B.: Two-dimensional and three-dimensional model simulations, measurements, and interpretation of the influence of the October 1989 solar proton events on the middle atmosphere, J. Geophys. Res., 100, 11 641–11 660, 1995.
Jackman, C. H., Roble, R. G., and Fleming, E. L.: Meso-spheric dynamical changes induced by the solar proton events in October–November 2003, Geophys. Res. Lett., 34, L04812,
doi:10.1029/2006GL028328, 2007.
Kavanagh, A. J., Marple, S. R., Honary, F., McCrea, I. W., and Se-nior, A.: On solar protons and polar cap absorption: constraints on an empirical relationship, Ann. Geophys., 22, 1122–1147, 2004,
http://www.ann-geophys.net/22/1122/2004/.
Krivolutsky, A. A., Klyuchnikova, A. V., Zakharov, G. R., Vyushkova, T. Yu., and Kuminov, A. A.: Dynamical response of the middle atmosphere to solar proton event of July 2000: Three dimensional model simulations, Adv. Space Res., 37, 1602– 1613, doi:10.1016/j.asr.2005.05.115, 2006.
Kubo, K., Rottger, J., and Fukao, S.: Upper mesospheric tempera-ture changes observed in PMSE and incoherent scatter during a strong polar cap absorption event, paper presented at 10th MST Radar Workshop, Inst. Geofis. del Peru, Lima, 2003.
L¨ubken, F.-J. and von Zahn, U.: Thermal structure of the mesopause region at polar latitudes, J. Geophys. Res., 96, 20 841–20 857,1991.
Mlynczak, M. G. and Solomon, S.: A detailed evaluation of the heating efficiency in the middle atmosphere, J. Geophys. Res., 98, 10 517–10 541, 1993.
Mæhlum, B. N.: Particle precipitation: Scattering and absorption, in: Cosmical Geophysics, Universitetsforlaget, 211–219, 1973. Offermann, D.: The Energy Budget Campaign 1980: introductory
review, J. Atmos. Terr. Phys., 47, 1–26, 1985.
Pancheva, D., Singer, W., and Mukhtarov, P.: Regional response of the mesosphere-lower thermosphere dynamics over Scandinavia to solar proton events and geomagnetic storms in late October 2003, J. Atmos. Sol. Terr., 69, 1075–1094, 2007.
Peterherych, S. G., Shepherd, S., and Walker, J. K.: Observation of vertical E-region neutral winds in two intense auroral arcs, Planet. Space. Sci., 33, 869–873, 1985.
Price, G. D. and Jacka, F.: The influence of geomagnetic activity on the upper mesosphere/lower thermosphere in the auroral zone. i. vertical winds, J. Atmos. Terr. Phys., 53, 909–922, 1991. Rees, M. H., Emery, B. A., Roble, R. G., and Stamnes, K.: Neutral
and ion gas heating by auroral electron precipitation, J. Geophys. Res., 88, 6289–6299, 1983.
Rees, M. H.: Physics and Chemistry of the Upper Atmosphere, Cambridge Univ. Press, 1989.
Reid, G. C., Solomon, S., and Garcia, R. R.: Response of the middle atmosphere to the solar proton events of august-december, 1989, Geophys. Res. Lett., 18, 1019–1022, 1991.
Rietveld, M. T., Collis, P. N., and Rottger, J.: Observations of at-mospheric dynamics in the low- and middle-mesosphere with the EISCAT incoherent scatter rader during solar proton events, Adv. Space Res., 12, 1081–1084, 1992.
Roble, R. G., Emery, B. A., Garcia, R. R., Killeen, T. L., Hays, P. B., Reid, G. C., Solomon, S., Evans, D. S., Spencer, N. W., and Brace, L. H.: Joule heating in the mesosphere and thermosphere during the July 13, 1982, solar proton event, J. Geophys. Res., 92, 6083–6090, 1987.
Roble, R. G.: Energetics of the mesosphere and thermosphere, in: The Upper Mesosphere and Lower Thermosphere: A Review of Experiment and Theory, Geophys. Monogr. Ser., vol. 87, edited by: Johnson, R. M. and Killeen, T. L., 1–21, AGU, Washington D.C., 1995.
variations during a solar proton event, J. Geophys. Res., 111, A04222, doi:10.1029/2005JA011395, 2006.
R¨ottger, J.: Solar proton events: a source for long period gravity waves in the polar mesosphere, in the Solar-terrestrial energy program: the initial results from STEP, 5, 473–476, Elsevier, 1994.
Sepp¨al¨a, A., Verronen, P. T., Kyr¨ol¨a, E., Hassinen, S., Backman, L., Hauchecorne, A., Bertaux, J. L., and Fussen, D.: Solar pro-ton events of October-November 2003: Ozone depletion in the Northern Hemisphere polar winter as seen by GOMOS/Envisat, Geophys. Res. Lett., 31, L19107, doi:10.1029/2004GL021042, 2004.
She, C. Y., Vance, J. D., Williams, B. P., Krueger, D. A., Moosm¨uller, H., Gibson-Wilde, D., and Fritts, D. C.: Lidar stud-ies of atmospheric dynamics near polar mesopause, EOS Trans. AGU, 83, 289–293, 2002.
Solomon, S., Rusch, D. W., G´erard, J.-C., Reid, G. C., and Crutzen, P. J.: The effect of particle precipitation events on the neutral and ion chemistry of the middle atmosphere II. Odd hydrogen, Planet. Space Sci., 29, 885–892, 1981.
Swider, W. and Kenesha, T.: Decrease of ozone and atomic oxygen in the lower mesosphere during PCA event, Planet. Space Sci., 21, 1969–1973, 1973.
Sætre, C., Stadsnes, J., Nesse, H., Aksnes, A., Petrinec, S. M., Barth, C. A., Baker, D. N., and Vondrak, R. R.: Energetic elec-tron precipitation and the NO abundance in the upper atmosphere – a direct comparison during a geomagnetic storm, J. Geophys. Res., 109, A09302, doi:10.1029/2004JA010485, 2004.
Vance, J. D., She, C.-Y., and Moosm¨uller, H.: Continuous-wave, all-solid-state, single-frequency 400-mW source at 589 nm based on doubly resonant sum-frequency mixing in a monolithic lithium niobate resonator, Appl. Optics, 37, 4891–4896, 1998. Vondrak, R. R. and Baron, M. J.: Radar measurements of latitudinal
variation of auroral ionization, Radio Sci., 11, 939–946, 1976. Vondrak, R. R. and Robinson, R.: Inference of high-latitude
ioniza-tion and conductivity form AE-C measurements of auroral elec-tron fluxes, J. Geophys. Res., 90, 7505–7512, 1985.
von Savigny, S., Sinnhuber, M., Bovensmann, H., Burrows, M.-B., and Schwartz, M.: On the dissapearance of noctilucent clouds during the January 2005 Solar proton events, Geophys. Res. Lett., 34, L04812, doi:10.1029/2006GL028106, 2007.