www.atmos-chem-phys.net/14/10509/2014/ doi:10.5194/acp-14-10509-2014
© Author(s) 2014. CC Attribution 3.0 License.
Temporal variations in rainwater methanol
J. D. Felix, S. B. Jones, G. B. Avery, J. D. Willey, R. N. Mead, and R. J. Kieber Department of Chemistry and Biochemistry, University of North Carolina at Wilmington, Wilmington, North Carolina 28403-5932, USA
Correspondence to:J. D. Felix ([email protected])
Received: 26 November 2013 – Published in Atmos. Chem. Phys. Discuss.: 17 January 2014 Revised: 18 August 2014 – Accepted: 3 September 2014 – Published: 7 October 2014
Abstract. This work reports the first comprehensive analy-sis of methanol concentrations in rainwater. Methanol con-centrations measured in 49 rain events collected between 28 August 2007 and 10 July 2008 in Wilmington, NC, USA, ranged from below the detection limit of 6 nM to 9.3 µM with a volume-weighted average concentration of 1±0.2 µM.
Methanol concentrations in rainwater were up to∼200 times
greater than concentrations reported previously in marine waters, indicating wet deposition as a potentially significant source of methanol to marine waters. Assuming that these methanol concentrations are an appropriate proxy for global methanol rainwater concentrations, the global methanol wet deposition sink is estimated as 20 Tg yr−1, which implies
that previous methanol budgets underestimate removal by precipitation. Methanol concentrations in rainwater did not correlate significantly with H+, NO−
3, and NSS, which
sug-gests that the dominant source of the alcohol to rainwater is not anthropogenic. However, methanol concentrations were strongly correlated with acetaldehyde, which has a primarily biogenic input. The methanol volume-weighted concentra-tion during the summer (2.7±0.9 µM) was∼3 times that of
the winter (0.9±0.2 µM), further promoting biogenic
emis-sions as the primary cause of temporal variations of methanol concentrations. Methanol concentrations peaked in rainwa-ter collected during the time period 12 p.m.–6 p.m. Peaking during this period of optimal sunlight implies a possible rela-tionship with photochemical methanol production, but there are also increases in biogenic activity during this time period. Rain events with terrestrial origin had greater concentrations than those of marine origin, demonstrating the significance of the continental source of methanol in rainwater.
1 Introduction
Methanol is the second most abundant volatile organic com-pound (VOC) in the troposphere, where it plays a signifi-cant role in atmospheric chemistry by producing O3, CO,
and HCHO and decreasing OH concentrations (Millet et al., 2008). Tie et al. (2003), using a global chemical transport model, reported that methanol emissions produce approxi-mately a 1–2 % increase in O3, a 1–3 % decrease in OH,
and a 3–9 % increase in formaldehyde. The GEOS-chem 3-D model of atmospheric chemistry indicates that methanol emissions account for 20 % of CO and HCHO production rates during spring and early summer (Hu et al., 2011). Methanol reacting with OH can also lead to production of formic acid (Monod et al., 2000), which in turn increases acidification of rain. These various atmospheric interactions and subsequent impacts on atmospheric chemistry have led to the investigation and quantification of sources of methanol emissions.
2002) and are less prone to biogenic emissions than rural ar-eas. Due to the atmospheric lifetime of methanol (5 to 12 days) (Jacob et al., 2005), emissions from anthropogenic or biogenic sources can possibly travel across large continen-tal regions, making it difficult to apportion various methanol source contributions to ambient methanol concentrations.
Efforts have been made to refine the estimated quantities of sources and sinks (primarily OH oxidation) of atmospheric methanol (Heikes et al., 2002; Millet et al., 2008; Wells et al., 2012). These efforts have been predominately based on methanol concentration data consisting of aircraft and sur-face air analysis. The limited number of measurements and the lack of concentration data in the condensed phase lead to wide discrepancies in global methanol budget models, which in turn have led to the reported total global methanol source ranging from 75 to 490 Tg yr−1 and sink from 40
to 570 Tg yr−1 (Singh et al., 2000a; Galbally and Kirstine,
2002; Heikes et al., 2002; von Kuhlmann et al., 2003; Tie et al., 2003, Jacob et al., 2005).
There is currently a paucity of condensed phase methanol concentration data and a lack of information of methanol’s role in the global biogeochemical cycling. In fact, there are currently no detailed studies of methanol levels in precipi-tation. This uncertainty has resulted in a wide range in the predicted wet depositional methanol sink of 4 to 50 Tg yr−1
(Singh et al., 2000a; Galbally and Kirstine, 2002; Heikes et al., 2002; von Kuhlmann et al., 2003; Tie et al., 2003, Jacob et al., 2005).
The purpose of the current study was to define the ranges and patterns of variation in the abundance of rainwater methanol, including such factors as the influence of air mass back trajectory on concentrations. To gain better insight into the possible anthropogenic and biogenic origins of methanol, concentrations were also intercorrelated with a variety of other rainwater components as well as seasons. Data gen-erated in this study are requisite to the generation of the first total global wet deposition sink of methanol based on mea-sured aqueous-phase concentrations.
2 Materials and methods 2.1 Sample collection
Wilmington rainwater samples were collected on an event basis on the campus of the University of North Carolina at Wilmington (UNCW) from 28 August 2007 to 10 July 2008 (n=49 events). The collection site at UNCW is a large open
area of approximately 1 hectare and is made up of a turkey oak, long leaf pine and wire grass community. This area is typical of the inland coastal area of southeastern North Carolina. The site (34◦13.9′N, 77◦52.7′W) is approximately
8.5 km from the Atlantic Ocean. Due to the close proximity of the collection site to the laboratory, methanol analysis or filtration and refrigeration of samples could be done within
minutes of collection. This reduces the possibility of compo-sitional changes between the times of collection and analysis. If it was not possible to analyze the rain samples within 2 h, they were frozen immediately and stored in a−80◦C freezer.
Event rain samples were collected using Aerochem-Metrics (ACM) model 301 automatic sensing wet/dry precipitation collectors containing 4 L Pyrex glass beakers that were pre-cleaned by combusting at 450◦C for 4 h to remove organic
impurities. Rainwater concentrations are reported as volume-weighted concentrations with volume-volume-weighted standard de-viations. This is the mathematical equivalent to mixing all rain within a specified time period and reporting the analyti-cal result for that composite sample.
2.2 Formaldehyde and methanol
Formaldehyde concentrations in rainwater samples were de-termined by derivatization with 2,4-dinitrophenylhydrazine followed by separation and detection by HPLC (Kieber et al., 1999). Samples and standards reacted with 2,4-dinitrophenylhydrazine (DNPH) for one hour in the dark, forming a hydrazone, which was separated from interfer-ing substances by HPLC and quantified by UV detec-tion at 370 nm. Derivatized samples (100 µL) were injected onto a reversed phase Luna 100 mm×4.60 mm 3 µC18
Phe-nomenex column with a 100 Å pore size at 10ºC. The mobile phase was a 1:1 mixture of 0.1 % trifluroacetic acid (TFA) in acetonitrile and 0.1 % TFA in deionized water at a flow rate of 1.00 mL min−1.
Methanol was determined from a second aliquot by ox-idation of the alcohol to formaldehyde via alcohol oxi-dase obtained from the yeastHansenulasp. (Kieber et al., 2013). The enzyme was prepared by dissolution of 100 units of alcohol oxidase in 5 mL of 0.1M potassium phosphate buffer (pH 9.0). The sample (1000 µL) was combined with 10 µL of buffer along with 100 µL of an enzyme working reagent (0.18 units mL−1)and allowed to react at 40◦C for
40 min before addition of 10 µL of DNPH. The concentra-tion of methanol was determined after HPLC analysis by the difference in formaldehyde concentration in samples with and without added enzyme. Milli-Q water is analyzed for methanol during each analysis and the methanol blank con-centration is subtracted from the sample. This method has a detection limit of 6 nM and a precision of 2 % relative stan-dard deviation.
(HPLC grade, Burdick and Jackson, Muskegon, MI), 12 M hydrochloric acid (Reagent Grade, VWR International, West Chester, PA) and carbon tetrachloride (HPLC grade 99.9 %, Sigma, St. Louis, MO) were used in the preparation and pu-rification of the DNPH reagent solution.
Formaldehyde (37.69 % CH2O) and paraformaldehyde
(94.19 %, containing no methanol) were obtained from the Wright Chemical Company (Wilmington, NC). A 1 M formaldehyde stock solution was prepared before each rain event. Methanol (HPLC grade, Burdick and Jackson, Muskegon, MI) and Milli-Q water were used to prepare a 1 M alcohol stock solution before each rain event. ACS grade (99.0 %) potassium dihydrogen phosphate and reagent grade potassium hydrogen phosphate (Alfa Aesar, Ward Hill, MA) were used in the preparation of all buffer solutions.
2.3 Supporting analyses
These supporting data were used to characterize rain events and to evaluate whether the patterns of variation observed for methanol co-vary with any of these analytes. These support-ing data also allow comparison with rain collected elsewhere. Hydrogen peroxide was analyzed at the time of sample collection by a fluorescence decay technique involving the peroxidase-mediated oxidation of the fluorophore scopoletin by H2O2in rain buffered at a pH of 7 with a phosphate buffer
(Mullaugh et al., 2012). The dissolved organic carbon con-tent in the rainwater samples was determined with a Shi-madzu TOC 5000 carbon analyzer (ShiShi-madzu, Kyoto, Japan) equipped with an ASI 5000 autosampler (Willey et al., 2000). Inorganic anions (Cl−, NO−
3, and SO24−)were analyzed
us-ing suppressed ion chromatography. A Ross electrode with low ionic strength buffers was used for pH analysis. Organic acid concentrations were measured with a Dionex 4000i/SP ion chromatograph with a SP4290 integrator, Dionex Ion-PacR AS11 4 mm analytical column, AG11 4 mm Guard col-umn and anion micromembrance suppressor model AMMS-11 (Avery et al., 2001). Acetalydehyde concentrations in rainwater samples were determined by derivtization with 2,4-dinitrophenylhydrazine followed by separation and detection by HPLC (Kieber et al., 1999).
2.4 Rain event origin definitions
Precipitation events were categorized using air-mass back trajectories generated using version 4 of the Hybrid Single Particle Lagrangian Integrated Trajectory Model (HYSPLIT) developed at the National Oceanic Atmospheric Administra-tion – Air Resources Laboratory (NOAA/ARL, 2013). Tra-jectories were generated using a stand-alone PC version of the model and calculated using pre-processed gridded hor-izontal and vertical wind fields generated at 6-hour inter-vals from the National Center for Environmental Prediction’s Global Data Assimilation System using the Medium Range Forecast model to produce the forecast wind fields. Single
back trajectories were run for each measured precipitation event collected at UNCW, starting at the recorded onset of precipitation. Trajectories were run starting at the 500m level to represent the air mass near the well-mixed boundary layer likely to contribute more heavily to in-cloud processes con-tributing to wet deposition (Walker et al., 2000). They were then visually categorized based on origin (compass direc-tion) and path (terrestrial, marine, coastal, or mixed). Ter-restrial and marine air masses are those whose pathway for the 120 h period preceding the rain event was predominantly over a landmass or the ocean, respectively. Mixed trajectories were those that were determined to have the same potential for oceanic as well as terrestrial influence, based on a visual analysis of their pathway (Kieber et al., 2005). Coastal tra-jectories followed the Atlantic coastline.
GIS shape files produced by the HYSPLIT program were used to plot trajectories for each rain event type on a US county (county is defined as a geological subdivision of a US state) basemap that portrays size-normalized county-level biogenic methanol emissions. The methanol emissions used to make the map were from the 2008 National Emissions In-ventory (NEI, 2008).
2.5 Results and discussion
Methanol concentrations in the samples for the 49 rain events ranged from below the detection limit (< 6 nM) to 9.3 µM with a volume-weighted average concentration of 1±0.2 µM, a simple average concentration of 1±2 µM
and a median of 0.9 µM. The range in reported gas-phase methanol concentrations (0.03 to 47 ppbv (Heikes et al., 2002; Jacob et al., 2005)) and a range of Henry’s Law con-stants (140 to 230 mol kg−1bar−1) (NIST 2014) were used
to investigate if the rainwater concentrations are in thermo-dynamic equilibrium with gas-phase methanol. If the rainwa-ter is in equilibrium with the gas phase, the calculated range of rainwater methanol concentrations is 4.2 nM to 10.8 µM. This range is similar to the observed range of < 6 nM to 9.3 µM, and suggests equilibrium, but disequilibrium can-not be ruled out. The average methanol concentration in this study is almost 2 times the average in rainwater (690 nM) col-lected at an Arizona site in 1982 (Snider and Dawson, 1985). These are the only other known methanol concentrations in rainwater, and may be much lower than the Wilmington av-erage, because Arizona is a much more arid region that prob-ably has lower biogenic emissions. Direct comparison to this earlier study should be viewed with caution however, as the reported blank (625 nM) was very near the reported average concentration, and it lacked sufficient analytical sampling frequency (n=4) to allow for detailed analysis of temporal
Figure 1.Average volume-weighted methanol concentrations plot-ted according to rain event origin. Error bars represent±one stan-dard deviation from the average.
2.6 Rain event origin
Rain events were classified based on their back trajectory to determine how methanol concentrations were affected by continental influences (Fig. 1). Terrestrial, mixed, coastal and marine rain events had volume-weighted average methanol concentrations of 1.5±0.5 µM, 1.6±0.2 µM, 0.7±0.4 µM,
and 1.1±0.2 µM, respectively (Fig. 1). Figure 2 shows
indi-vidual rain event trajectories plotted over US county-level biogenic methanol emissions. Rain events with terrestrial back trajectories had greater methanol concentrations than those with marine back trajectories, which is consistent with previous findings that gas-phase atmospheric methanol con-centrations reported over land (0.03–47 ppbv) are greater than those reported over the ocean (0.3–1.4 ppbv) (Heikes et al., 2002; Jacob et al., 2005). This also agrees with global budgets that suggest methanol has a primarily terrestrial bio-genic source.
Although rain event types with marine influence (coastal, marine) have smaller methanol concentrations than those with terrestrial influence, the difference is not significant (ANOVA:p=0.15), and methanol is present in substantial
amounts in samples from rain events with coastal and marine origin. This may be due to several reasons: (1) the ocean may be a source of methanol emissions. Millet et al. (2008) report the ocean as an overall methanol sink, but consider the ocean biosphere a large enough source to cause detectable concen-trations in the atmosphere; (2) methanol has an average atmo-spheric lifetime of 5 to 12 days (Jacob et al., 2005), allowing for transport of methanol from land masses to the ocean; and (3) methanol at the rain collection site could include some methanol scavenged from local terrestrial sources. It should be noted that the previous gas-phase methanol concentration studies that show much greater methanol concentrations over land than over the ocean sampled air in the remote ocean (Yang et al., 2013). The aqueous-phase methanol
concentra-Figure 2.Rain event trajectories plotted over annual county-level biogenic methanol emissions that have been normalized by county size. Methanol emission in kg km−2yr−1.
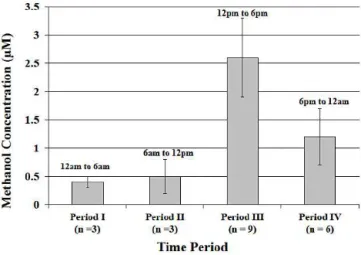
Figure 3.Diurnal methanol concentrations. Each bar represents the average volume-weighted methanol concentration during the given time period. Error bars represent±one standard deviation from the average.
tions associated with marine rain events were collected on coastal land, not over the open ocean, so it is expected that the large concentration differences seen between gas-phase methanol concentrations collected at ocean and terrestrial sites will not be mimicked in this aqueous-phase study.
2.7 Diurnal variations
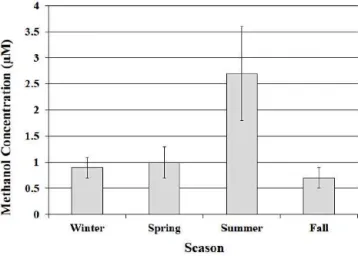
Figure 4.Average volume-weighted methanol concentration plot-ted in each season. Error bars represent±one standard deviation from the average.
represents the average volume-weighted methanol concen-tration during the given time period.
Methanol concentrations peaked during time period III (12 p.m.–6 p.m.), with an average volume-weighted concen-tration of 2.6±0.7 µM. Peaking during this period of
opti-mal sunlight implies a possible relationship with photochem-ical methanol production (e.g., the oxidation of methane, and the methylperoxy radical reacting with itself and higher or-ganic peroxy radicals) (Jacob et al., 2005), but there are also increases in plant activity and anthropogenic activity (e.g., vehicle use, industrial processes) during this time period. The concentration peak during this time period corresponds to the peak of numerous previous diurnal measurements of methanol flux over varying vegetation, and is attributed to light causing stomata to open, in turn releasing methanol (Bamberger et al., 2010; Brunner et al., 2007; Custer and Schade, 2007; Harley et al., 2007; Karl et al., 2003; Schade and Goldstein, 2002). Daytime light usually produces a tem-perature increase, which is also reported to increase biogenic methanol emissions exponentially (Folkers et al., 2008; Hu et al., 2011).
The approximate six-fold decrease in methanol concen-tration between day and night in this study falls within the reported range (0.3 to 7 times) of decrease (Jacob et al., 2005), which could indicate dry deposition at night and ad-sorption to vegetation and soils. Other than a likely decrease in methanol emissions from vegetation, a possible mode for the nighttime decrease in the aqueous-phase concentration of methanol is the advection of “cleaner” marine air to the rain collection site. This was suggested as an explanation for smaller nighttime concentrations of other rainwater compo-nents (e.g., H2O2, formaldehyde, formic acid, NO−3)at this
collection site (Avery et al., 2001).
2.8 Seasonal variations
The methanol concentration data collected in this study were divided into four seasonal time periods in order to exam-ine seasonal variations in the analyte concentrations (Fig. 4). The seasons were defined as winter (1 December–29 Febru-ary), spring (1 March–31 May), summer (1 June–31 Au-gust), and fall (1 September–31 November). The average volume-weighted concentrations of the methanol observed in this study during the spring and summer months were 1.0±0.3 µM and 2.7±0.9 µM, respectively, and were not
significantly different from each other (ANOVA:p=0.66).
Summer concentrations were however significantly differ-ent than fall and winter (ANOVA:p=0.01). Methanol
con-centrations were expected to increase in the spring as plant growth increases. A slight increase was seen, but methanol emissions from vegetation may have been hampered by an unusually dry spring. Methanol concentrations in rainwater were greatest in the summer, which was to be expected since the plant growing season occurs during summer, and ing summer temperatures can lead to exponentially increas-ing methanol emissions from plants (Folkers et al., 2008; Hu et al., 2011). The early summer peak in the methanol con-centrations agrees with simulated methanol seasonal cycles, and more specifically the monthly rainwater concentration peak in June (3.6±0.9 µM) is consistent with the peak seen
in several seasonal cycle simulations (Wells et al., 2012). Since methanol has a large biogenic source, gas-phase methanol concentrations are expected to have smaller con-centrations in the winter and fall months, when some plants are dormant. The volume-weighted average concentration of methanol during the winter and fall rain events was 0.9±0.2 µM and 0.7±0.2 µM, respectively. Various
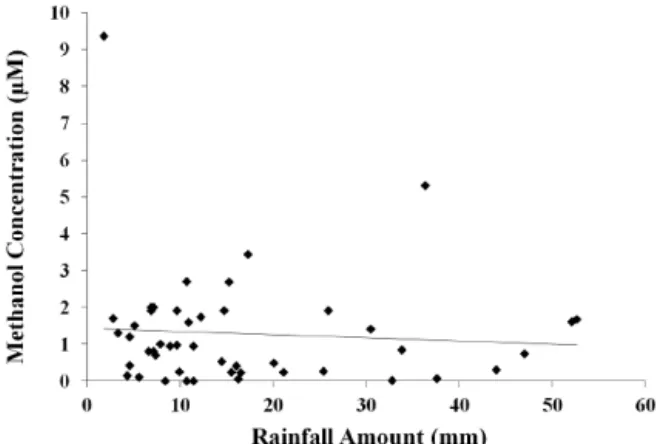
Figure 5.Methanol concentration vs. rainfall amount for all rain events.
(NC Drought 2008), killing vegetation that would otherwise have decayed during the fall.
2.9 Intercorrelation
Formaldehyde, acetaldehyde, rain amount, H+, NO−
3, H2O2,
NSS (non-sea-salt sulfate), formate, and acetate concentra-tions were determined in addition to methanol in this study. All rainwater components were analyzed by intercorrelation (Table 1). Methanol concentrations did not correlate with H+, NO−
3, and NSS, which suggests that the dominant source
of the methanol to rainwater is not anthropogenic. There was no correlation between methanol and the dissolved organic carbon (DOC) content of rainwater samples, indicating that the methanol makes up a variable fraction of the organic carbon pool. Methanol concentrations were strongly corre-lated with acetaldehyde, which has a primarily biogenic input (Millet et al., 2010), suggesting that the potential biogenic source of methanol is consistent with the larger concentration of methanol observed during the growing season (Fig. 5).
There was no significant correlation of methanol concen-trations with rainfall amount (Table 1, Fig. 5), suggesting it is not washed out of the atmosphere at this location, but rather is resupplied during a rain event. A possible mode of resup-ply is transpiration from plants. Rainwater initiates the tran-spiration stream in plants; methanol, being highly soluble, is transported in the transpiration stream and is emitted via the stomata (Fall and Benson, 1996; Niinemets et al., 2003). This methanol emission via transpiration may continue through-out rainfall events and lead to a local resupply that in turn is scavenged by continuing wet deposition. Formaldehyde also does not exhibit washout at this location (Kieber et al., 1999), which the authors attribute to in situ photochemical produc-tion from chromophoric dissolved organic matter in rainwa-ter (Southwell et al., 2010). The increase in methanol concen-trations during periods of peak sunlight intensity (Fig. 3) in-dicates a similar photochemical production mechanism may occur for methanol.
3 Implications
This work reports the first detailed analysis of methanol con-centrations in rainwater. The presence of methanol in all rain-water samples analyzed suggests that it is a ubiquitous com-ponent of precipitation. Rain events with terrestrial origins had greater concentrations than those of marine origin, in-dicating the potential for a significant continental source of methanol in rainwater. Correlation analysis with other rain-water analytes and greater growing season concentrations suggest this continental source is primarily biogenic rather than anthropogenic at this location. The lack of washout behavior implies a mode of methanol resupply during rain events possibly involving photochemical processes or tran-spiration from plants. Increases in methanol during daytime and summer rain events further underscore the importance of biogenic activity and photochemical production in the bio-geochemical cycling of methanol in precipitation.
Methanol concentrations represent 1.5±0.3 % (range:
0.08 to 14.4 %) of the DOC content, indicating that it is not a significant contributor to the overall carbon budget in pre-cipitation. The lack of correlation with the dissolved organic carbon content of samples suggests that the fraction of DOC that is methanol is also variable.
Methanol levels in rainwater measured in this study were up to ∼200 times greater than concentrations observed in
marine waters (48 to 296 nM) (Dixon et al., 2011), indicating wet deposition of methanol as a potentially significant source to marine waters. The important role by rainwater deposi-tion of atmospherically enriched analytes such as methanol in oceanic concentrations was demonstrated in an earlier study of hydrogen peroxide on surface seawater at the Bermuda Atlantic Time Series Station (Kieber et al., 2001a). The large increase in surface water concentrations after precipitation events indicated that rainwater deposition was a significant, and in some cases the dominant source of hydrogen peroxide to open ocean seawater (Kieber et al., 2001a). It is also likely that the rainwater flux of methanol to freshwater systems is episodically significant, similar to what has been observed for formaldehyde at this location (Kieber et al., 1999). Dur-ing the high irradiance summer months, formaldehyde con-tributes as much as 30 times the resident amount present in freshwater lakes of southeastern North Carolina (Kieber et al., 1999).
One of the important issues in the global biogeochemi-cal cycling of methanol is the magnitude and uncertainty of its wet depositional sink. Assuming the annual volume-weighted average reported at the Wilmington, NC, USA sampling site is an appropriate proxy for a global average rainwater concentration of methanol, and the global annual precipitation volume is ∼5.36×10¹⁷L (Pidwirny, 2008),
the global methanol wet deposition sink is estimated as 20±3.3 Tg yr−1. This estimate falls within the theoretical
range (4–50 Tg yr−1) produced by many global methanol
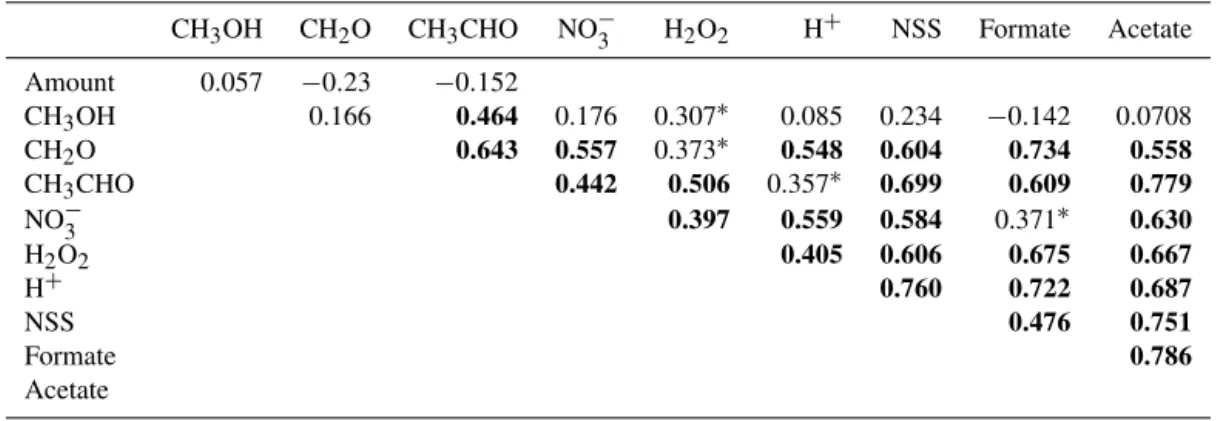
Table 1.Intercorrelations among methanol, formaldehyde, acetaldehyde, and various other rainwater components. Bold-faced values indicate significance atp <0.001. Asterisk (∗) indicates significance atp <0.05. Number of samples equals 47 for acetaldehyde, nitrate, and sulfate, 27 for formate and acetate, and 49 for others.
CH3OH CH2O CH3CHO NO−3 H2O2 H+ NSS Formate Acetate
Amount 0.057 −0.23 −0.152
CH3OH 0.166 0.464 0.176 0.307∗ 0.085 0.234 −0.142 0.0708
CH2O 0.643 0.557 0.373∗ 0.548 0.604 0.734 0.558 CH3CHO 0.442 0.506 0.357∗ 0.699 0.609 0.779
NO−
3 0.397 0.559 0.584 0.371∗ 0.630 H2O2 0.405 0.606 0.675 0.667
H+ 0.760 0.722 0.687
NSS 0.476 0.751
Formate 0.786
Acetate
2002; von Kuhlmann et al., 2003; Jacob et al., 2005) and is double the reported representative best estimates (9– 12 Tg yr−1)(Galbally and Kirstine, 2002; Heikes et al., 2002;
von Kuhlmann et al., 2003; Tie et al., 2003, Jacob et al., 2005). Results of this study are significant because they sug-gest that previous methanol budgets may be underestimat-ing removal by precipitation. Additional studies of methanol concentrations in rainwater should be carried out in various regions of the Earth to better constrain the global wet deposi-tional sink of this biologically and chemically labile analyte.
Acknowledgements. We thank the Marine and Atmospheric Chemistry Research Laboratory at the University of North Carolina Wilmington for sample collection and chemical analysis of the various rainwater analytes. National Science Foundation grant AGS 1003078 supported this work.
Edited by: P. Chuang
References
Avery, G. B., Willey, J. D., and Kieber, R. J.: Diurnal variations in major rainwater components at a coastal site in North Carolina: North America, Atmos. Environ., 35, 3927–3933, 2001. Bamberger, I., Hörtnagl, L., Schnitzhofer, R., Graus, M.,
Ruuska-nen, T. M., Müller, M., Dunkl, J., Wohlfahrt, G., and Hansel, A.: BVOC fluxes above mountain grassland, Biogeosciences, 7, 1413–1424, doi:10.5194/bg-7-1413-2010, 2010.
Brunner, A., Ammann, C., Neftel, A., and Spirig, C.: Methanol ex-change between grassland and the atmosphere, Biogeosciences, 4, 395–410, doi:10.5194/bg-4-395-2007, 2007.
Custer, T. and Schade, G.: Methanol and acetaldehyde fluxes over ryegrass, Tellus B, 59, 673–684, doi:10.1111/j.1600-0889.2007.00294.x, 2007.
Dixon, J. L., Beale, R., and Nightingale, P. D.: Rapid biologi-cal oxidation of methanol in the tropibiologi-cal Atlantic: significance as a microbial carbon source, Biogeosciences, 8, 2707–2716, doi:10.5194/bg-8-2707-2011, 2011.
Fall, R. and Benson, A.: Leaf methanol – the simplest natural prod-uct from plants, Trends Plant Sci., 1, 1360–1385, 1996. Folkers, A., Hüve, K., Ammann, C., Dindorf, T., Kesselmeier, J.,
Kleist, E., Kuhn, U., Uerlings, R., and Wildt, J.: Methanol emis-sions from deciduous tree species: dependence on temperature and light intensity, Plant Biol., 10, 65–75, doi:10.1111/j.1438-8677.2007.00012.x, 2008.
Galbally, I. E. and Kirstine, W.: The production of methanol by flowering plants and the global cycle of methanol, J. Atmos. Chem., 43, 195–229, 2002.
Harley, P., Greenberg, J., Niinemets, Ü., and Guenther, A.: Envi-ronmental controls over methanol emission from leaves, Biogeo-sciences, 4, 1083–1099, doi:10.5194/bg-4-1083-2007, 2007. Heikes, B. G., Chang, W., Pilson, M. E. Q., Swift, E.,
Singh, H. B., Guenther, A., Jacob, D. J., Field, B. D., Fall, R., Riemer, D., and Brand, L.: Atmospheric methanol budget and ocean implication, Global Biogeochem. Cy., 16, 80-1–80-13, doi:10.1029/2002GB001895, 2002.
Hu, L., Millet, D. B., Mohr, M. J., Wells, K. C., Griffis, T. J., and Helmig, D.: Sources and seasonality of atmospheric methanol based on tall tower measurements in the US Upper Midwest, Atmos. Chem. Phys., 11, 11145–11156, doi:10.5194/acp-11-11145-2011, 2011.
Jacob, D. J.: Global budget of methanol: constraints from atmospheric observations, J. Geophys. Res., 110, D08303, doi:10.1029/2004JD005172, 2005.
Jordan, C., Fitz, E., Hagan, T., Sive, B., Frinak, E., Haase, K., Cottrell, L., Buckley, S., and Talbot, R.: Long-term study of VOCs measured with PTR-MS at a rural site in New Hamp-shire with urban influences, Atmos. Chem. Phys., 9, 4677–4697, doi:10.5194/acp-9-4677-2009, 2009.
Karl, T.: Seasonal variation of biogenic VOC emissions above a mixed hardwood forest in northern Michigan, Geophys. Res. Lett., 30, 2186, doi:10.1029/2003GL018432, 2003.
Kieber, R. J., Skrabal, S. A., Smith, C., and Willey, J. D.: Redox Speciation of Copper in Rainwater: Temporal Variability and At-mospheric Deposition, Environ. Sci. Technol., 38, 3587–3594, 2004.
and its influence on seawater concentrations, J. Atmos. Chem., 39, 1–13, 2001a.
Kieber, R. J., Guy, A. L., Roebuck, J. A., Carroll, A. L., Mead, R. N., Jones, S. B., Giubbina, F. F., Campos, M. L. A. M., Willey, J. D. and Avery, G. B.: Determination of ambient ethanol concentrations in aqueous environmental matrixes by two independent analyses, Analytical chemistry, 85(12), 6095– 9, doi:10.1021/ac400974m, 2013.
Kieber, R. J., Long, M. S. and Willey, J. D.: Factors Influencing Nitrogen Speciation in Coastal Rainwater, J. Atmos. Chem., 52, 81–99, doi:10.1007/s10874-005-8354-6, 2005.
Kieber, R. J., Peake, B., Willey, J. D., and Jacobs, B.: Iron spe-ciation and hydrogen peroxide concentrations in New Zealand rainwater, Atmos. Environ., 35, 6041–6048, doi:10.1016/S1352-2310(01)00199-6, 2001b.
Kieber, R. J., Rhines, M. F., Willey, J. D., and Avery, G. B.: Rainwa-ter formaldehyde: concentration , deposition and photochemical formation, Atmos. Environ., 33, 3659–3667, 1999.
Legreid, G., Lööv, J. B., Staehelin, J., Hueglin, C., Hill, M., Buchmann, B., Prevot, A. S. H., and Reimann, S.: Oxy-genated volatile organic compounds (OVOCs) at an ur-ban background site in Zürich (Europe): seasonal varia-tion and source allocavaria-tion, Atmos. Environ., 41, 8409–8423, doi:10.1016/j.atmosenv.2007.07.026, 2007.
Millet, D. B.: Atmospheric volatile organic compound mea-surements during the Pittsburgh Air Quality Study: re-sults, interpretation, and quantification of primary and secondary contributions, J. Geophys. Res., 110, D07S07, doi:10.1029/2004JD004601, 2005.
Millet, D. B., Guenther, A., Siegel, D. A., Nelson, N. B., Singh, H. B., de Gouw, J. A., Warneke, C., Williams, J., Eerdekens, G., Sinha, V., Karl, T., Flocke, F., Apel, E., Riemer, D. D., Palmer, P. I., and Barkley, M.: Global atmospheric budget of acetaldehyde: 3-D model analysis and constraints from in-situ and satellite observations, Atmos. Chem. Phys., 10, 3405– 3425, doi:10.5194/acp-10-3405-2010, 2010.
Millet, D. B., Jacob, D. J., Custer, T. G., de Gouw, J. A., Goldstein, A. H., Karl, T., Singh, H. B., Sive, B. C., Talbot, R. W., Warneke, C., and Williams, J.: New constraints on terrestrial and oceanic sources of atmospheric methanol, Atmos. Chem. Phys. Discuss., 8, 7609–7655, doi:10.5194/acpd-8-7609-2008, 2008.
Monod, A., Chebbi, A., Durand-Jolibois, R., and Carlier, P.: Oxida-tion of methanol by hydroxyl radicals in aqueous soluOxida-tion under simulated cloud droplet conditions, Atmos. Environ., 34, 5283– 5294, doi:10.1016/S1352-2310(00)00191-6, 2000.
Mullaugh, K. M., Willey, J. D., Kieber, R. J., Mead, R. N., and Av-ery Jr, G. B.: Dynamics of the chemical composition of rainwater throughout Hurricane Irene, Atmos. Chem. Phys. Discuss., 12, 26995–27020, doi:10.5194/acpd-12-26995-2012, 2012. NC Drought: North Carolina Drought Management Advisory
Council, available at: http://www.ncdrought.org/archive/, 2008. NEI: National Emissions Inventory 2008, US Environmental
Pro-tection Agency, available at: http://www.epa.gov/ttnchie1/net/ 2008inventory.html, 2008.
NIST: National Institute of Standards Chemistry Webbook, avail-able at: http://webbook.nist.gov/chemistry/, 2014.
NOAA/ARL: National Oceanic and Atmospheric Administration Air Resources Laboratory, avalable at: http://ready.arl.noaa.gov/ HYSPLIT.php, 2013.
Niinemets, Ü.: Controls on the emission of plant volatiles through stomata: differential sensitivity of emission rates to stomatal closure explained, J. Geophys. Res., 108, 4208, doi:10.1029/2002JD002620, 2003.
Pidwirny, M.: Global Distribution of Precipitation, Fundamentals of Physical Geography, 2nd Edition., 17 April 2008, 2008. Schade, G. W. and Goldstein, A. H.: Plant physiological influences
on the fluxes of oxygenated volatile organic compounds from ponderosa pine trees, J. Geophys. Res., 107, ACH 2-1–ACH 2-8, doi:10.1029/2001JD000532, 2002.
Singh, H., Chen, Y., Tabazadeh, A., and Fukui, Y.: Distribution and fate of selected oxygenated organic species in the troposphere and lower stratoshere over the Atlantic, J. Geophys. Res., 105, 3795–3805, 2000a.
Singh, H., Chen, Y., Tabazadeh, A., Fukui, Y., Bey, I., Yantosca, R., Jacob, D., Arnold, F., Wohlfrom, K., Atlas, E., Flocke, F., Blake, D., Blake, N., Heikes, B., Snow, J., Talbot, R., Gregory, G. Sachse, G., Vay, S., and Kondo, Y.: Distribution and fate of se-lected oxygenated organic species in the troposphere and lower stratosphere over the Atlantic: subsonic assessment ozone and nitrogen oxide experiment (SONEX) and pollution from aircraft emissions in the North Atlantic Flight C, J. Geophys. Res., 105, 3795–3805, 2000b.
Snider, J. and Dawson, G.: Tropospheric light alcohols, carbonyls, and acetonitrile: Concentrations in the Southwestern United States and Henry’s Law data, J. Geophys. Res., 90, 3797–3805, 1985.
Southwell, M. W., Smith, J. D., Avery, G. B., Kieber, R. J., and Wil-ley, J. D.: Seasonal variability of formaldehyde production from photolysis of rainwater dissolved organic carbon, Atmos. Envi-ron., 44, 3638–3643, doi:10.1016/j.atmosenv.2010.06.044, 2010. Tie, X.: Biogenic methanol and its impacts on
tro-pospheric oxidants, Geophys. Res. Lett., 30, 1881,
doi:10.1029/2003GL017167, 2003.
Von Kuhlmann, R., Lawrence, M. G., Crutzen, P. J. and Rasch, P. J.: A model for studies of tropospheric ozone and nonmethane hydrocarbons: Model description and ozone results, J. Geophys. Res. Atmos., 108, 2003.
Walker, J. T., Aneja, V. P., and Dickey, D. A.: Atmospheric trans-port and wet deposition of ammonium in North Carolina, Atmos. Environ., 34, 3407–3418, doi:10.1016/S1352-2310(99)00499-9, 2000.
Wells, K. C., Millet, D. B., Hu, L., Cady-Pereira, K. E., Xiao, Y., Shephard, M. W., Clerbaux, C. L., Clarisse, L., Coheur, P.-F., Apel, E. C., de Gouw, J., Warneke, C., Singh, H. B., Gold-stein, A. H., and Sive, B. C.: Tropospheric methanol observations from space: retrieval evaluation and constraints on the seasonal-ity of biogenic emissions, Atmos. Chem. Phys., 12, 5897–5912, doi:10.5194/acp-12-5897-2012, 2012.
Willey, J. D., Kieber, R. J, Eyman, M. S., and Avery Jr, G. B.: Rain-water dissolved organic carbon: Concentrations and global flux, Global Biogeochem. Cy., 14, 139–148, 2000.