SLC Superfamilies: Liver and Kidney Specific Expression
and Promoter Activity Predict Variation
Stephanie E. Hesselson1., Pa¨r Matsson2., James E. Shima2., Hisayo Fukushima2., Sook Wah Yee2 , Yuya Kobayashi4, Jason M. Gow2, Connie Ha1, Benjamin Ma1, Annie Poon1, Susan J. Johns3, Doug Stryke3, Richard A. Castro2, Harunobu Tahara2, Ji Ha Choi2, Ligong Chen2, Nicolas Picard2, Elin Sjo¨din2,
Maarke J. E. Roelofs2, Thomas E. Ferrin3, Richard Myers4, Deanna L. Kroetz2, Pui-Yan Kwok1, Kathleen M. Giacomini2*
1Cardiovascular Research Institute, University of California San Francisco, San Francisco, California, United States of America,2Department of Bioengineering and Therapeutic Sciences, University of California San Francisco, San Francisco, California, United States of America,3Pharmaceutical Chemistry, University of California San Francisco, San Francisco, California, United States of America,4Department of Genetics, Stanford University School of Medicine, Stanford, California, United States of America
Abstract
Membrane transporters play crucial roles in the cellular uptake and efflux of an array of small molecules including nutrients, environmental toxins, and many clinically used drugs. We hypothesized that common genetic variation in the proximal promoter regions of transporter genes contribute to observed variation in drug response. A total of 579 polymorphisms were identified in the proximal promoters (2250 to +50 bp) and flanking 59 sequence of 107 transporters in the ATP Binding Cassette (ABC) and Solute Carrier (SLC) superfamilies in 272 DNA samples from ethnically diverse populations. Many transporter promoters contained multiple common polymorphisms. Using a sliding window analysis, we observed that, on average, nucleotide diversity (p) was lowest at approximately 300 bp upstream of the transcription start site, suggesting
that this region may harbor important functional elements. The proximal promoters of transporters that were highly expressed in the liver had greater nucleotide diversity than those that were highly expressed in the kidney consistent with greater negative selective pressure on the promoters of kidney transporters. Twenty-one promoters were evaluated for activity using reporter assays. Greater nucleotide diversity was observed in promoters with strong activity compared to promoters with weak activity, suggesting that weak promoters are under more negative selective pressure than promoters with high activity. Collectively, these results suggest that the proximal promoter region of membrane transporters is rich in variation and that variants in these regions may play a role in interindividual variation in drug disposition and response.
Citation:Hesselson SE, Matsson P, Shima JE, Fukushima H, Yee SW, et al. (2009) Genetic Variation in the Proximal Promoter of ABC and SLC Superfamilies: Liver and Kidney Specific Expression and Promoter Activity Predict Variation. PLoS ONE 4(9): e6942. doi:10.1371/journal.pone.0006942
Editor:Ulrich Zanger, Dr. Margarete Fischer-Bosch Institute of Clinical Pharmacology, Germany
ReceivedMay 13, 2009;AcceptedAugust 5, 2009;PublishedSeptember 9, 2009
Copyright:ß2009 Hesselson et al. This is an open-access article distributed under the terms of the Creative Commons Attribution License, which permits unrestricted use, distribution, and reproduction in any medium, provided the original author and source are credited.
Funding:This work was supported by NIH grant GM61390. The funders had no role in study design, data collection and analysis, decision to publish, or preparation of the manuscript. This publication was supported, in part, by NIH/NCRR UCSF-CTSI Grant Number UL1 RR024131. Its contents are solely the responsibility of the authors and do not necessarily represent the official views of the NIH.
Competing Interests:The authors have declared that no competing interests exist. * E-mail: [email protected]
.These authors contributed equally to this work.
Introduction
Membrane transporters facilitate the uptake and efflux of endogenous compounds, ions, and drugs across cellular mem-branes. Two major superfamilies, the ATP binding cassette (ABC) and solute carrier (SLC) families, are recognized as important for the transport of drugs and other xenobiotics. ABC transporters are efflux pumps that rely on ATP hydrolysis to actively move substrates across biological membranes [1,2]. In the ABC transporter superfamily, drug transport has primarily been associated with P-glycoprotein (ABCB1), Breast Cancer Resistance Protein (BCRP/ABCG2), and several members of the Multidrug-Resistance Associated Protein (MRP/ABCC) family. These transporters act to limit the access of drugs to protected tissue
compartments, and to eliminate drugs and metabolites via bile and urine [3,4]. Members of the SLC superfamily generally mediate the cellular uptake of nutrients such as glucose and amino acids, either through a facilitative transport mechanism where the substrate is translocated down its concentration gradient, or through secondary active transport mechanisms, where substrate translocation against a concentration gradient is coupled to ion flux along the cell membrane electrochemical gradient [5]. Like the ABC transporters, SLC transporters from a number of families accept a variety of structurally diverse drugs as substrates [6].
structure and function of transporter proteins. As expected, the number and minor allele frequencies of non-synonymous polymor-phisms in membrane transporters exons are generally small [10]. In contrast, in non-coding regions, polymorphisms are more abundant and minor allele frequencies are higher due to the lower selection pressure on these regions. Because of the generally lower genetic constraint in the regulatory regions of membrane transporters, we hypothesize that these regions may contain most of the common variation that underlies variable drug response. The proximal promoter has been defined as the region immediately surrounding the transcriptional start site, which is critical in binding polymerase complexes necessary for gene transcription [11,12]. Polymorphisms in the proximal promoter may alter the rate of transcription resulting in changes in gene expression, thereby ultimately affecting the level of cellular uptake or efflux. Polymorphisms that alter the expression levels of membrane transporters could determine the effective dosage of a drug by altering the systemic or tissue specific exposure to the drug. Some polymorphisms in the proximal promoter of membrane transporter genes identified in this sequencing effort have been shown to alter transcription rates in reporter assays and associate with expression levels in human lymphoblastoid cell lines [13,14].
To facilitate the discovery of variants that may influence drug transporter expression levels, we sequenced the proximal
promot-ers (2250 bp upstream to 50 bp downstream of the transcription
start site) [15] of 107 transporters including 42 ABC and 65 SLC membrane transporter genes (Table S1). To identify both common and rare variants we used a large sample consisting of DNA from 272 individuals from four populations. The level of variation in the proximal promoters of membrane transporters was compared to other gene regions. Using population genetic parameters, we compared variation among transporter families and superfamilies, and in transporters expressed primarily in the liver versus those expressed primarily in the kidney. We experimentally determined promoter activity using reporter assays and compared variation in strong and weak promoters. These data will contribute to the characterization of non-coding polymorphisms on the gene expression of membrane transporters.
Results
Polymorphism Discovery
New polymorphisms identified. A total of 52,445 base pairs were sequenced, and 579 polymorphisms (out of which 207 were singletons) were observed (Table 1). Single nucleotide
polymorphisms (SNPs) were the most common type of
polymorphism (93.6%). Cross-reference of our variants to the dbSNP database indicated that 369 polymorphisms were novel (dbSNP build 129) (Table S2). Of these novel variants, 54 had minor allele frequencies greater than 5% in at least one population.
The sequenced range covered 31,715 base pairs in proximal promoters and 20,730 base pairs of non-coding sequence upstream of the proximal promoters. In total, 373 polymorphisms
were observed in the proximal promoters and 206 in the 59
flanking regions. The observed frequency of polymorphisms in the
59 flanking regions (1/101 bp) was thus comparable to our
previous findings in non-coding intronic regions in 24 transporters (1/118 bp) [10]. The proximal promoter regions (1/85) were more
polymorphic than the intronic and 59flanking regions (Table 1).
Allele frequencies of polymorphisms. The number of polymorphisms per proximal promoter ranged from zero to fourteen, with the majority of transporters (90%) having at least
one common (MAF$5%) polymorphism or multiple singletons in
this region. Only 10% of promoters had no polymorphisms or only one singleton. The maximum number of singletons in any
promoter was four. Common polymorphisms with MAF.5% in
at least one population were found in 66% of proximal promoters. Interestingly, a large number of polymorphisms were found at a frequency of 20% or greater (Figure 1), which is in distinct contrast to polymorphisms found in coding regions of membrane transporters [10]. Transporters with the highest number of
polymorphisms in their proximal promoter wereSLC7A5, which
transports large neutral amino acids;SLC47A1, which transports
endogenous and exogenous organic cations; ABCC5, which
exports cyclic nucleotides; ABCD4, involved in the transport of
fatty acids; SLC22A5 and SLC22A16, organic anion/cation
Table 1.Summary of variation in membrane transporter promoters.
Base Pairs SNPs MAF,1% SNPs MAF$1% Indels Total
n PP 59 PP 59 PP 59 PP 59 Total
All Genes 107 31715 20730 133 74 214 121 26 11 579
All ABC 42 12464 9952 45 17 65 48 8 6 189
ABCA 9 2667 2140 13 2 13 7 3 1 39
ABCB 10 2987 1895 5 2 19 7 3 2 38
ABCC 11 3251 3054 12 6 12 14 1 2 47
ABCG 5 1500 1215 8 5 8 11 1 1 34
Other ABC 7 2059 1648 7 2 13 9 0 0 31
All SLC 65 19251 10778 88 57 149 73 18 5 390
SLC6 13 3889 2900 17 14 40 19 1 0 91
SLC17 6 1713 1074 9 9 9 2 0 2 31
SLC22 17 5037 1983 24 9 33 7 6 0 79
SLC28/29 6 1800 1238 10 2 15 12 1 0 40
SLCO 7 2100 945 8 4 11 3 3 2 31
Other SLC 16 4712 2638 20 19 41 30 7 1 118
transporters;SLC29A3, involved in the uptake of nucleotides,
anti-cancer and anti-viral drugs; SLC17A3, a phosphate transporter
located in the endoplasmic reticulum membrane; SLC15A1,
involved in the intestinal absorption and renal disposition of di-and tripeptides; di-and the sodium neurotransmitter symporters SLC6A4,SLC6A12,SLC6A17, andSLC6A19(Table S3).
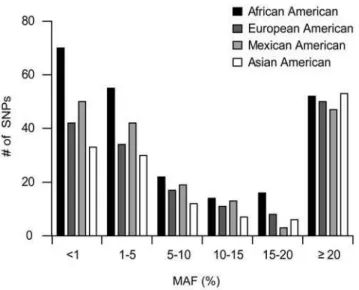
Population specificity of polymorphisms. The expected distributions of polymorphisms were observed in the four examined populations. In particular, a larger number of singletons and low frequency polymorphisms were observed in the African American population than in the other three populations (Figure 1) and the overall number of polymorphisms in African Americans was also higher than for any other population. However, 36% of the polymorphisms were not observed in the African American population and thus the addition of multiple populations contributed greatly to the magnitude of variation identified in the total sample (Table 2).
Insertions and Deletions. Thirty-seven of the polymorphisms identified were insertions or deletions (indels). The ratio of 37 indels to 537 SNPs (ca. 0.07) was similar to what was previously observed in intronic regions of ABC and SLC transporters (21 indels/350 SNPs or 0.06) [10]. Importantly the indel to SNP ratio in promoter regions was substantially greater than that observed in coding regions of ABC and SLC transporters (8 indels/330 SNPs or 0.02). These results suggest that insertion and deletion events, which may involve genomic rearrangement and recombination, are more likely in the upstream region than in the coding regions of genes. This observation is expected because indels in coding regions can lead to frameshift mutations, which result in a truncated protein that may be hyper-, hypo-, or neomophic explaining the high negative selective pressure in coding regions.
A greater number of indels per bp sequenced was observed in
the proximal promoters (1/1220) than in the 59 flanking regions
(1/1885 bp). The type of indel also differed between proximal
promoters and the 59 flanking sequence. Single base pair indels
made up a greater percentage of the total indels in the 59flanking
regions (91%) than in the proximal promoters (27%). It has been reported that a majority of indel sequences in the human genome are AT rich [16]. However, in the proximal promoters in our dataset, a majority (62%) of the indel sequences were instead GC rich. This is consistent with the observation that a large proportion of mammalian promoters contain CpG islands [12,17]. Most indels identified in this sequencing effort were flanked by identical sequence. This was true for both single bp indels that have at least one base pair of the same identity next to the insertion or deletion site (91%), and for multibase indels that have the identical complex sequence flanking the indel (54%). This leads to ambiguity in the exact location of the indel. The flanking sequence for all indels can be viewed at http://pharmacogenetics.ucsf.edu/ and Table S2).
Haplotypes. Strong linkage disequilibrium between polymorphisms in the 300 bp proximal promoter region was observed in all populations, as would be expected due to their proximity (Table S4). In general, when the minor alleles of polymorphisms were present in multiple populations, they also formed the same haplotypes in all populations. In most cases the minor allele of each polymorphism was in a haplotype that did not include the minor allele of any other polymorphism. Unexpectedly
there was more haplotype diversity inSLC22A5 in the Chinese
population than in any other population. The Chinese samples had four common haplotypes that differed from the reference haplotype, whereas the other three populations had only two haplotypes with frequencies above 2%. This may be related to a Chinese specific fixation of the minor allele of a SNP just downstream of the proximal promoter, which is present on all four common haplotypes.
Polymorphisms in ABC and SLC superfamilies. The two transporter superfamilies differed in the amount of genetic diversity observed. More polymorphisms were observed in the SLC promoters than in the ABC promoters, with both common and rare polymorphisms contributing to this observation. (Table 1)
Figure 1. Ethnic breakdown of proximal promoter SNPs.The number of SNPs present in each ethnic group are represented by shaded bars: African Americans (black), European Americans (dark grey), Mexican Americans (light grey), and Asian Americans (white). SNPs are categorized based on the minor allele frequency (MAF) occurring in each corresponding ethnic group.
doi:10.1371/journal.pone.0006942.g001
Table 2.Proximal promoter SNPs shared among 4 major ethnic groups.
Ethnic Groups
AA EA ME AS #of SNPs % of Total SNPs
x 90 26.0
x 30 8.6
x 33 9.5
x 42 12.1
x x 7 2.0
x x 17 4.9
x x 2 0.6
x x 8 2.3
x x 5 1.4
x x 5 1.4
x x x 24 6.9
x x x 4 1.2
x x x 1 0.3
x x x 1 0.3
x x x x 78 22.5
223 157 167 138 347
AA: African American; EA: European American; ME: Mexican American; AS: Asian American.
On average a polymorphism occurred every 106 base pairs in ABC transporter proximal promoters and every 75 base pairs in SLC transporters. Correspondingly, the fraction of transporters that had no polymorphisms or only one singleton in the proximal promoter was greater in the ABC (14%) than in the SLC superfamily (8%). This trend was also observed for polymorphisms with minor allele frequencies greater than 5%. That is, a lower
percentage of ABC promoters (57%) had at least one
polymorphism with a MAF.5% in at least one population
compared to SLC promoters (72%).
Population Genetics of Transporter Promoters
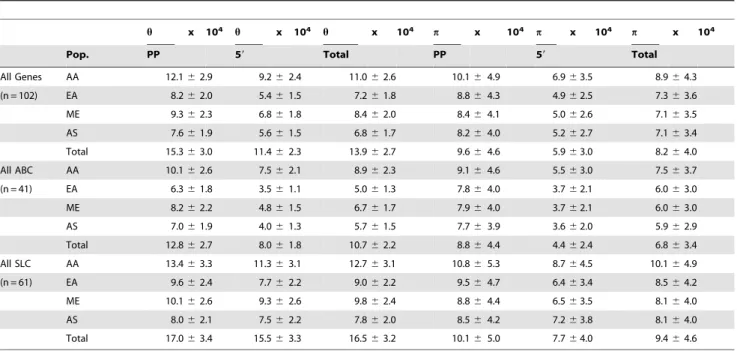
Population genetic statistics. Genetic variation in exons is constrained by negative selection [10,18,19]. To determine if this was also the case for the proximal promoter regions we calculated
the population genetic parametersp(nucleotide diversity/average
heterozygosity) and h (the population mutation parameter) for
each promoter, as well as two estimates of selection pressure: Tajima’s D and Fay and Wu’s H statistics (Tables 3, 4 and S3). Proximal promoters in membrane transporters appear to be characterized by greater genetic variation than coding regions of
these genes. In particular, ahof 15 and apof 9.6 were calculated
for 102 proximal promoters (Table 3). These values are greater
than the values of 8.9 and 4.0 observed previously forhandpin
the coding region of 24 membrane transporters [10]. These data suggest that variations in promoters are less deleterious than in exons, which have much less heterozygosity. Consistent with the greater number of polymorphisms observed in the SLC than in the
ABC family, the values ofpandhin both the proximal promoters
and 59 upstream flanking sequence were higher in SLC
transporters (Table 3). Values of p were also higher in many
protein domains in the SLC transporters than in the ABC transporters [10]. These data suggest that in general, SLC transporters can tolerate more variation than ABC transporters, possibly due to functional redundancies within many SLC
subfamilies. The trends for p and h were similar in all of the
populations (Table 3).
Regional differences in nucleotide diversity. On average, more variation was observed in the proximal promoter regions
than in the 59 flanking sequence (Table 1 and 3). To get a more
detailed view of the regional differences, we used a sliding window approach to determine local nucleotide diversity in ABC and SLC transporters in each of the examined populations (Fig. 2). In the
ABC transporters, bothhandp were at a maximum in a range
centered around 150 bp upstream from the transcription start site. A similar peak in nucleotide diversity was also observed in the SLC transporters, but in contrast to the ABCs, these transporters also showed a sharply increased variability further upstream. Common to both families was a minimum diversity centered around 250 bp upstream from the transcription start site.
Positive and negative selection. Though variation in most promoters was consistent with the infinite sites neutral model [20], some ABC and SLC transporters showed signs of positive selection (Table 4). The observation of positive selection is consistent with previous findings of positive selection in promoters of other genes [21,22]. The proximal promoters of many transporters appear to have similar pressures acting on them in more than one
population. ABCD2 and ABCD4 both involved in the transport
of fatty acids, and SLCO1A2, which mediates cellular uptake of
organic ions such as bile acids and steroidal compounds, appeared to have the greatest degree of positive selection as indicated by the low H values in all four populations (Table 4). Other transporters that showed some degree of positive selection in several
populations include SLC19A2, a vitamin B1 transporter, the
sodium neurotransmitter symporters SLC6A4and SLC6A14, and
some ABC transporters involved in multidrug resistance, (ABCB9, ABCC3and ABCC9). In contrast to these data showing positive
selection, ABCA13, which encodes the largest ABC transporter
with 5,058 amino acids [23], had significantly positive H values in two populations consistent with purifying or negative selection
Table 3.Summary of population genetics statistics of membrane transporter promoters.
h x 104 h x 104 h x 104 p x 104 p x 104 p x 104
Pop. PP 59 Total PP 59 Total
All Genes AA 12.162.9 9.262.4 11.062.6 10.164.9 6.963.5 8.964.3
(n = 102) EA 8.262.0 5.461.5 7.261.8 8.864.3 4.962.5 7.363.6
ME 9.362.3 6.861.8 8.462.0 8.464.1 5.062.6 7.163.5
AS 7.661.9 5.661.5 6.861.7 8.264.0 5.262.7 7.163.4
Total 15.363.0 11.462.3 13.962.7 9.664.6 5.963.0 8.264.0
All ABC AA 10.162.6 7.562.1 8.962.3 9.164.6 5.563.0 7.563.7
(n = 41) EA 6.361.8 3.561.1 5.061.3 7.864.0 3.762.1 6.063.0
ME 8.262.2 4.861.5 6.761.7 7.964.0 3.762.1 6.063.0
AS 7.061.9 4.061.3 5.761.5 7.763.9 3.662.0 5.962.9
Total 12.862.7 8.061.8 10.762.2 8.864.4 4.462.4 6.863.4
All SLC AA 13.463.3 11.363.1 12.763.1 10.865.3 8.764.5 10.164.9
(n = 61) EA 9.662.4 7.762.2 9.062.2 9.564.7 6.463.4 8.564.2
ME 10.162.6 9.362.6 9.862.4 8.864.4 6.563.5 8.164.0
AS 8.062.1 7.562.2 7.862.0 8.564.2 7.263.8 8.164.0
Total 17.063.4 15.563.3 16.563.2 10.165.0 7.764.0 9.464.6
(Table S3). All other promoters were consistent with the infinite sites, neutral model.
Relationship Between Genetic Variation and Promoter Activity
Variation in hepatic and renal transporters. Because many of the transporters analyzed in this study play a role in hepatic and renal drug elimination, we compared genetic variation in liver and kidney transporters. Transporters were classified as having significant expression in liver or kidney (or both) if their expression levels ranked in the top third of expressed genes in multiple sources of microarray data [24–27] or they showed significant expression in RT-PCR experiments [28]. The transporters classified as being expressed in the kidney, the liver, or in both tissues based on these available datasets are presented in Table S5. We then determined the nucleotide diversity for the transporters included in each of the three groups. Transporters that were predominantly expressed in the liver were found to have higher average heterozygosity than transporters that were highly expressed in the kidney, and transporters expressed at high levels in both tissues had the lowest average heterozygosity (Figure 3 and Table S6).
Genetic variation in proximal promoters expressed in cell lines
To confirm that the sequenced regions contain a functional promoter, we cloned a subset of the sequenced regions into firefly luciferase reporter constructs and expressed them in continuous cell lines from gastrointestinal epithelia (JEG-3 and HCT-116), kidney (ACHN), liver (HEPG2), pancreas (PANC-1) and glioblas-toma (T98G). We selected 21 promoters of the two major superfamilies, SLC and ABC membrane transporters that play significant role in transporting drug molecules and xenobiotics into or out of the cells. In addition, these selected groups of transporters, such as organic cation transporters (SLC22A), nucleoside transporters (SLC28A and SLC29A) and ABC transporters have high expressions in liver and/or kidney tissues where they play important roles in drugs/xenobiotics absorption, distribution and elimination. Transcriptional activity of the most common haplotype of each promoter is shown in Figure 4A. The mean activity across all tested cell lines was significantly above the negative control in 15 out of 21 promoters suggesting that the majority of the cloned regions have measurable promoter activity (Figure 4A). We designated promoters as having low, intermediate
Table 4.Positive selection in membrane transporter promoters.
H (Significance)
AA EA ME AS
ABC Transporters Significant in 4 Populations
ABCD2 23.56 (**) 23.79 (***) 23.86 (***) 23.81 (***)
ABCD4 25.09 (*) 25.52 (**) 25.21 (*) 25.54 (***)
Significant in 3 Populations
ABCB9 20.76(n. s.) 22.31 (***) 22.10 (*) 22.73 (**)
ABCC3 20.89(n. s.) 21.59 (*) 21.58 (*) 23.44 (**)
ABCC9 23.87 (***) 23.97 (***) 24.01 (***) n. a.
Significant in 2 Populations
ABCA4 20.66(n. s.) n. a. 21.86 (*) 21.97 (**)
ABCD1 0.22(n. s.) 21.55 (*) 21.35 (*) 21.34(n. s.)
Totalntransporters with significant H
3 6 7 5
SLC Transporters Significant in 4 Populations
SLC19A2 21.97 (*) 22.76 (**) 22.49 (**) 21.81 (*)
SLCO1A2 25.72 (***) 25.84 (***) 25.08 (**) 25.00 (***)
SLC22A10 21.74 (*) 21.87 (*) 21.90 (*) 22.00 (***)
Significant in 3 Populations
SLC6A4 21.85 (**) 21.81(n. s.) 21.82 (*) 21.91 (*)
SLC6A14 20.51(n. s.) 21.62 (*) 21.59 (*) 21.94 (*) SLC47A1 22.00 (*) 21.93(n. s.) 22.01 (*) 22.01 (*)
SLCO1B1 21.74(n. s.) 21.90 (*) 21.97 (*) 21.90 (*)
Significant in 2 Populations
SLC6A12 21.60(n. s.) 21.81 (*) 21.66(n. s.) 22.00 (***)
SLC15A1 21.20(n. s.) 21.94 (*) n. a. 21.93 (**)
Significant in 1 Population
SLC18A1 20.96(n. s.) 0.04(n. s.) 20.41(n. s.) 21.23 (*)
SLC22A12 21.51(n. s.) 22.67 (*) 22.20(n. s.) 21.53(n. s.)
Totalntransporters with significant H
5 8 7 10
or high activity based on the observed change in luciferase activity compared to negative controls and we observed that genetic variation was greater in promoters with the greatest activity. In particular, the third of promoters with the highest activity (.5 fold
above the control vector) had significantly greaterp values than
the third of promoters with the lowest activity (,2 fold above the
control vector) (Figure 4B). Intermediate activity promoters had
intermediate p values. These results were also mirrored in a
greater average number of polymorphisms per promoter (5) for the promoters with high activity than for those with low activity (2.7). SNPs in the proximal promoter may alter expression levels of the transporters by affecting the rate of transcription. We used publicly available data for gene expression in immortalized lymphoblastoid cell lines derived from the individuals in the HapMap cohort [29], and correlated these with genotype data for the same individuals.
Notably, out of a total of 46 common (MAF.5%) SNPs that were
observed both in our study cohort and in the populations sampled in
the HapMap project, five SNPs were significantly associated with altered levels of transporter expression in lymphoblastoid cell lines (Table S7). This resulted in a significantly higher frequency (11% of the interrogated SNPs) compared to the frequency of associations at
the same significance level when all HapMap SNPs in a650,000 bp
range surrounding the same transporters was considered (3%).
Discussion
Proximal promoters of membrane transporter genes have a high degree of variation
A strength of this study compared to genome-wide genotyping efforts such as the HapMap project, is that the complete resequencing of 107 membrane transporter promoters allowed polymorphism discovery that was unbiased by previous knowl-edge. In contrast, the HapMap project aimed to characterize the entire human genome, at the expense of having lower coverage of
Figure 2. Location of nucleotide diversity in transporter promoters relative to the transcription start site.Nucleotide diversity was estimated using the mutation parameter (h) and the average heterozygosity per site parameter (p), in a 100 bp sliding window. The diversity
parameters are plotted as functions of the center of the sliding window. Blue line: African Americans; red line: European Americans; gold line: Mexican Americans; green line: Asian Americans; and black line: combined population.
individual regions [30]. We observed a high degree of genetic variation in the upstream regions of membrane transporter genes
including both the proximal promoters (2250 bp to+50 bp) and
the 59 flanking regions. Based upon population genetic analysis,
this variation was higher than variation reported previously in the coding region or flanking intronic regions of a subset of these membrane transporter genes [10]. It might be expected that the loci that contain a proximal promoter would be less likely to accumulate polymorphisms and for polymorphisms in this region to have relatively low minor allele frequencies due to functional constraint. However, many membrane transporter promoters not only have a high number of polymorphisms, but many of these polymorphisms also have high minor allele frequencies. One explanation for this is that the actual proximal promoter, which binds the transcriptional machinery, may be small and may vary depending upon the gene. For example, in 45 human genes, Cooper et al observed that, on average, the maximal promoter
activity assessed in reporter assays occurred between 2250 and
2350 bp upstream of the transcriptional start site [11]. This
region may represent a true basal or proximal promoter. Notably, this region coincides with a region of low variation in the sliding
window analysis of p and h in our study, which may contain
important functional sites (Figure 2). An alternative explanation is that polymorphisms in regulatory regions may be altering the expression of genes and that this altered expression may be contributing to human evolution in some cases [31].
Promoter polymorphisms may alter gene expression
Polymorphisms in cis-regulatory regions have been shown to alter phenotypic traits in many species including humans. Some examples
in humans include malaria resistance and lactase persistence [31]. SNPs in the promoters of transporters have been shown to associate with altered expression levels. For example, Poonkuzhali et al
described novel SNPs in theABCG2promoter region (-15994C.T
(rs7699188), -56846A.C, and -15622C.T) that were significantly
associated with ABCG2 expression in lymphoblast, liver and/or
intestine tissues, and one of these was moderately associated with clearance of the anticancer drug, imatinib [32]. We have also identified SNPs in this study that cause altered promoter activity in
reporter assays. For example, the nucleoside transporter,SLC28A2,
has five SNPs in its proximal promoter, and the minor allele of one of
these (rs2413775 MAF$20% in all four populations) was associated
with increased luciferase activity in cell lines and inin vivoinjections of the reporter construct into mouse liver [13]. The carnitine transporter, SLC22A5, has six SNPs in its proximal promoter. The G allele of rs2631367 is associated with higher luciferase activity and expression levels in lymphoblastoid cell lines. The G allele is monomorphic in Asians and has an allele frequency between 50–60% in the other three populations. This allele contributes to observed ethnic differences in expression level of the transporter in lymphoblastoid cell lines [14]. Additional polymorphisms observed in this study may regulate expression levels of transporters and could provide an explanation for some variability observed in drug disposition.
Some proximal promoters of membrane transporters show signs of positive selection
The signature of positive and negative selection is the high number of rare variants as opposed to common ones [33]. Many mutations in loci experiencing negative selection, such as coding regions, do not increase in frequency because they do not increase fitness. In contrast, for loci experiencing positive selection, new mutations do increase fitness and rise in frequency until the ancestral allele is reduced to a low frequency. For most of the promoters in our study, there was no evidence for either positive or negative selection, as assessed by both Tajima’s D and Fay and Wu’s H statistics (Table S3). However, for some promoters, the ancestral allele (defined as the allele shared between human and chimpanzee) was rare, indicating that there is a positive selection pressure on the derived, human-specific allele. These data suggest that mutations in the proximal promoters are often neutral and sometimes advantageous. This is in contrast to the coding regions of membrane transporters, which were previously shown to have
low values of p and negative D values, indicative of negative
selection pressure [10]. This suggests that new mutations in the promoter regions of membrane transporters are less likely to be disadvantageous than mutations in the coding regions.
The observation of positive selection in membrane transporter promoters is consistent with previous findings. Positive selection was observed in some proximal promoters in human specific and primate specific transcription factor binding sites in a genome wide analysis of Hap Map and Perlegen SNPs [21] and has also been found in genes involved in brain activity and in nutrient homeostasis [22]. In this study, of the promoters that had significant H values in at least two populations, several encoded transporters involved in neural function and nutrient disposition (e.g., sodium neurotransmitter symporters and proteins involved in the transport of fatty acids, vitamin B1, and cyclic nucleotides).
One of the transporters, SLC6A4, encodes the serotonin
trans-porter,SERT. This transporter is responsible for the re-uptake of
serotonin into pre-synaptic neurons and is the target of many clinically used anti-depressants [34]. A promoter variant in this transporter found upstream of the region that we analyzed has been associated with many clinical phenotypes including depres-sion and suicide [35]. Polymorphisms in the cis-regulatory regions
ofSLC6A4have also been associated with creativity in humans and dispersal behavioral in macaques [31]. Our finding that this and another SLC6 family neurotransmitter transporter is under positive selection is consistent with the rapid evolution of the
human brain. It is also interesting thatSLCO1A2(OATP1A2), the
transporter whose promoter exhibited the highest degree of positive selection in all four populations, is found in the blood brain barrier [36]. This transporter is thought to play a role in the regulation of thyroid hormone levels in the brain and in the CNS levels of various other endogenous compounds and xenobiotics.
Proximal promoters of liver transporters show greater variation than those of kidney transporters
We observed greater variation in the proximal promoters of transporters expressed primarily in the liver in comparison to those
expressed primarily in the kidney. These results suggest that the promoter regions of transporters expressed primarily in the kidney are under more selective pressure than those of transporters expressed primarily in the liver. One explanation may be that many liver transporters are known to be highly inducible and thus are associated with a wide range of expression levels in human liver [37]. Selective pressure against variants in the proximal promoter region, which could potentially result in altered expression levels, may be low. In contrast, kidney transporters are generally not as inducible as liver transporters, and there may be more selective pressure against genetic variation in their promoter regions that result in variation in the expression levels of the transporters. High genetic variation in the promoter regions of liver transporters may thus contribute to the well-recognized wide inter-individual variation in hepatic drug clearance, which is much greater than variation in renal drug clearance [38]. Our results
Figure 4. A. Reporter activity of proximal promoter constructs in human cell lines.The proximal promoters were amplified from human genomic DNA and cloned into pGL-4 gene expression vectors. Luciferase activity was measured 24 h after transfection of a panel of human cell lines. Promoter activity is expressed aslog2[(1+Firefly luciferase/Renilla luciferase)/Average of the negative control]. Promoters were classified as having high, intermediate or low activity if the average relative activity across multiple cell lines was above 4, between 2 and 4, or below 2, respectively.B. Nucleotide diversity in high, intermediate and low activity promoters.
also suggest that there may be a greater number of redundant regulatory mechanisms that influence the rate of transcription of transporters expressed primarily in the liver than those expressed primarily in the kidney. While the proximal promoter regions examined in these liver expressed genes may be sufficient to control expression, they may not be the only promoter regions responsible for the overall control of hepatic expression levels. A majority of human genes have been shown to contain multiple alternative promoters [11,12]. This has been proposed as a physiological mechanism to dynamically regulate expression levels of transporters and other genes depending on the tissue and on external stimuli [11,12,39,40], and could allow for variation in the proximal promoter regions without significant detrimental changes in overall expression.
Strong promoters show greater variation than weak promoters
One of the most interesting observations in this study was that promoters showing high activity in luciferase reporter gene assays had significantly more variation than promoters with intermediate or low activity (Figure 4B). Though speculative, it is possible that strong promoters may be able to tolerate mutations that result in moderately reduced or increased activity, because their transcrip-tional activity would still be sufficient to maintain functranscrip-tional expression levels. In contrast, weak promoters may not be able to tolerate mutations that result in reduced activity, since even minor decreases in promoter activity could result in deleteriously low transcriptional rates and expression levels of these genes. Although it cannot be ruled out that the weak promoters do not represent the true proximal promoters of these genes due to prediction errors, we deem it unlikely that random prediction errors would result in the trend seen in Figure 4B. It is also possible that the weak promoters may rely on additional enhancer elements upstream of the regions cloned into the expression system. Transcription factor binding sites and DNA motifs that direct tissue specific expression are often found further upstream than 250 bp from the transcription start site [41]. These regions may have comparable levels of genetic variation as the strong proximal promoters. Nevertheless our experimental results suggest that most of the loci that we sequenced do drive transcriptional activity in cell lines. The observed alleles can be tested for their effects on expression and eventually on drug response. Ultimately, investi-gation of the alleles discovered in this study may improve the safety and efficacy of commonly used pharmaceuticals.
Conclusions
In summary, we resequenced the promoters of 107 membrane transporters in ethnically diverse populations. We detected a total of 579 polymorphisms, and 369 SNPs had not been reported previously. On average, variation was found to be higher in SLC than in ABC transporters, and in transporters highly expressed in the liver than in kidney-specific transporters. The function of a subset of the promoters was experimentally verified in a reporter system, and promoters with more genetic variation were shown to have higher activity than had less variable promoters regions.
Materials and Methods
Ethics Statement
Written informed consent was obtained from all individuals who provided their DNA for this study. The collection of these samples was approved by UCSF’s Committee on Human Research (CHR
approval#H531-17912-09B).
Variant Identification
Study Subjects. Sequenced subjects are a subset of the SOPHIE cohort representing ethnically diverse populations in the San Francisco Bay Area. Subjects are healthy,18–40 year old males and females. Subjects have four grandparents from the population they identify with (African American, Caucasian, Chinese, and Mexican). Subjects were recruited from the Bay Area via flyers and on-line postings and several sites in San Francisco These sites include the Community Health Network of San Francisco, San Francisco General Hospital (SFGH), local churches, colleges and community organizations such as La Clinica de La Raza Oakland, Fair Oaks Clinic Redwood City, Health & Environment Resource Center (HERC) Bayview, Hunters Point, and SFGH GCRC. Subjects self-reported as
healthy, non-smokers, non-excessive alcohol drinkers (,2 drinks/
day), and are not on chronic medications. The SOPHIE cohort includes 194 African Americans, 150 Mexican Americans, 178 Chinese Americans, and 264 Caucasian. DNA was extracted from
frozen blood samples and stored at280uC until use.
Sequencing. Genomic DNA from 272 subjects was sequenced. Sixty-eight subjects each of African American (41 female/27 male), Caucasian (34 female/34 male), Chinese (44 female/24male), and Mexican (49 female/19 male) descent make up the sequenced panel. PCR primers were designed to include 250 bp upstream and 50 bp downstream of the transcriptional start site of the RefSeq gene listed in the UCSC database. Primers were designed using Primer 3 (http://frodo.wi.mit.edu/cgi-bin/ primer3/primer3_www.cgi). There were two general methods for
PCR. The first protocol used 4 ng genomic DNA in a10ml
reaction composed of 1ml of 10Xbuffer, 0.7ml of MgCl2(50 mM),
0.4ml of dNTP (2.5 mM), 0.03ml of Platinum taq (5 U/ml), 2ml
of Forward primer(1mM), and 2ml of Reverse primer(1mM) with
cycling conditions of 95uC for 2 min, 35 cycles of 92uC for 10 sec,
60uC for 20 sec, 72uC for 1 min, after the end of the 35 cycles
followed by a 10 min hold at 72uC. The second protocol used 8 ng
genomic DNA in 10ml reaction composed of 1ml of Buffer, 2ml
of Q-mix, 0.4ml of dNTP (2.5 mM), 0.06ml of Qiagen Taq
polymerase, 2ml of Forward primer (2mM), 2ml of Reverse
primer (2mM) (Buffer, Q-Mix, and enzyme are from Qiagen hot
start kit) with cycling conditions of 95uC for 15 min, 35 cycles of 94uC for 1 min, 60uC for 1 min, 72uC for 1 min, after end of the
35 cycles followed by a 10 min hold at 72uC. PCR and sequencing
primers in addition to annealing temperature are listed in Table S8. Purified PCR products were sequenced in one direction using ABI PRISM BigDye terminator sequencing Version 3.1 and an
ABI Prism 3730 DNA analyzer. The 12ml sequencing reaction
was composed of 2.5ml of ExoSapped PCR product, 4.5ml of
sequencing primer (1mM), 1ml BigDyeV3.1, 2ml of 5X buffer,
and 2ml water. Cycling conditions were 96uC for 2 min, 25 cycles
of 96uC for 15 sec, 50uC for 1 sec, 60uC for 4 minutes. DNA
sequence files were imported into and scored with
SEQUENCHER (Gene Codes, Ann Arbor, MI) Due to technical difficulties the following promoters were missing more
than 20 bp of the target region:ABCA3,ABCB5,ABCB6,ABCD2,
SLC6A9,SLC9A3,SLC17A8,SLC22A14,SLC32A1,SLCO5A1, and SLCO6A1.
SLC22A5, ABCG1, ABCG4, and ABCB4) had an excess of homozygosity, especially in the Chinese samples. One promoter (SLCO6A1) had an excess of heterozygotes. Polymorphisms in ABCF3 did not pass HWE equilibrium even though PCR and sequencing was preformed with two different primer sets. Eight percent of promoters were double scored; no major discrepancies were found and no additional polymorphisms were observed.
Functional Characterization of Promoters
Construction of the membrane transporter promoter region. To construct the reporter plasmids containing the proximal promoter regions of the membrane transporters, we
used Primer 3 (http://frodo.wi.mit.edu/cgi-bin/primer3/
primer3_www.cgi) to design primers by inputting 500 bp of upstream and 100 bp downstream sequence relative to the predicted transcription start site (TSS) of the gene. These regions were amplified by a PCR of human genomic DNA using the touchdown PCR protocol [17] or other PCR protocols reported previously by our group [13,14]. The primers used to construct the membrane transporter promoter regions are listed in Table S9. The amplified promoter fragments were digested with the appropriate restriction enzymes (New England Biolabs) and cloned into the reporter gene expression vector pGL-4 (Promega), which contains a Firefly luciferase reporter gene downstream from the multiple cloning site.
Cell culture, transient transfections, and luciferase activity assays. Similar protocols were used for determining the activity of ABC and SLC transporter promoters. For the ABC transporters, the constructs were transiently transfected into HepG2, PANC-1, HCT-116, JEG-3 and T98 cells, using a previously reported transfection protocol [17]. These cell lines were purchased from the American Type Culture Collection (Manassas, VA). A slightly modified protocol, described in detail in Tahara et al. and Yee et al., was used to transfect the SLC transporter proximal promoter constructs into HepG2, HCT-116 and ACHN cells. ACHN cells were purchased from the American Type Culture Collection (Manassas, VA) and the HepG2 and HCT-116 were supplied by the Cell Culture facility (University of California San Francisco). Briefly, 24 hours after transfection the cells were assayed for luciferase activity in a PE Wallac
LuminometerTM (Perkin Elmer) or GloMax 96 Microplate
Luminometer (Promega) using the Dual-GloTM Luciferase Assay
System (Promega) according to the manufacturer’s instructions. For normalization of the data between cell types, the relative promoter activities were expressed as log2 [(1+ Firefly luciferase/
Renilla luciferase)/Average of the negative control][11].
Association of Variants with Transporter Expression Levels
SNPs found both in our study populations and in the HapMap dataset (Phase II, release 23) were associated with transporter mRNA expression levels in lymphoblastoid cell lines derived from the 210 unrelated HapMap individuals [29]. Genotype data were downloaded from the HapMap website (http://www.hapmap. org), and normalized expression data from http://www.sanger.ac. uk/humgen/genevar/. This data has been deposited in the MIAME database with accession number GSE6536. Associations were calculated using PLINK v1.04 [42] (http://pngu.mgh.
harvard.edu/purcell/plink/) for 46 common SNPs (MAF$5%)
that were found in both datasets, as well as for all common
HapMap SNPs located within a650,000 bp range surrounding
the same transporter genes. A moderate nominal significance level
ofp,0.01 was used to determine if significantly associated SNPs
were found at higher frequency in the sequenced promoter regions
compared to in the entire650,000 bp range.
Population Genetic Parameters
Nucleotide diversity was estimated using the mutation
param-eter (h; Eq. 1) and the average heterozygosity per site parameter
(p; Eq. 2) (Tajima, 1989), assuming an infinite sites neutral
mutation model:
^ h h~PS
n{1 i~1 1 i
ð1Þ
^ p p~ n
n{1 XS
i~1
2piqi ð2Þ
where S is the number of segregating sites, n is the number of
chromosomes analyzed andpi and qi are the frequencies of the
non-ancestral and ancestral alleles, respectively. Both measures were normalized for the number of bases sequenced. Two different test statistics were used to assess deviations from the variation
patterns expected under the neutral mutation model: Tajima’sD
[43] statistic was calculated as the normalized difference between
thepand hstatistics, and Fay and Wu’s Hstatistic [33,44] was
calculated as the difference betweenpandhH:
^ h hH~ n
n{1 XS
i~1
2p2i ð3Þ
In the calculation ofH, the chimpanzee allele (UCSC Genome
Browser Pan Troglodytes March 2006 assembly) was used as the
ancestral human allele. Variant sites were included in the analysis only if the chimpanzee allele matched one of the determined
human alleles and the local (65 bp surrounding the variant site)
chimpanzee–human alignment was unambiguous. To assess
statistical significance, the observed values of D and H were
compared to the parameter distributions in simulated populations having the corresponding number of chromosomes and segregat-ing sites. Ten thousand simulations were performed for each
sequenced region using the ms software [45] under the
conservative assumption of no recombination. The proportion of
simulatedHorDparameters with more extreme values than those
observed corresponds to the hypothesis testp-value.
Nucleotide diversity was calculated for each transporter individually, as well as for various groups of genes (e.g., ABC transporters, SLC transporters, transporters highly expressed in the liver and/or the kidney, transporters with high or low
promoter activity inin vitroassays). For each transporter/group of
transporters, parameters were calculated for the proximal
promoter region (+50 to 2250 bp surrounding the transcription
start site), the 59 flanking sequence, and the entire sequenced
regions.
To determine the distribution of genetic variation relative to the transcription start sites,handpwere calculated in a 100 bp sliding window and plotted against the position of the window center (Fig. 2). The results were robust for changes in window size (20, 50, 100, and 200 bp windows were examined). The promoter regions
of 5 genes (ABCC2,SLC29A1,SLC28A2,SLC7A5, and SLC13A1)
sample set, these transporters were not included in the calculations of population genetics statistics.
Supporting Information
Table S1
Found at: doi:10.1371/journal.pone.0006942.s001 (0.02 MB XLS)
Table S2
Found at: doi:10.1371/journal.pone.0006942.s002 (0.14 MB XLS)
Table S3
Found at: doi:10.1371/journal.pone.0006942.s003 (0.23 MB XLS)
Table S4
Found at: doi:10.1371/journal.pone.0006942.s004 (0.09 MB XLS)
Table S5
Found at: doi:10.1371/journal.pone.0006942.s005 (0.01 MB XLS)
Table S6
Found at: doi:10.1371/journal.pone.0006942.s006 (0.01 MB XLS)
Table S7
Found at: doi:10.1371/journal.pone.0006942.s007 (0.01 MB XLS)
Table S8
Found at: doi:10.1371/journal.pone.0006942.s008 (0.02 MB XLS)
Table S9
Found at: doi:10.1371/journal.pone.0006942.s009 (0.01 MB XLS)
Acknowledgments
SOPHIE samples were collected by the GCRC at San Francisco General. We would like to thank Leslie Floren for her assistance maintaining the SOPHIE sample set.
Author Contributions
Conceived and designed the experiments: SEH HF SWY YK JMG HT RMM DLK PYK KMG. Performed the experiments: SEH HF SWY YK JMG CH BM AP RAC HT JHC LC NP ES MJER. Analyzed the data: SEH PM JES HF YK SJJ DS TF RMM DLK PYK KMG. Contributed reagents/materials/analysis tools: DLK KMG. Wrote the paper: SEH PM JES HF SWY RMM DLK PYK KMG.
References
1. Borst P, Elferink RO (2002) Mammalian ABC transporters in health and disease. Annu Rev Biochem 71: 537–92.
2. Glavinas H, Krajcsi P, Cserepes J, Sarkadi B (2004) The role of ABC transporters in drug resistance, metabolism and toxicity. Curr Drug Deliv 1(1): 27–42.
3. Schinkel AH, Wagenaar E, Mol CA, van Deemter L (1996) P-glycoprotein in the blood-brain barrier of mice influences the brain penetration and pharmacolog-ical activity of many drugs. J Clin Invest 97(11): 2517–24.
4. Leslie EM, Deeley RG, Cole SP (2005) Multidrug resistance proteins: role of P-glycoprotein, MRP1, MRP2, and BCRP (ABCG2) in tissue defense. Toxicol Appl Pharmacol 204(3): 216–37.
5. Hediger MA, Romero MF, Peng JB, Rolfs A, Takanaga H, et al. (2004) The ABCs of solute carriers: physiological, pathological and therapeutic implications of human membrane transport proteins: Introduction. Pflugers Arch 447(5): 465–8.
6. Ozawa N, Shimizu T, Morita R, Yokono Y, Ochiai T, et al. (2004) Transporter database, TP-Search: a web-accessible comprehensive database for research in pharmacokinetics of drugs. Pharm Res 21(11): 2133–4.
7. Pasanen MK, Neuvonen M, Neuvonen PJ, Niemi M (2006) SLCO1B1 polymorphism markedly affects the pharmacokinetics of simvastatin acid. Pharmacogenet Genomics 16(12): 873–9.
8. SEARCH Collaborative Group, Link E, Parish S, Armitage J, Bowman L, et al. (2008) SLCO1B1 variants and statin-induced myopathy—a genomewide study. N Engl J Med 359(8): 789–99.
9. Shu Y, Brown C, Castro RA, Shi RJ, Lin ET, et al. (2008) Effect of genetic variation in the organic cation transporter 1, OCT1, on metformin pharmacokinetics. Clin Pharmacol Ther 83(2): 273–80.
10. Leabman MK, Huang CC, DeYoung J, Carlson EJ, Taylor TR, et al. (2003) Pharmacogenetics Of Membrane Transporters Investigators.Natural variation in human membrane transporter genes reveals evolutionary and functional constraints. Proc Natl Acad Sci U S A 100(10): 5896–901.
11. Cooper SJ, Trinklein ND, Anton ED, Nguyen L, Myers RM (2006) Comprehensive analysis of transcriptional promoter structure and function in 1% of the human genome. Genome Res 16(1): 1–10.
12. Kim TH, Barrera LO, Zheng M, Qu C, Singer MA, et al. (2005) A high-resolution map of active promoters in the human genome. Nature 436(7052): 876–80.
13. Yee SW, Shima JE, Hesselson S, Nguyen L, De Val S, et al. (2009) Identification and Characterization of Proximal Promoter Polymorphisms in the Human Concentrative Nucleoside Transporter 2 (SLC28A2). J Pharmacol Exp Ther 328(3): 699–707.
14. Tahara H, Yee SW, Urban TJ, Hesselson S, Castro RA, et al. (2009) Functional Genetic Variation in the Basal Promoter of the Organic Cation/Carnitine Transporters, OCTN1 (SLC22A4) and OCTN2 (SLC22A5). J Pharmacol Exp Ther. In press.
15. ENCODE Project Consortium, Birney E, Stamatoyannopoulos JA, Dutta A, Guigo´ R, et al. (2007) Identification and analysis of functional elements in 1% of the human genome by the ENCODE pilot project. Nature 447(7146): 799–816.
16. Mills RE, Luttig CT, Larkins CE, Beauchamp A, Tsui C, et al. (2006) An initial map of insertion and deletion (INDEL) variation in the human genome. Genome Res 16(9): 1182–90. Epub 2006 Aug 10.
17. Trinklein ND, Aldred SF, Hartman SJ, Schroeder DI, Otillar RP, et al. (2004) An abundance of bidirectional promoters in the human genome. Genome Res 14: 62–66.
18. Halushka MK, Fan JB, Bentley K, Hsie L, Shen N, et al. (1999) Patterns of single-nucleotide polymorphisms in candidate genes for blood-pressure homeo-stasis. Nat Genet 22(3): 239–47.
19. Cargill M, Altshuler D, Ireland J, Sklar P, Ardlie K, et al. (1999) Characterization of single-nucleotide polymorphisms in coding regions of human genes. Nat Genet 22(3): 231–8.
20. Kimura, Motoo (1983) The neutral theory of molecular evolution. Cambridge: Cambridge University Press. xi p.
21. Sethupathy P, Giang H, Plotkin JB, Hannenhalli S (2008) Genome-wide analysis of natural selection on human cis-elements. PLoS ONE 3(9): e3137. 22. Haygood R, Fedrigo O, Hanson B, Yokoyama KD, Wray GA (2007) Promoter
regions of many neural- and nutrition-related genes have experienced positive selection during human evolution. Nat Genet 39(9): 1140–4.
23. Prades C, Arnould I, Annilo T, Shulenin S, Chen ZQ, et al. (2002) The human ATP binding cassette gene ABCA13, located on chromosome 7p12.3, encodes a 5058 amino acid protein with an extracellular domain encoded in part by a 4.8-kb conserved exon. Cytogenet Genome Res 98(2–3): 160–8.
24. Bleasby K, Castle JC, Roberts CJ, Cheng C, Bailey WJ, et al. (2006) Expression profiles of 50 xenobiotic transporter genes in humans and pre-clinical species: a resource for investigations into drug disposition. Xenobiotica 36(10–11): 963–88. 25. Nishimura M, Naito S (2005) Tissue-specific mRNA expression profiles of human ATP-binding cassette and solute carrier transporter superfamilies. Drug Metab Pharmacokinet 20(6): 452–77.
26. Su AI, Cooke MP, Ching KA, Hakak Y, Walker JR, et al. (2002) Large-scale analysis of the human and mouse transcriptomes. Proc Natl Acad Sci U S A 99(7): 4465–70.
27. Su AI, Wiltshire T, Batalov S, Lapp H, Ching KA, et al. (2004) A gene atlas of the mouse and human protein-encoding transcriptomes. Proc Natl Acad Sci U S A 101(16): 6062–7.
28. Hilgendorf C, Ahlin G, Seithel A, Artursson P, Ungell AL, et al. (2007) Expression of thirty-six drug transporter genes in human intestine, liver, kidney, and organotypic cell lines. Drug Metab Dispos 35(8): 1333–40.
29. Stranger BE, Nica AC, Forrest MS, Dimas A, Bird CP, et al. (2007) Population genomics of human gene expression. Nat Genet 39(10): 1217–24.
30. International HapMap Consortium (2005) A haplotype map of the human genome. Nature 437(7063): 1299–320.
31. Wray GA (2007) The evolutionary significance of cis-regulatory mutations. Nat Rev Genet 8(3): 206–16.
33. Carlson CS, Thomas DJ, Eberle MA, Swanson JE, Livingston RJ, et al. (2005) Genomic regions exhibiting positive selection identified from dense genotype data. Genome Res 15(11): 1553–65.
34. Schloss P, Williams DC (1998) The serotonin transporter: a primary target for antidepressant drugs. J Psychopharmacol 12(2): 115–21.
35. Mrazek DA, Rush AJ, Biernacka JM, O’Kane DJ, Cunningham JM, et al. (2009) SLC6A4 variation and citalopram response. Am J Med Genet B Neuropsychiatr Genet 150B(3): 341–51.
36. Gao B, Hagenbuch B, Kullak-Ublick GA, Benke D, Aguzzi A, et al. (2000) Organic anion-transporting polypeptides mediate transport of opioid peptides across blood-brain barrier. J Pharmacol Exp Ther 294(1): 73–9.
37. Schadt EE, Molony C, Chudin E, Hao K, Yang X, et al. (2008) Mapping the genetic architecture of gene expression in human liver. PLoS Biol 6(5): e107. 38. Rowland M, Tozer TN (1995) Clinical Pharmacokinetics: Concepts and
Applications 3rd Edition. Media: Lippincott Williams and Wilkins. pp 203–219. 39. Cavelier LB, Qiu Y, Bielicki JK, Afzal V, Cheng JF, et al. (2001) Regulation and activity of the human ABCA1 gene in transgenic mice. J Biol Chem 276(21): 18046–51.
40. Hsu SI, Cohen D, Kirschner LS, Lothstein L, Hartstein M, et al. (1990) Structural analysis of the mouse mdr1a (P-glycoprotein) promoter reveals the basis for differential transcript heterogeneity in multidrug-resistant J774.2 cells. Mol Cell Biol 10(7): 3596–606.
41. Smith AD, Sumazin P, Zhang MQ (2007) Tissue-specific regulatory elements in mammalian promoters. Mol Syst Biol 3: 73.
42. Purcell S, Neale B, Todd-Brown K, Thomas L, Ferreira MA, et al. (2007) PLINK: a tool set for whole-genome association and population-based linkage analyses. Am J Hum Genet 81(3): 559–75.
43. Tajima F (1989) Statistical method for testing the neutral mutation hypothesis by DNA polymorphism. Genetics 123(3): 585–95.
44. Fay JC, Wu CI (2000) Hitchhiking under positive Darwinian selection. Genetics 155(3): 1405–13.