www.the-cryosphere.net/10/927/2016/ doi:10.5194/tc-10-927-2016
© Author(s) 2016. CC Attribution 3.0 License.
Reconstructing the annual mass balance of the Echaurren Norte
glacier (Central Andes, 33.5
◦
S) using local and regional
hydroclimatic data
Mariano H. Masiokas1, Duncan A. Christie2,3, Carlos Le Quesne2, Pierre Pitte1, Lucas Ruiz1, Ricardo Villalba1, Brian H. Luckman4, Etienne Berthier5, Samuel U. Nussbaumer6,7, Álvaro González-Reyes8, James McPhee9, and
Gonzalo Barcaza10
1Instituto Argentino de Nivología, Glaciología y Ciencias Ambientales (IANIGLA), CCT- CONICET Mendoza, C. C. 330,
5500 Mendoza, Argentina
2Laboratorio de Dendrocronología y Cambio Global, Instituto de Conservación Biodiversidad y Territorio,
Facultad de Ciencias Forestales y Recursos Naturales, Universidad Austral de Chile, Valdivia, Chile
3Center for Climate and Resilience Research (CR2), Santiago, Chile 4Department of Geography, University of Western Ontario, London, Canada 5LEGOS, CNRS, Université de Toulouse, Toulouse, France
6Department of Geography, University of Zurich, Zurich, Switzerland 7Department of Geosciences, University of Fribourg, Fribourg, Switzerland
8Departamento de Geología, Facultad de Ciencias Físicas y Matemáticas, Universidad de Chile, Santiago, Chile 9Departamento de Ingeniería Civil, Facultad de Ciencias Físicas y Matemáticas, Universidad de Chile, Santiago, Chile 10Dirección General de Aguas (DGA), Santiago, Chile
Correspondence to:Mariano H. Masiokas ([email protected])
Received: 13 August 2015 – Published in The Cryosphere Discuss.: 17 September 2015 Revised: 27 March 2016 – Accepted: 5 April 2016 – Published: 26 April 2016
Abstract.Despite the great number and variety of glaciers in southern South America, in situ glacier mass-balance records are extremely scarce and glacier–climate relationships are still poorly understood in this region. Here we use the longest (>35 years) and most complete in situ mass-balance record, available for the Echaurren Norte glacier (ECH) in the An-des at∼33.5◦S, to develop a minimal glacier surface
mass-balance model that relies on nearby monthly precipitation and air temperature data as forcing. This basic model is able to explain 78 % of the variance in the annual glacier mass-balance record over the 1978–2013 calibration period. An attribution assessment identified precipitation variability as the dominant forcing modulating annual mass balances at ECH, with temperature variations likely playing a secondary role. A regionally averaged series of mean annual streamflow records from both sides of the Andes between∼30 and 37◦S
is then used to estimate, through simple linear regression, this glacier’s annual mass-balance variations since 1909. The
Figure 1.Panel(a)depicts a map of the Central Andes of Chile and Argentina showing the location of the Echaurren Norte glacier (ECH), Piloto Este glacier (PIL) and several smaller glaciers with mass-balance records in the Pascua Lama (PAS) and Cordillera de Colanguil (COL) areas. The locations of the snowpack and streamflow stations discussed in the text are also shown (Tables 1 and 2). In panel(b)a general view of the El Yeso area, showing the location of ECH, El Yeso Dam and the associated meteorological station is given. Laguna Negra is a natural lake that receives the meltwater from ECH. Base image acquired on 5 January 2014 and downloaded from Google Earth. Panel(c)provides a closer oblique view of Echaurren Norte as observed in 2014 and in the early 1970s (outlined in red and based on Peña and Narbona, 1978). Note that the glacier has remained in roughly the same position but has thinned markedly over the last decades. Panel(d)shows seasonal variations in temperature and precipitation at the lower reaches of ECH (3700 m a.s.l.) extrapolated from the El Yeso meteorological station (see Sect. 2.2 for details). Note that the bulk of precipitation occurs during the coldest months of the year (December–March precipitation only accounts for∼5 % of the mean annual totals).
1 Introduction
The extratropical Andes, between ∼23 and 55◦S, contain
a large number and variety of glaciers ranging from small glacierets at elevations of over 6000 m in the high, arid An-des of northern Chile and Argentina, to large outlet glaciers that reach the sea in the humid southwestern portion of Patag-onia and Tierra del Fuego. Altogether, these ice masses con-centrate the largest glacierized area in the Southern Hemi-sphere outside Antarctica and are highly valued as sources of freshwater, as indicators of climatic change, as tourist at-tractions and as environmental and cultural icons in differ-ent sectors of the Andes. As reported for other mountainous areas of the globe, glaciers in southern South America dis-play a widespread retreating pattern that has usually been attributed to warmer, and sometimes drier, climatic condi-tions in this region (Villalba et al., 2003; Rignot et al., 2003;
network of direct glacier mass-balance data currently avail-able in southern South America. Although not optimal in terms of spatial coverage, arguably the single most impor-tant limitation of this network is the short period of time cov-ered by consistent, reliable records. Of the two longest mass-balance series mentioned above (Echaurren Norte and Piloto Este glaciers in the Central Andes, see Table 1.1 in WGMS, 2013), only the series from Echaurren Norte (ECH) in Chile (Fig. 1a–c) provides a complete record spanning more than 35 years. In fact, this series constitutes the longest direct glacier mass-balance record in the Southern Hemisphere (see Escobar et al., 1995a, b; DGA, 2010 and WGMS, 2013) and is thus a “reference” glacier in the WGMS global assess-ments. The mass-balance record from the Piloto Este glacier (PIL; located ca. 100 km to the north in Argentina; Fig. 1a) covers the 1979–2002 period and contains several data gaps that have been interpolated using various techniques (Leiva et al., 2007).
Many studies dealing with recent climate and glacier changes in southern South America have pointed out the shortness, poor quality or absence of climatic records at high-elevation sites or in the proximity of glaciers in the Andes (Villalba et al., 2003; Rivera et al., 2005; Masiokas et al., 2008; Rasmussen et al., 2007; Falvey and Garreaud, 2009; Pellicciotti et al., 2014; Vuillle et al., 2015). Given the lack of suitable data, many climatic assessments have used records from distant, low elevation weather stations and/or gridded data sets to estimate conditions and recent climate variabil-ity within the Andean range. It is interesting to note, how-ever, that the amount of hydroclimatic information (in partic-ular from solid and liquid precipitation, and hydrologic vari-ables) is comparatively better for those portions of the south-ern Andes that support large populated centers and where the water provided by the mountains is vital for human con-sumption, agriculture, industries and/or hydropower gener-ation. In these areas, mainly between ca. 29 and 42◦S, lo-cal and national water resource agencies have monitored a well-maintained network of hydrologic and meteorological stations for several decades (see e.g., Masiokas et al., 2006, 2010). The data from the stations in this region are slowly becoming publicly available and are substantially better in terms of quantity and quality than those for the less popu-lated, more inaccessible areas in southern Patagonia or in the Desert Andes of northern Chile and Argentina.
The Central Andes of Chile and Argentina between
∼31 and 35◦S (see Lliboutry, 1998) have a mean elevation
of about 3500 m, with several peaks reaching over 6000 m (Fig. 1a). The climate of this region is characterized by a Mediterranean regime with a marked precipitation peak dur-ing the cold months (April to October) and little precipita-tion during the warm summer season (November to March; Fig. 1d). Almost all of the moisture comes from westerly Pa-cific frontal systems, precipitating as rainfall in the Chilean lowlands and as snow in the Andes to the east (Miller, 1976; Aceituno, 1988; Garreaud, 2009). The snow accumulated in
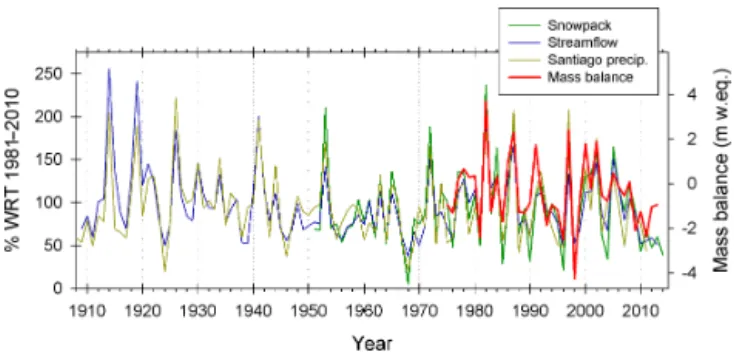
Figure 2.Comparison between the annual mass-balance series of
ECH and regional records of maximum winter snow accumulation and mean annual river discharges in the Andes between 30 and 37◦S (see Fig. 1). The regional records are expressed as percent-ages with respect to the 1981–2010 mean values. Variations in an-nual total precipitation at Santiago are also included to highlight the strong common hydroclimatic signal in this region.
the mountains during winter remains frozen until the onset of the melt season (usually October–November), producing a unimodal snowmelt-dominated regime for all rivers originat-ing on either side of the Andes at these latitudes (Masiokas et al., 2006; Cara et al., 2016). This relatively simple configura-tion entails some potential benefits for the study and under-standing of the hydroclimatic and glaciological processes in this region: first, the strong covariability between total rain-fall amounts measured in central Chile and winter snow ac-cumulation and river discharges recorded in the Andes (see Fig. 2) allows for the use of a relatively limited number of sta-tion records to capture the main regional hydroclimatic pat-terns. The strong common signal among these variables also offers the possibility of inferring or reconstructing selected instrumental data (e.g., winter snow accumulation, which begins in 1951) using data from other well-correlated vari-ables with a longer temporal coverage (e.g., Andean stream-flow records which are available since 1909). Masiokas et al. (2012) used these relationships to extend Andean snow-pack variations using central Chilean rainfall records and precipitation-sensitive tree-ring width series.
In contrast to the well-known similarities between precipi-tation (solid and liquid) and surface runoff, the spatial and temporal patterns of high-elevation temperature records in the Central Andes of Chile and Argentina are still poorly un-derstood. Falvey and Garreaud (2009) presented a detailed assessment of temperature trends over the 1979–2006 pe-riod along the western margin of subtropical South Amer-ica, reporting a notable contrast between surface cooling (−0.2◦C decade−1) in coastal stations and a warming trend
of ca.+0.25◦C decade−1in the Andes only 100–200 km
(Falvey and Garreaud, 2009). This lack of high-elevation surface-temperature data also restricted the recent assess-ments of Vuille et al. (2015), who focused their elevation-dependent temperature trend analyses on the region north of 18◦S because data were too sparse farther south.
The station El Yeso (33◦40′36′′S, 70◦05′19′′W) is lo-cated only 10 km south of ECH (Fig. 1b). Mean daily and monthly temperature and total precipitation measurements from this station have been available since 1962 but con-tain several months with missing data prior to 1977 (tem-perature) and 1975 (precipitation). Since 1977, both series are practically complete and updated on a regular basis. To our knowledge, in the entire extratropical Andes there is no other operational meteorological station with such a long and complete record of temperature and precipitation variations less than a few kilometers from a glacier, which moreover contains the longest ongoing mass-balance monitoring pro-gram in the Southern Hemisphere. This rare combination of relatively long, complete climate records near a well-studied glacier site clearly highlights the importance of this unique location for varied glaciological and climatological investi-gations in the southern Andes.
In this contribution we use seasonal mass-balance records from ECH plus locally and regionally averaged monthly hy-droclimatic data to model and reconstruct annual glacier mass-balance changes over the past 105 years. Since only the glacier-wide seasonal and annual mass-balance components are available for ECH, one of the main objectives of the study was to explore the suitability of simple mass-balance models that require a minimum amount of input data (Marzeion et al. (2012); see also Kaser et al., 2010). Although this simplis-tic approach provides limited insight into the intricate phys-ical processes involved in this glacier’s intra-annual mass-balance variations, it may, nonetheless, offer a useful starting point to address some basic (yet still poorly known) ques-tions regarding the glacier’s sensitivity to climate variaques-tions. We did not consider a data-intensive approach to measure and model the complex daily energy and mass-balance vari-ations of this glacier (e.g., Pellicciotti et al., 2014), because of the lack of the high-resolution, in situ meteorological and glaciological measurements usually required in these types of analyses. Another primary objective was to use the avail-able, well-correlated hydrological records from this region (Fig. 2) to extend the ECH annual mass-balance record and evaluate the fluctuations of mass balance over a much longer period than that covered by regular glaciological measure-ments. Comparisons with other shorter mass-balance series and with a record of glacier advances in this region sug-gest the resulting time series contains a discernible regional footprint. Overall, we believe the findings discussed below constitute a substantial improvement in the understanding of the main patterns and forcings of the glacier mass-balance changes in this region and provide a useful background for more detailed glacio-climatic assessments and modeling ex-ercises in this portion of the Andes.
2 Data and methods
2.1 Glacier mass-balance data
The Echaurren Norte glacier (33◦33′S, 70◦08′W) is located within a southwestern-oriented cirque∼50 km southeast of
Santiago de Chile, in the headwaters of the Maipo River basin (Fig. 1a–c). ECH provides water to Laguna Negra, a natural lake that together with the nearby El Yeso artificial lake constitute crucial water reservoirs for extensive irrigated lands and for the metropolitan Santiago area in central Chile. Mass-balance measurements started at this easily accessi-ble glacier in the austral spring of 1975 under the auspices of Dirección General de Aguas (DGA), the institution in charge of monitoring and managing water resources in Chile. Sum-mer and winter mass-balance data at ECH have been regu-larly measured until the present by DGA officials and have been reported in sporadic internal documents and scientific publications (Peña and Narbona, 1978; Peña et al., 1984; Es-cobar et al., 1995a, b, 1997; DGA, 2010). These records have also been reported to the WGMS, from which we obtained the 1975–2012 data used in this manuscript (annual mass-balance data extend to 2013; see WGMS (2013) and http: //www.wgms.ch). The glacier has thinned in the last decades and presently consists of small remnants of both clean and debris-covered ice (Fig. 1c). Despite this evident ice-mass loss, the elevation range of the glacier has not changed much since measurements started in the mid-1970s. According to Peña and Narbona (1978) and Escobar et al. (1995a, b), in the first years of the mass-balance program the glacier covered an area of 0.4 km2 distributed over a short elevation range
between ca. 3650 and 3880 m a.s.l. (Fig. 1c). Over the time period covered by the mass-balance records, no adjustment has been made to incorporate the changes in surface area of the glacier, thus the reported values are considered here as reference-surface mass-balance estimates (i.e., the mass bal-ance that would have been observed if the glacier topogra-phy had not changed over the study period; see Cogley et al., 2011).
Mass-balance data from PIL from 1979 to 2002 and shorter time series from small glaciers and glacierets fur-ther north in this region are also available from the WGMS database (Leiva et al. (2007), Rabatel et al. (2011), WGMS (2013); see Fig. 1a and Table 1). Here we compare the cumulative annual mass-balance records of these glaciers as independent validation measures of the main patterns and temporal trends observed in the measured and modeled mass-balance series from ECH.
2.2 Minimal glacier mass-balance model
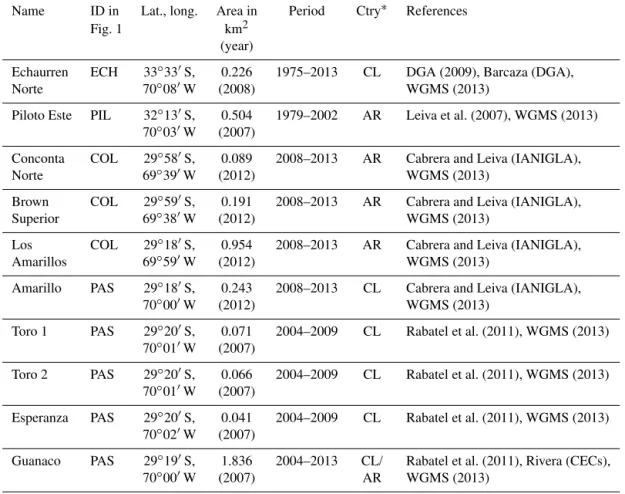
Table 1.Basic information of the glacier mass-balance series used in this study.
Name ID in Lat., long. Area in Period Ctry∗ References Fig. 1 km2
(year)
Echaurren ECH 33◦33′S, 0.226 1975–2013 CL DGA (2009), Barcaza (DGA), Norte 70◦08′W (2008) WGMS (2013)
Piloto Este PIL 32◦13′S, 0.504 1979–2002 AR Leiva et al. (2007), WGMS (2013) 70◦03′W (2007)
Conconta COL 29◦58′S, 0.089 2008–2013 AR Cabrera and Leiva (IANIGLA), Norte 69◦39′W (2012) WGMS (2013)
Brown COL 29◦59′S, 0.191 2008–2013 AR Cabrera and Leiva (IANIGLA), Superior 69◦38′W (2012) WGMS (2013)
Los COL 29◦18′S, 0.954 2008–2013 AR Cabrera and Leiva (IANIGLA), Amarillos 69◦59′W (2012) WGMS (2013)
Amarillo PAS 29◦18′S, 0.243 2008–2013 CL Cabrera and Leiva (IANIGLA), 70◦00′W (2012) WGMS (2013)
Toro 1 PAS 29◦20′S, 0.071 2004–2009 CL Rabatel et al. (2011), WGMS (2013) 70◦01′W (2007)
Toro 2 PAS 29◦20′S, 0.066 2004–2009 CL Rabatel et al. (2011), WGMS (2013) 70◦01′W (2007)
Esperanza PAS 29◦20′S, 0.041 2004–2009 CL Rabatel et al. (2011), WGMS (2013) 70◦02′W (2007)
Guanaco PAS 29◦19′S, 1.836 2004–2013 CL/ Rabatel et al. (2011), Rivera (CECs), 70◦00′W (2007) AR WGMS (2013)
∗country: CL: Chile; AR: Argentina.
and precipitation variability for the ECH records. In their publication, Marzeion et al. (2012) used gridded precipita-tion and temperature data to calibrate individual models for 15 glaciers with existing mass-balance measurements in the greater Alpine region. The climate data used here come from El Yeso, a permanent automatic weather station maintained by DGA and located ca. 10 km to the south and 1200 m lower than ECH’s snout (Fig. 1b). The data are freely avail-able at the DGA website (http://www.dga.cl) and contain practically complete monthly temperature and precipitation records since 1977 (only four missing months were filled us-ing their long-term means). The mass-balance model can be defined as follows:
MB=
12 X
i=1
(αPi−µ (max(0, Ti−Tmelt))) , (1) where MB represents the modeled annual specific mass bal-ance of the glacier, Pi are monthly total precipitation
val-ues at the El Yeso station andαis a scaling parameter intro-duced to compensate for the precipitation gradient between the elevation of this station (rounded here to 2500 m) and the front of ECH (fixed at 3700 m in this analysis). We do not differentiate solid vs. liquid precipitation, because at this
glacier (and in other high-elevation areas in this portion of the Andes) the bulk of precipitation occurs during the winter months and the fraction of liquid precipitation is usually min-imal compared to the large proportion that falls as snow (see Fig. 1d). The use of total precipitation values also avoids the additional complexity and uncertainties involved in differen-tiating solid from liquid precipitation at this glacier, which is distributed over a very small altitudinal range (see also Fig. 1c).Tirepresents mean monthly temperatures at El Yeso
extrapolated to the elevation of the glacier front using a con-stant lapse rate of−0.065◦C/100 m andTmeltis the monthly
(Eq. 1) was calibrated with the remaining values. At each step the parametersαandµwere first optimized to minimize the root mean squared error (RMSE; Weisberg, 1985) of the modeled values and then used to estimate the mass-balance data omitted that year. This resulted in 36 predicted values which were compared to the actual annual mass-balance ob-servations to compute validation statistics of model accu-racy and error. The exercise showed that the model param-eters are relatively time stable:αranged between 3.9 and 4.1 (mean value used here=3.9), whereas µ varied between 89.0 and 91.0 mm K−1 (mean value used=90.1 mm K−1). The mean estimated value ofαindicates that accumulation at the glacier is normally about four times larger than the an-nual precipitation recorded at El Yeso. The mean estimated value forµis also reasonable and within the range of values reported by Marzeion et al. (2012) for the 15 glaciers with direct measurements in the European Alps (76–156 mm K−1, see their Table 1). Finally, for the sake of simplicity, we pre-scribedTmelt=0◦C as suggested in Marzeion et al. (2012).
2.3 Glacier mass-balance reconstruction
In addition to modeling the interannual mass-balance vari-ations of ECH using the temperature and precipitation data from El Yeso, we also used regionally representative hy-droclimatic indicators to extend the observed glacier mass-balance record prior to 1975. The use of these indicators (re-gionally averaged series of winter snow accumulation and mean annual river discharges; see Masiokas et al., 2006) was supported by visual comparisons and correlation analyses which showed strong, statistically significant positive associ-ations not only with the winter record at ECH, but also with the annual mass-balance series of this glacier (Table 2 and Fig. 2). The correlation was also positive but weaker between the summer component at ECH and the regional snowpack and streamflow series.
The regionally averaged record of winter snow accumula-tion is based on eight selected staaccumula-tions located in the Chilean and Argentinean Andes between 30 and 37◦S (Fig. 1a and Table 3). The data set has been updated from the one used by Masiokas et al. (2012) and contains the longest and most complete snowpack records in this region. Prior to comput-ing the regional average, the individual series were expressed as percentages from their 1981 to 2010 climatology mean values. A similar approach was used to develop a regional record of mean annual (July–June) streamflow variations. This series was calculated using monthly data from 11 gaug-ing stations with the longest and most complete records in this portion of the Andes (Fig. 1a and Table 3). The result-ing snowpack and streamflow composite records cover the 1951–2014 and 1909–2013 periods, respectively (Fig. 2).
The glacier mass-balance reconstructions are based on simple linear regression models where the predictand is the 1975–2013 ECH annual mass-balance series and the predic-tors are, alternatively, the regional 1951–2014 snowpack and
1909–2013 streamflow records depicted in Fig. 2. Given the relative shortness of the common period between the pre-dictor and predictand series (39 years), the reconstruction models were also developed using a leave-one-out cross-validation procedure (Michaelsen, 1987). Here, linear re-gression models for each year were successively calibrated on the remaining 38 observations and then used to estimate the predictand’s value for the year omitted at each step. A simple linear regression model based on the full calibra-tion data set (1975–2013) was finally used to reconstruct the mass-balance values over the complete period covered by the regional time series. The goodness of fit between ob-served and predicted mass-balance values was tested based on the proportion of variance explained by the regression models and the normality, linear trend, and first- and higher-order autocorrelation of the regression residuals. The uncer-tainties in each reconstructed mass-balance value in year t (εreco(t )) were calculated integrating the standard error of
the regression estimate (SEregr) and the standard error of
the mean annual streamflow values used as predictors in the model (SEmean(t )). This latter error is derived from the
stan-dard deviation of the regional record (σ) and increases as the number of contributing streamflow series (n) decreases back in time (see Table 3).
εreco(t )= q
SE2regr+SE2mean(t ) (2)
SEmean(t )=
σ √n
(t )
(3)
An independent verification of the reconstructed mass-balance records was undertaken by comparing the cumula-tive patterns of these series with the cumulacumula-tive mass bal-ances reported for the Piloto Este glacier and for other glaciers with shorter mass-balance series available in this portion of the Andes (Fig. 1a and Table 1). We also com-pared the ECH cumulative series (observed and predicted) with a regional record of glacier advances identified during the 20th century in the Andes between 29 and 35◦S. The latter record was compiled in a recent review of glacier fluc-tuations in extratropical South America and is based on di-rect observations, reports from documentary evidence, and analyses of aerial photographs and satellite images from this region (see Masiokas et al., 2009). The uncertainty of the cu-mulative series modeled for ECH (ε(T )) were calculated by
propagating (adding) the individual errors estimated for each reconstructed value.
ε(T )= v u u t
t=T X
t=1
Table 2.Correlation analyses between the ECH mass-balance series and regional hydroclimatic records. The number of observations used in each correlation test is indicated in parenthesis.
Winter ECH Annual mass Regional Regional balance ECH snowpack streamflow
Summer ECH 0.245 (38) 0.648∗∗(38) 0.447∗∗(38) 0.395∗(38) Winter ECH 0.897∗∗(38) 0.796∗∗(38) 0.834∗∗(38) Annual mass-balance ECH 0.829∗∗(39) 0.826∗∗(39) Regional snowpack 0.916∗∗(63)
Note:∗(∗∗) Pearson correlation coefficient is significant at the 95 % (99 %) confidence level.
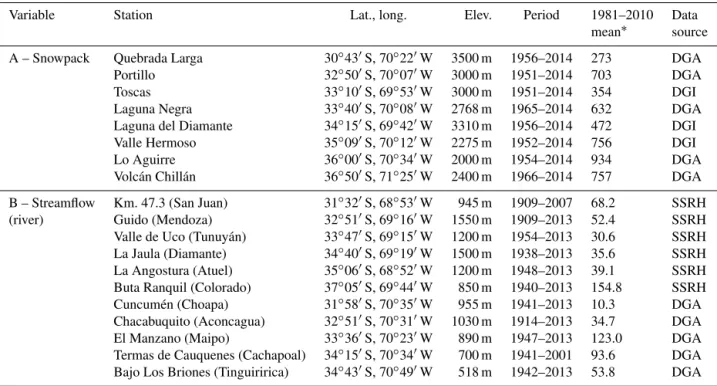
Table 3.Stations used to develop regionally averaged series of mean annual river discharges and winter-maximum snow accumulation for
the Andes between 30 and 37◦S. Mean annual streamflow values refer to a July–June water year.
Variable Station Lat., long. Elev. Period 1981–2010 Data mean∗ source
A – Snowpack Quebrada Larga 30◦43′S, 70◦22′W 3500 m 1956–2014 273 DGA Portillo 32◦50′S, 70◦07′W 3000 m 1951–2014 703 DGA Toscas 33◦10′S, 69◦53′W 3000 m 1951–2014 354 DGI Laguna Negra 33◦40′S, 70◦08′W 2768 m 1965–2014 632 DGA Laguna del Diamante 34◦15′S, 69◦42′W 3310 m 1956–2014 472 DGI Valle Hermoso 35◦09′S, 70◦12′W 2275 m 1952–2014 756 DGI Lo Aguirre 36◦00′S, 70◦34′W 2000 m 1954–2014 934 DGA Volcán Chillán 36◦50′S, 71◦25′W 2400 m 1966–2014 757 DGA
B – Streamflow Km. 47.3 (San Juan) 31◦32′S, 68◦53′W 945 m 1909–2007 68.2 SSRH (river) Guido (Mendoza) 32◦51′S, 69◦16′W 1550 m 1909–2013 52.4 SSRH Valle de Uco (Tunuyán) 33◦47′S, 69◦15′W 1200 m 1954–2013 30.6 SSRH La Jaula (Diamante) 34◦40′S, 69◦19′W 1500 m 1938–2013 35.6 SSRH La Angostura (Atuel) 35◦06′S, 68◦52′W 1200 m 1948–2013 39.1 SSRH Buta Ranquil (Colorado) 37◦05′S, 69◦44′W 850 m 1940–2013 154.8 SSRH Cuncumén (Choapa) 31◦58′S, 70◦35′W 955 m 1941–2013 10.3 DGA Chacabuquito (Aconcagua) 32◦51′S, 70◦31′W 1030 m 1914–2013 34.7 DGA El Manzano (Maipo) 33◦36′S, 70◦23′W 890 m 1947–2013 123.0 DGA Termas de Cauquenes (Cachapoal) 34◦15′S, 70◦34′W 700 m 1941–2001 93.6 DGA Bajo Los Briones (Tinguiririca) 34◦43′S, 70◦49′W 518 m 1942–2013 53.8 DGA
Note:∗The 1981–2010 climatology values for each station are expressed as mm w. eq. for snowpack and as m3s−1for streamflow. In the case of the San Juan and
Cachapoal rivers, the mean values used correspond to the 1981–2007 and 1981–2001 periods, respectively. Data sources: (DGA) Dirección General de Aguas, Chile; (DGI) Departamento General de Irrigación, Mendoza, Argentina; (SSRH) Subsecretaría de Recursos Hídricos, Argentina. See Masiokas et al. (2013) for further details.
3 Results
3.1 Minimal glacier mass-balance model
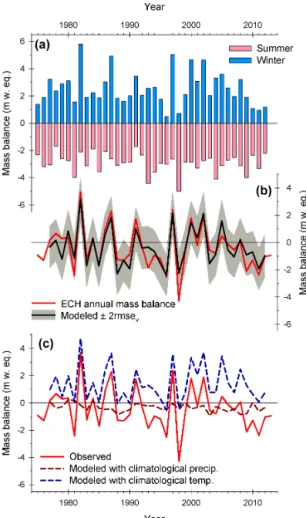
The 1975–2012 winter and summer values observed at ECH are depicted in Fig. 3a. The winter series shows a long-term mean of 2.54 m w.eq. and a larger range of variability (SD 1.24 m w.eq.) than the sum-mer series, which fluctuates around a long-term mean of
−2.93 m w.eq. (SD 0.72 m w.eq.). The observed and
mod-eled annual mass-balance series are remarkably similar (Fig. 3b) and show a strong positive correlation (r=0.883, rmse=0.77 m w.eq.), indicating that 78 % of the variance
in the ECH record can be accounted for by the mini-mal model presented in Eq. (1). Both series show
sim-ilar, slightly negative linear trends and negative means (−0.35 and−0.34 m w.eq. for the observed and modeled
se-ries, respectively) over the 1977–2012 interval.
3.2 Attribution assessments
Figure 3.Panel(a)shows winter and summer values observed at ECH between 1975 and 2012. Panel(b)shows annual mass-balance series observed at ECH and modeled using El Yeso climate data (red and black lines). The estimated uncertainties of the modeled val-ues (±2 RMSE) are shown with gray shading. In panel(c)Annual mass balances observed at ECH (red line) are compared to mass bal-ances modeled using full variability in temperature but climatologi-cal monthly precipitation (dark-red dashed line), and full variability in precipitation but climatological monthly temperatures (dark-blue dashed line). Note the greater similarities between the observed se-ries and the precipitation-based mass-balance estimates.
dashed line in Fig. 3c) show a strong positive correlation (r=0.882) and remarkable similarities with the ECH annual mass-balance series (red line). In contrast, the temperature-driven estimates (dark-red dashed line) show a poorer cor-relation with the ECH record (r=0.240) and a substantially lower inter-annual variability, which only barely follows the variations in the annual mass-balance series. To evaluate if the influence of temperature had been underestimated in the full model (where the parametersα andµ can compensate for each other), both parameters were also optimized individ-ually using a leave-one-out approach and considering each term of Eq. (1) as separate models. In this case the param-eters showed almost exactly the same mean values (3.8 for
Figure 4.Panel(a)shows a comparison between the annual
mass-balance record observed at ECH (red line) and the reconstructed series derived from regionally averaged streamflow data (blue line). The estimated uncertainty of the reconstructed series (±2εreco) is
indicated by gray shading. Panel(b)shows the cumulative record of the observed and reconstructed ECH mass-balance series (dark-red and dark-blue lines). The initial value of the observed ECH cu-mulative record was modified to match the corresponding value in the reconstructed series. The aggregated errors in this series (see Sect. 2.3) are also shown by gray shading. Panel(c)depicts glacier advances identified in the central Andes of Chile and Argentina dur-ing the past 100 years (see text for details). Events are grouped into 10-year intervals.
αand 90.3 mm K−1for µ) as those obtained using the full model (3.9 and 90.1 mm K−1 for α and µ, see Sect. 2.2), suggesting that the poor performance of temperature is not due to the interaction of the parameters in the mass-balance model.
3.3 Annual mass-balance reconstruction 1909–2013
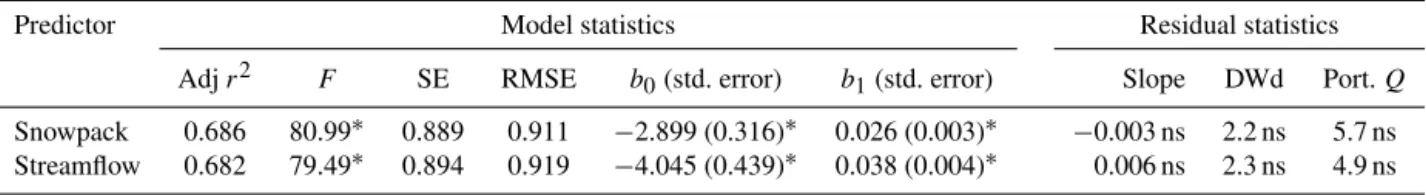
Table 4.Summary statistics for the simple linear regression models used to estimate ECH annual mass balances using regional snowpack and streamflow records.
Predictor Model statistics Residual statistics
Adjr2 F SE RMSE b0(std. error) b1(std. error) Slope DWd Port.Q
Snowpack 0.686 80.99∗ 0.889 0.911 −2.899 (0.316)∗ 0.026 (0.003)∗ −0.003 ns 2.2 ns 5.7 ns Streamflow 0.682 79.49∗ 0.894 0.919 −4.045 (0.439)∗ 0.038 (0.004)∗ 0.006 ns 2.3 ns 4.9 ns
Notes: adjr2=adjusted coefficient of determination used to estimate the proportion of variance explained by regression;F=Fratio for ANOVA test of the null hypothesis that all model coefficients are 0; SE=standard error of the estimate; RMSE=root mean squared error of regression.b0=constant of regression model; b1=regression coefficient; DWd=Durbin–Watson d statistic used to test for first-order autocorrelation of the regression residuals; Port.Q=PortmanteauQstatistic to test if high-order autocorrelation in the regression residuals is different from 0; ns=results are not statistically significant at the 95 % confidence level;
∗=statistically significant at the 99 % confidence level.
of the variance in the annual mass-balance series over the 1975–2013 period and shows no apparent sign of model misspecification, offering the possibility of reliably extend-ing the information on glacier mass-balance changes back to 1909. This reconstructed mass-balance record is almost three times longer than the mass-balance record currently available at ECH and shows a strong year-to-year variability embedded within several periods of overall positive or nega-tive conditions (Fig. 4a). In particular, posinega-tive mass-balance conditions were reconstructed between 1914 and 1941, in the 1980s and in the late 1990s to the early 21st century. In contrast, the clearest sustained period of negative mass bal-ances occurred between the 1940s and the 1970s.
The cumulative values of the streamflow-based mass-balance reconstruction show very good correspondence with the observed cumulative series and an overall negative trend between 1909 and 2013 (Fig. 4b). Within this century-long negative trend, a prominent period of extended positive mass balances can be observed between the mid-1910s and the early 1940s. After 1941 and during the following four decades, the cumulative mass-balance series shows an im-pressive decline that is interrupted in 1980 by a ∼10-year
long period of sustained positive conditions (Fig. 4b). Since the early 1990s and until 2013 the cumulative mass-balance series resumes the negative tendency, only interrupted by a short-lived period of positive conditions in the first years of the 21st century. It is important to note, however, that as-cribing absolute values to this reconstructed cumulative se-ries is complicated and should be used with caution due to the large uncertainties involved and the fact that the model is calibrated using reference-surface mass-balance estimates (Cogley at al., 2011). Between 1975 and 2013 the lower el-evation of the glacier did not change much (see Fig. 1c) and therefore the reference-surface and the conventional mass-balance estimates are probably roughly equivalent. However, for earlier decades and without historical information on the glacier area and frontal position, it is difficult to estimate the impacts of changing glacier geometry on the actual mass bal-ance of this glacier.
Figure 5.Comparison between the cumulative patterns in the
ob-served and reconstructed records from ECH and other glaciers with available direct mass-balance data in the Dry Andes of Chile and Argentina (Fig. 1 and Table 1).
3.4 Comparison with other glacier records
Examination of the main patterns in the reconstructed cumu-lative mass-balance series shows a good correspondence with a regional record of glacier advances identified in the Cen-tral Andes over the past 100 years (Masiokas et al., 2009; Fig. 4c). In most cases, the glacier advances are concentrated during or soon after the periods of sustained positive mass balances reconstructed or observed at ECH. This situation is particularly clear in the 1980s and 1990s, where a large number of glacier advances were identified during and/or im-mediately after the peak in mass balances that culminated in 1989 (Fig. 4b and c). Glacier advances were also identi-fied in the 1930s, 1940s and 1950s, likely associated with the extended period of positive mass balances that culminated in the early 1940s. A few well-documented advances identified in this region between 2003 and 2007 may be associated with the minor peak in cumulated mass balances observed at the turn of the 21st century (Fig. 4b and c).
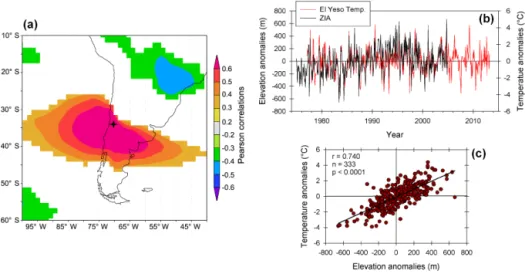
re-Figure 6.Panel(a)depicts a map showing the correlations (p <0.1) between mean warm season (October–March) temperatures at the El Yeso station and gridded warm season ERA-Interim mean temperatures for the 700 mb geopotential height level over the 1979–2012 period. The black star marks the location of the El Yeso station. The diagram in (b)shows variations of mean monthly temperatures at El Yeso (1977–2013) and the mean monthly elevation of the 0◦C isotherm (ZIA) derived from radiosonde data from the Quintero coastal station (1975–2004). To facilitate the comparison, both series are expressed as anomalies from their mean seasonal cycles. Panel(c)shows a scatterplot of the El Yeso temperature and ZIA anomalies depicted in(b). Note the positive, highly significant correlation between these two variables. ZIA data were provided by J. Carrasco from Dirección Meteorológica de Chile.
constructed time series (Fig. 5). The cumulative tendency of PIL appears to be smoother than the ECH series, but still shows slightly positive or near-equilibrium conditions be-tween the late 1970s and the mid-1980s followed by a sharp decline until the turn of the 21st century. The cumulative se-ries from other glaciers located further north in the Pascua Lama and Cordillera de Colanguil areas (Fig. 1a and Table 1) only cover the last decade or so of the ECH record. However, in all cases their overall tendency is similar and markedly negative, reflecting the sustained unfavorable conditions that these ice masses have endured in recent years. It is interest-ing to note that the smaller glaciers (Table 1 and Fig. 5) are the ones consistently showing the steepest negative cumula-tive trends whereas the largest glacier (Guanaco glacier, with ca. 1.8 km2in 2007) shows the least negative trend.
4 Discussion and conclusions
Compared to other mountainous glacierized areas, the extra-tropical Andes in southern South America contain one of the least complete networks of in situ glacier mass-balance and high-elevation climate records in the world. This scarcity of basic information in this extensive and glaciologically di-verse region has been highlighted on many occasions and several recent studies have attempted to overcome this lim-itation by estimating mass-balance changes through remote sensing and/or modeling approaches of varied complexity and spatial coverage (e.g., Casassa et al., 2006; Radi´c et al., 2013; Lenaerts et al., 2014; Pellicciotti et al., 2014; Schae-fer et al., 2013, 2015). With such limited data availability,
the few existing glacier mass-balance records become partic-ularly relevant as they provide crucial information and val-idation measures for many glaciological, climatological and hydrological analyses.
glaciers in this high-arid portion of the Andes (McDonell et al., 2013; Pellicciotti et al., 2014).
To test the reliability of the temperature records used to model the glacier mass-balance series, we correlated the El Yeso monthly temperature record with ERA-Interim gridded reanalysis temperatures for the 700 mb geopotential height (roughly 3000 m a.s.l.) and also with a 0◦C isotherm ele-vation series available from central Chile (Fig. 6). The El Yeso temperature record shows strong positive correlations with ERA-Interim gridded data over an extensive region that includes central Argentina, central Chile and an adjacent area in the Pacific Ocean (Fig. 6a). The El Yeso tempera-ture record also shows clear similarities and a positive sig-nificant correlation with the 0◦C isotherm elevation series over the 1977–2004 interval (Fig. 6b and c). The indepen-dence of these three data sets indicates that the El Yeso mean monthly temperature data are reliable and that the poor per-formance of this variable in the mass-balance modeling exer-cise is not related to the overall quality of the temperature se-ries. Although this issue is beyond the main purposes of this study, more complex modeling approaches are also needed to evaluate whether climate data at higher temporal resolu-tion (instead of monthly values as used here) are capable of capturing a larger percentage of the mass-balance variations observed at ECH.
Annual mass-balance variations observed at ECH can also be reproduced or estimated accurately through simple linear regression using regionally averaged winter snowpack or an-nual streamflow records as predictors (Fig. 4a). This is due to the existence of a strong common hydroclimatic signal in this region, which results in very similar interannual varia-tions in winter snow accumulation, mean annual river dis-charges and glacier mass-balance changes such as those mea-sured at ECH (Fig. 2). This simple approach allows extend-ing the information on glacier mass-balance changes sev-eral decades prior to the beginning of in situ measurements (back to 1909) and offers the opportunity of putting the exist-ing glacier record in a longer-term perspective. Many of the extreme values reconstructed in this study have been doc-umented in historical reports and recent analyses of instru-mental hydroclimatic data. For example, the extreme posi-tive values of 1914 and 1919 coincide with extremely wet winters in central Chile (see e.g., Fig. 2; Taulis, 1934; Ma-siokas et al., 2012), whereas the period with above-average balances centered in the 1980s or the negative conditions be-tween the 1940s and 1970s have been identified, respectively, as the snowiest and driest intervals during the instrumental era in this region (Masiokas et al., 2010). Examination of the main intra- to multi-decadal patterns in this extended series also indicates that the sustained negative mass-balance con-ditions reported for ECH in recent years are not unusual and were probably surpassed by more negative and longer peri-ods between the 1940s and 1970s (Fig. 4a). However, the im-pact of a few consecutive years of negative mass balances are more serious today than several decades ago because of the
low volume of ice remaining and the poorer overall “health” of the glacier.
The cumulative series of the reconstructed mass-balance values (Fig. 4b) shows a steep negative trend that is consis-tent with the recent loss of ice reported for other glaciers in this region (Fig. 5; Escobar et al., 1995a) Rivera et al., 2000; Masiokas et al., 2009). This negative trend has been temporarily interrupted by periods of sustained positive mass balances that, in most cases, precede or coincide with recent glacier readvances identified at these latitudes in the Andes (Masiokas et al., 2009; Fig. 4c). The clearest example is the relationship between the peak in cumulative mass balances in the mid-to-late 1980s and the 11 documented glacier ad-vances in the following decade. It is also interesting to note that several of the glacier events that occurred after periods of positive mass balances have been identified as surges (Hel-bling, 1935; Espizua, 1986; Masiokas et al., 2009; Pitte et al., 2016). The well-known surges of Grande del Nevado glacier (in the Plomo massif area) in 1933–1934, 1984–1985 and 2004–2007 are particularly noteworthy as they consistently occurred near the culmination of the three periods with over-all positive mass balances in the 1920s, 1930s, 1980s and in the first decade of the 21st century (Fig. 4b). In agreement with the progressively smaller magnitude of these peaks in the cumulative mass-balance series, the three Grande del Nevado surges also showed a decreasing power and trans-ferred progressively smaller quantities of mass from the up-per to the lower parts of the glacier. Two recent surges of Hor-cones Inferior glacier in the nearby Mt. Aconcagua area also occurred in the mid-1980s and again between 2002 and 2006, suggesting a possible connection between the development of surging events and the periods with overall positive mass-balance conditions in this region (Pitte et al., 2016).
con-flicts over the limited water resources (almost entirely origi-nating in the mountains) arising on both sides of the Andes.
Keeping these caveats in mind, the common pattern of strongly negative mass balances, the similarities with the few available glacier chronologies and the regional nature of the predictors used in the ECH reconstruction suggest that this series may nonetheless be considered representative (in relative terms) of the mass-balance changes during recent decades in other less-studied areas in this region. Reliable data from a larger number of glaciers, together with addi-tional studies of the glacier–climate relationships are, how-ever, still needed to support this hypothesis and to identify, for example, the main climatic forcings behind the recent glacier shrinkage observed in the Central Andes of Chile and Argentina (Masiokas et al., 2009). This is a challenging issue due to several factors, including the serious lack of glacier mass-balance series and high-elevation climate records, the complex dynamic response of individual glaciers to similar changes in climate and the great variety of glaciers existing in this region (Pellicciotti et al., 2014). The results discussed in this study offer a useful starting point to address the vari-ous pending issues mentioned above and will hopefully stim-ulate further glaciological, climatological and hydrological research in this poorly known mountainous region.
Acknowledgements. This work was funded by Consejo Nacional
de Investigaciones Científicas y Técnicas (CONICET, Argentina), FONDECYT Grant 1121106 and FONDAP Grant 15110009 (Chile). We greatly acknowledge the World Glacier Moni-toring Service (http://www.wgms.ch), Dirección General de Aguas (http://www.dga.cl), Dirección Meteorológica de Chile (http://www.meteochile.gob.cl) and Subsecretaría de Recursos Hídricos (http://www.hidricosargentina.gov.ar) for providing the data used in this study. ERA-Interim reanalysis data and correlation maps were provided by the freely available Climate Explorer online application maintained by Geert Jan van Olden-borgh at the Royal Netherlands Meteorological Institute (KNMI; http://climexp.knmi.nl/). E. Berthier acknowledges support from the French Space Agency (CNES) through his TOSCA program, S. U. Nussbaumer acknowledges support from the Swiss National Science Foundation (project PBBEP2-139400) and A. González-Reyes acknowledges the support from CONICYT (Chile) to conduct his PhD studies. The comments and suggestions from the handling editor and three anonymous reviewers significantly improved the manuscript and are greatly appreciated.
Edited by: V. Radic
References
Aceituno, P.: On the functioning of the Southern Oscillation in the South American sector. Part I: Surface climate, Mon. Weather Rev., 116, 505–524, 1988.
Casassa, G., Rivera, A., and Schwikowski, M.: Glacier mass-balance data for southern South America (30◦S–56◦S), in: Glacier Science and Environmental Change, edited by: Knight, P. G., Blackwell Publishing, Malden, MA, USA, 239–241, doi:10.1002/9780470750636.ch47, 2006.
Cara, L., Masiokas, M. H., Viale, M., and Villalba, R.: Assessing snow cover variations in the Río Mendoza upper basin using MODIS satellite imagery, Revista Meteorológica, p. 25, in press, 2016.
Cogley, J. G., Hock, R., Rasmussen, L. A., Arendt, A. A., Bauder, A., Braithwaite, R. J., Jansson, P., Kaser, G., Möller, M., Nichol-son, L., and Zemp, M.: Glossary of Glacier Mass Balance and Related Terms, IHP-VII Technical Documents in Hydrology No. 86, IACS Contribution No. 2, UNESCO-IHP, Paris, 124 pp., 2011.
DGA: Radio Eco-sondaje en la cuenca del río Maipo y mediciones glaciológicas en el glaciar Tyndall, Campo de Hielo Sur. Direc-ción General de Aguas, Santiago de Chile, S.I.T., 204, 95 pp., 2009.
DGA: Balance de masa en el glaciar Echaurren Norte temporadas 1997–1998 a 2008–2009, Dirección General de Aguas, Santiago de Chile, 32 pp., 2010.
Escobar, F. and Garín, C.: Complemento No. 1, años 1993–1996, al “Balance de masa en el glaciar Echaurren Norte, 1975 a 1992. Resultados preliminares”, Publicación DGA, H. A. y G. 97/1, Dirección General de Aguas, Santiago, Chile, 18 pp., 1997. Escobar, F., Casassa, G., and Pozo, V.: Variaciones de un glaciar
de montaña en los Andes de Chile central en las últimas dos dé-cadas, Bull. Inst. Fr. Etud. Andin., 24, 683–695, 1995a. Escobar, F., Pozo, V., Salazar, A., and Oyarzo, M.: Balance de masa
en el glaciar Echaurren Norte, 1975 a 1992, Resultados prelim-inares, Publicación DGA, H. A. y G. 95/1, Dirección General de Aguas, Santiago, Chile, 109 pp., 1995b.
Espizua, L.: Fluctuations of the Río del Plomo Glaciers, Geograf. Ann. A, 68, 317–327, 1986.
Falvey, M. and Garreaud, R. D.: Regional cooling in a warming world: Recent temperature trends in the southeast Pacific and along the west coast of subtropical South America (1979–2006), J. Geophys. Res., 114, D04102, doi:10.1029/2008JD010519, 2009.
Garreaud, R. D.: The Andes climate and weather, Adv. Geosci., 22, 3–11, doi:10.5194/adgeo-22-3-2009, 2009.
Helbling, R.: The origin of the Río Plomo ice-dam, Geographical J., 8, 41–49, 1935.
Kaser, G., Grosshauser, M., and Marzeion, B.: Contribution potential of glaciers to water availability in different cli-mate regimes, P. Natl. Acad. Sci. USA, 107, 20223–20227, doi:10.1073/pnas.1008162107, 2010.
Leiva, J. C., Cabrera, G. A., and Lenzano, L. E.: 20 years of mass balances on the Piloto glacier, Las Cuevas river basin, Mendoza, Argentina, Global Planet. Change, 59, 10–16, 2007.
revealed by high-resolution regional atmospheric climate model-ing, J. Climate, 27, 4607–4621, 2014.
Le Quesne, C., Acuña, C., Boninsegna, J. A., Rivera, A., and Barichivich, J.: Long-term glacier variations in the Central An-des of Argentina and Chile, inferred from historical records and tree-ring reconstructed precipitation, Palaeogeogr. Palaeocl., 281, 334–344, 2009.
Lliboutry, L.: Glaciers of the dry Andes, in: Satellite Image Atlas of Glaciers of the World: South America, edited by: Williams, R. S. and Ferrigno, J. G., USGS Professional Paper 1386-I, avail-able at: http://pubs.usgs.gov/prof/p1386i/index.html (last access: 1 July 2015), 1998.
MacDonell, S., Kinnard, C., Mölg, T., Nicholson, L., and Aber-mann, J.: Meteorological drivers of ablation processes on a cold glacier in the semi-arid Andes of Chile, The Cryosphere, 7, 1513–1526, doi:10.5194/tc-7-1513-2013, 2013.
Marzeion, B., Hofer, M., Jarosch, A. H., Kaser, G., and Molg, T.: A minimal model for reconstructing interannual mass balance variability of glaciers in the European Alps, The Cryosphere, 6, 71–84, doi:10.5194/tc-6-71-2012, 2012.
Masiokas, M. H., Villalba, R., Luckman, B. H., LeQuesne, C., and Aravena, J. C.: Snowpack variations in the central Andes of Ar-gentina and Chile, 1951–2005: Large-scale atmospheric influ-ences and implications for water resources in the region, J. Cli-mate, 19, 6334–6352, 2006.
Masiokas, M. H., Villalba, R., Luckman, B. H., Delgado, S., Las-cano, M., and Stepanek, P.: 20th-century glacier recession and re-gional hydroclimatic changes in northwestern Patagonia, Global Planet. Change, 60, 85–100, 2008.
Masiokas, M. H., Rivera, A., Espizua, L. E., Villalba, R., Delgado, S., and Aravena, J. C.: Glacier fluctuations in extratropical South America during the past 1000 years, Palaeogeogr. Palaeocl., 281, 242–268, 2009.
Masiokas, M. H., Villalba, R., Luckman, B. H., and Mauget, S.: Intra- to multidecadal variations of snowpack and streamflow records in the Andes of Chile and Argentina between 30◦and 37◦S, J. Hydrometeorol., 11, 822–831, 2010.
Masiokas, M. H., Villalba, R., Christie, D. A., Betman, E., Luck-man, B. H., Le Quesne, C., Prieto, M. R., and Mauget, S.: Snowpack variations since AD 1150 in the Andes of Chile and Argentina (30◦–37◦S) inferred from rainfall, tree-ring and documentary records, J. Geophys. Res.-Atmos., 117, D05112, doi:10.1029/2011JD016748, 2012.
Masiokas, M. H., Villalba, R., Luckman, B. H., Montaña, E., Bet-man, E., Christie, D., Le Quesne, C., and Mauget, S.: Recent and historic Andean snowpack and streamflow variations and vulnerability to water shortages in central-western Argentina, in: Climate Vulnerability: Understanding and Addressing Threats to Essential Resources, Vol. 5, edited by: Pielke Sr., R. A. and Hos-sain, F., Elsevier Inc., Academic Press, 213–227, 2013. Michaelsen, J.: Cross-validation in statistical climate forecast
mod-els, J. Clim. Appl. Meterorol., 26, 1589–1600, 1987.
Miller, A.: The climate of Chile, in: World Survey of Climatol-ogy, Vol. 12, edited by: Schwerdtfeger, W., Elsevier, Amsterdam, 113–218, 1976.
Pellicciotti, F., Ragettli, S., Carenzo, M., and McPhee, J.: Changes of glaciers in the Andes of Chile and priorities for future work, Sci. Total Environ., 493, 1197–1210, 2014.
Peña, H. and Narbona, J.: Proyecto Glaciar Echaurren Norte, In-forme preliminar, Dirección General de Aguas, Departamento de Hidrología, Santiago, Chile, 75 pp., 1978.
Peña, H., Vidal., F., and Escobar, C.: Caracterización del manto ni-val y mediciones de ablación y balance de masa en glaciar Echau-rren norte, PHI UNESCO, Jornadas de Hidrología de Nieves y Hielos en América del Sur, Santiago, Chile, 22 pp., 1984. Pitte, P., Berthier, E., Masiokas, M. H., Cabot, V., Ruiz, L., Ferri
Hidalgo, L., Gargantini, H., and Zalazar, L.: Geometric evolu-tion of the Horcones Inferior Glacier (Mount Aconcagua, Central Andes) during the 2002–2006 surge, J. Geophys. Res.-Ea. Surf., 121, 111–127, doi:10.1002/2015JF003522, 2016.
Popovnin, V. V., Danilova, T. A., and Petrakov, D. A.: A pioneer mass balance estimate for a Patagonian glacier: Glaciar De los Tres, Argentina, Global Planet. Change, 22, 255–267, 1999. Rabatel, A., Castebrunet, H., Favier, V., Nicholson, L., and
Kin-nard, C.: Glacier changes in the Pascua-Lama region, Chilean Andes (29◦S): recent mass balance and 50 yr surface area vari-ations, The Cryosphere, 5, 1029–1041, doi:10.5194/tc-5-1029-2011, 2011.
Radi´c, V., Bliss, A., Beedlow, A. C., Hock, R., Miles, E., and Cogley, J. G.: Regional and global projections of twenty-first century glacier mass changes in response to climate scenar-ios from global climate models, Clim. Dynam., 42, 37—8, doi:10.1007/s00382-013-1719-7, 2013.
Ragettli, S., Cortés, G., McPhee, J., and Pellicciotti, F.: An evalua-tion of approaches for modelling hydrological processes in high-elevation, glacierized Andean watersheds, Hydrol. Process., 28, 5674–5695, doi:10.1002/hyp.10055, 2014.
Rasmussen, L., Conway, H., and Raymond, C.: Influence of upper air conditions on the Patagonia Icefields, Global Planet. Change, 59, 203–216, 2007.
Rignot, E., Rivera, A., and Cassasa, G.: Contribution of the Patago-nia Icefields to sea level rise, Science, 302, 434-437, 2003. Rivera, A., Casassa, G., Acuña, C., and Lange, H.: Recent glacier
variations in Chile, Investigaciones Geográficas, 34, 29–60, 2000.
Rivera, A., Bown, F., Casassa, G., Acuña, C., and Clavero, J.: Glacier shrinkage and negative mass balance in the Chilean Lake District (40◦S), Hydrolog. Sci. J., 50, 963–974, 2005.
Ruiz, L., Pitte, P., and Masiokas, M.: The initiation of mass bal-ance studies on the Argentinean glaciers on Mount Tronador, CRN2047 Science Meeting, 21–25 April 2013, Uspallata, Ar-gentina, p. 23, 2013.
Schaefer, M., Machguth, H., Falvey, M., and Casassa, G.: Mod-eling past and future surface mass balance of the North-ern Patagonia Icefield, J. Geophys. Res., 118, 571–588, doi:10.1002/jgrf.20038, 2013.
Schaefer, M., Machguth, H., Falvey, M., Casassa, G., and Rignot, E.: Quantifying mass balance processes on the Southern Patag-onia Icefield, The Cryosphere, 9, 25–35, doi:10.5194/tc-9-25-2015, 2015.
Taulis, E.: De la distribucion de pluies au Chili, Matér. Étude Calamités, 33, 3–20, 1934.
Vuille, M., Franquist, E., Garreaud, R., Lavado Casimiro, W. S., and Cáceres, B.: Impact of the global warming hiatus on An-dean temperature, J. Geophys. Res.-Atmos., 120, 3745–3757, doi:10.1002/2015JD023126, 2015.
Weisberg, S.: Applied Linear Regression, 2nd Edn., John Wiley, New York, 324 pp., 1985.
WGMS: Glacier Mass Balance Bulletin No. 12 (2010–2011), edited by: Zemp, M., Nussbaumer, S. U., Naegeli, K., Gärtner-Roer, I., Paul, F., Hoelzle, M., and Haeberli, W., ICSU (WDS)/IUGG (IACS)/UNEP/UNESCO/WMO, World Glacier Monitoring Ser-vice, Zurich, Switzerland, 106 pp., publication based on database version: doi:10.5904/wgms-fog-2013-11, 2013.