TCD
7, 975–1028, 2013Region-wide glacier mass balances over
the Pamir-Karakoram-Himalaya
J. Gardelle et al.
Title Page
Abstract Introduction
Conclusions References
Tables Figures
◭ ◮
◭ ◮
Back Close
Full Screen / Esc
Printer-friendly Version
Interactive Discussion
Discussion
P
a
per
|
Dis
cussion
P
a
per
|
Discussion
P
a
per
|
Discussio
n
P
a
per
|
The Cryosphere Discuss., 7, 975–1028, 2013 www.the-cryosphere-discuss.net/7/975/2013/ doi:10.5194/tcd-7-975-2013
© Author(s) 2013. CC Attribution 3.0 License.
Geoscientiic Geoscientiic
Geoscientiic Geoscientiic
Open Access
The Cryosphere Discussions
This discussion paper is/has been under review for the journal The Cryosphere (TC). Please refer to the corresponding final paper in TC if available.
Region-wide glacier mass balances over
the Pamir-Karakoram-Himalaya during
1999–2011
J. Gardelle1,*, E. Berthier2, Y. Arnaud3, and A. Kääb4
1
CNRS – Université Grenoble 1, Laboratoire de Glaciologie et de Géophysique de l’Environnement (LGGE), UMR5183, 54 rue Molière, BP 96, 38402 Saint Martin d’Hères Cedex, France
2
CNRS, Université de Toulouse, LEGOS, 14 av. Edouard Belin, Toulouse 31400, France
3
IRD – Université Grenoble 1, LTHE/LGGE, 54 rue Molière, BP 96, 38402 Saint Martin d’Hères Cedex, France
4
Department of Geosciences, University of Oslo, P.O. Box 1047 Blindern, 0316 Oslo, Norway
*
now at: UJF – Université Grenoble 1 – CNRS, Laboratoire d’étude des transferts en hydrologie et environnement (LTHE), UMR5564, 54 rue Molière, BP 96, 38402 Saint Martin d’Hères Cedex, France
Received: 29 January 2013 – Accepted: 21 February 2013 – Published: 7 March 2013
Correspondence to: J. Gardelle (gardelle@lgge.obs.ujf-grenoble.fr)
TCD
7, 975–1028, 2013Region-wide glacier mass balances over
the Pamir-Karakoram-Himalaya
J. Gardelle et al.
Title Page
Abstract Introduction
Conclusions References
Tables Figures
◭ ◮
◭ ◮
Back Close
Full Screen / Esc
Printer-friendly Version
Interactive Discussion
Discussion
P
a
per
|
Dis
cussion
P
a
per
|
Discussion
P
a
per
|
Discussio
n
P
a
per
|
Abstract
The recent evolution of Pamir-Karakoram-Himalaya (PKH) glaciers, widely acknowl-edged as valuable high-altitude as well as mid-latitude climatic indicators, remains poorly known. To overcome the lack of region-wide mass balance data, we compared the 2000 Shuttle Radar Topography Mission (SRTM) digital elevation model (DEM) to 5
recent (2008–2011) DEMs derived from SPOT5 stereo-imagery for 8 sites spread from Pamir to eastern Himalaya. The region-wide glacier mass balances were contrasted during the last decade, with moderate mass losses in eastern and central Himalaya (−0.21±0.10 m yr−1 w.e. to−0.29±0.09 m yr−1w.e.) and larger losses in western
Hi-malaya (−0.41±0.11 m yr−1 w.e.). Recently reported slight mass gain of glaciers in
10
central Karakoram is confirmed for a larger area (+0.10±0.19 m yr−1 w.e.) and, new,
also observed for glaciers in western Pamir (+0.14±0.10 m yr−1 w.e.). We propose
that the “Karakoram anomaly” should be renamed the “Pamir-Karakoram anomaly”, at least for the last decade. The overall mass balance of PKH glaciers is estimated at
−0.12±0.06 m yr−1 w.e. In contrast to Indus, the relative glacier imbalance
contribu-15
tion to Brahmaputra and Ganges discharges is higher than previously modeled glacier seasonal contribution.
1 Introduction
The Pamir-Karakoram-Himalaya (PKH) mountain ranges are covered by more than 70 000 km2of glaciers (Arendt et al., 2012). The influence of the south-east Asian and 20
the Indian summer monsoons in the east, the Westerlies in the west, as well as the natural orographic barrier by the PKH mountain ranges, result in a complex climate diversity (Bookhagen and Burbank, 2010) and a contrasting pattern of glacier change throughout the PKH (Bolch et al., 2012; Kääb et al., 2012; Fujita and Nuimura, 2011). Assessing glacier evolution over a regional scale in the PKH is therefore challeng-25
TCD
7, 975–1028, 2013Region-wide glacier mass balances over
the Pamir-Karakoram-Himalaya
J. Gardelle et al.
Title Page
Abstract Introduction
Conclusions References
Tables Figures
◭ ◮
◭ ◮
Back Close
Full Screen / Esc
Printer-friendly Version
Interactive Discussion
Discussion
P
a
per
|
Dis
cussion
P
a
per
|
Discussion
P
a
per
|
Discussio
n
P
a
per
|
(ii) better describe the impacts of climate change in the region, and, ultimately, (iii) re-liably project glacier response to 21st century climate changes. Not least, glaciers and their changes in the PKH are significant due to their contribution to water-related haz-ards and water resources (Immerzeel et al., 2010; Kaser et al., 2010), which can be evaluated at three different levels:
5
(i) In the vicinity of the glaciers, the formation of glacial lakes, typically connected to glacier retreat or dynamic instabilities, leads to the collection of melt water behind frontal moraines or ice dams, and represents a potential threat to local populations, agriculture and hydropower infrastructure, in case of a glacial lake outburst flood (GLOF) (Richardson and Reynolds, 2000; Ives et al., 2010). 10
(ii) Glaciers also play the role of water reservoirs by releasing melt water during the summer and contribute to river runoff to an extent that depends on the
precipi-tation regime (Kaser et al., 2010). In the western and interior parts of the PKH, the melt season is also the dry season, which results in a high seasonal glacier contribution to river discharge. In addition, the glacier imbalance can contribute to 15
river runoff, for instance up to∼10 % in the Upper Indus basin and only∼2 % in
the Ganges basin for 2003–2008 (Kääb et al., 2012).
(iii) At a global scale, PKH glaciers are contributing to sea-level rise. Recently, Kääb et al. (2012) estimated a contribution from the Karakoram-Himalaya of +0.035±
0.009 mm yr−1over 2003–2008.
20
Length changes have been measured over about 100 glaciers in PKH and mainly revealed a retreat of glacier fronts since the mid-19th century, except in Karakoram (Bolch et al., 2012; Bhambri et al., 2012). Scherler et al. (2011a) showed that more than 50 % of Karakoram glaciers were stable or advancing between 2000 and 2008. The majority of glaciers lost area over the past decades (Bolch et al., 2012) and in most 25
TCD
7, 975–1028, 2013Region-wide glacier mass balances over
the Pamir-Karakoram-Himalaya
J. Gardelle et al.
Title Page
Abstract Introduction
Conclusions References
Tables Figures
◭ ◮
◭ ◮
Back Close
Full Screen / Esc
Printer-friendly Version
Interactive Discussion
Discussion
P
a
per
|
Dis
cussion
P
a
per
|
Discussion
P
a
per
|
Discussio
n
P
a
per
|
used to evaluate the impact of climate change on glaciers, especially in the presence of surge-type and/or debris-covered glaciers which are common in the PKH.
Mass balance is the most relevant variable to assess glacier responses to cli-mate variability (Oerlemans, 2001; Vincent, 2002), but mass balance esticli-mates remain scarce in the PKH and may not adequately sample the wide range of climates and 5
glacier responses in the region. Four different methods of mass balance
measure-ments have been used in the PKH:
(i) Glaciological (i.e. field) measurements are relatively short-term (less than 10 yr), mainly because of accessibility and remoteness issues. In addition, they are often biased towards small to medium sized and debris-free glaciers for obvious logis-10
tical reasons (e.g. Azam et al., 2012; Fujita and Nuimura, 2011; Dobhal et al., 2008; Yao et al., 2012).
(ii) The geodetic method, based on the comparison of topographic data (digital el-evation models or laser point-wise elel-evation), is therefore a good alternative to increase the number and types (e.g. related to size, elevation, aspect, debris-15
cover etc.) of monitored glaciers (Berthier et al., 2007; Bolch et al., 2011; Kääb et al., 2012).
(iii) A third method, based on the Accumulation Area Ratio (AAR) has been applied by Kulkarni et al. (2011) to 19 glaciers in north-west India, but glaciological mass balances during various years have to be available for this approach so that an 20
empirical relationship between annual mass balance and AAR (or equilibrium line altitude, ELA) can be established.
(iv) The hydrological method has only been used once in the PKH to our knowledge, providing 5 yr of mass balance for Siachen Glacier, Karakoram (Bhutiyani, 1999), but is very difficult to implement because of the lack of accurate precipitation and
25
runoffmeasurements at high altitude in PKH (Bolch et al., 2012; Immerzeel et al.,
TCD
7, 975–1028, 2013Region-wide glacier mass balances over
the Pamir-Karakoram-Himalaya
J. Gardelle et al.
Title Page
Abstract Introduction
Conclusions References
Tables Figures
◭ ◮
◭ ◮
Back Close
Full Screen / Esc
Printer-friendly Version
Interactive Discussion
Discussion
P
a
per
|
Dis
cussion
P
a
per
|
Discussion
P
a
per
|
Discussio
n
P
a
per
|
In central Himalaya, all mass budgets published to date are negative on average, most values ranging between −0.32 m yr−1 w.e. for Dokriani Glacier (Dobhal et al.,
2008) over 1992–2000 to −0.75 m yr−1 w.e. for the AX010 Glacier over 1978–2008 (Fujita and Nuimura, 2011). Bolch et al. (2011) reported a mass balance of −0.32±
0.08 m yr−1 w.e. between 1970 and 2007 over 62 km2 of glaciers in the Everest area 5
(Nepal), while for a larger group of glaciers covering 183 km2in the same area, Nuimura et al. (2012) measured a mass balance of−0.40±0.25 m yr−1w.e. over 1992–2008.
Further west, in Lahaul and Spiti (India), the Chhota Shigri Glacier has been mon-itored in the field since 2002 (Wagnon et al., 2007) and glaciological measurements revealed a mass budget of−0.67±0.40 m yr−1w.e. between 2002–2010 (Azam et al.,
10
2012). Another study reported a geodetic mass balance comprised between −0.70
and−0.85 m yr−1w.e. over 1999–2004 for a glacierized area of 915 km2around Chhota
Shigri Glacier (Berthier et al., 2007). For the longer 1999–2011 period, the region-wide (2110 km2 of glaciers) mass balance was less negative, at −0.44±0.09 m yr−1 w.e.
(Vincent et al., 2012). 15
Recently, Gardelle et al. (2012a) revealed that glaciers covering 5615 km2in central Karakoram have been slightly gaining mass over 1999–2008, confirming a “Karakoram anomaly” that was first suggested by field observations of glacier thickening (Hewitt, 2005), increased glacier velocities (Quincey et al., 2009; Heid and Kääb, 2012) and increased precipitation in the region (Archer and Fowler, 2004).
20
In Pamir, Abramov Glacier was monitored during 30 yr (1968–1998), which makes it the longest time-series of mass balance measurement in PKH, with a mean value of
−0.46 m yr−1w.e. (WGMS, 2012). Recently, Yao et al. (2012) reported a positive mass
budget of+0.25 m yr−1w.e. for the 1 km2Muztag Ata Glacier in eastern Pamir between
2005 and 2010. This estimate of positive glacier mass balance in Pamir (covered by 25
TCD
7, 975–1028, 2013Region-wide glacier mass balances over
the Pamir-Karakoram-Himalaya
J. Gardelle et al.
Title Page
Abstract Introduction
Conclusions References
Tables Figures
◭ ◮
◭ ◮
Back Close
Full Screen / Esc
Printer-friendly Version
Interactive Discussion
Discussion
P
a
per
|
Dis
cussion
P
a
per
|
Discussion
P
a
per
|
Discussio
n
P
a
per
|
The aim of this paper is to propose a homogeneous survey of regional glacier mass balances along the PKH between 1999 and 2011. This is achieved by differencing two
digital elevation models (DEMs) over 8 study sites, selected to be representative of the PKH climatic and glaciological diversity. This allows estimating the spatial pattern of glacier elevation changes along the 3000 km long group of mountain ranges, as 5
well as the influence of debris cover on thinning rates. Finally, we extrapolate these measurements to provide a new estimate of the overall mass budget of PKH glaciers, and their contribution to regional hydrology and sea level rise during the first decade of the 21st century.
The length of the study period has been doubled compared to Kääb et al. (2012) 10
and the study area has been significantly extended towards the east (Hengduan Shan, China) and the west (Pamir, Tajikistan), two sub-regions where no geodetic mass bal-ances were available. We also provide an exhaustive coverage of glacier elevation changes for each of the 8 study sites (as opposed to the sampling by ICEsat along satellite tracks only). However, contrary to the ICESat study (Kääb et al., 2012) our 15
method is limited to selected sites and does not provide insight into the seasonal and annual evolution of glacier mass balance.
2 Study area
Mass balances are investigated for 8 study sites spread along the PKH mountain ranges to capture the climatic and glaciological variability of the region. The location 20
of each study site is displayed in Fig. 1, as well as the extent of the corresponding sub-regions used to extrapolate the results to the whole PKH range (see Sect. 3.4). PKH glacier melt water contributes to four major rivers of Asia (Brahmaputra, Ganges, Indus and Amu Darya), whose catchment areas are also presented in Fig. 1.
Each study site corresponds to the extent of a SPOT5 DEM (see Sect. 3.1). A com-25
TCD
7, 975–1028, 2013Region-wide glacier mass balances over
the Pamir-Karakoram-Himalaya
J. Gardelle et al.
Title Page
Abstract Introduction
Conclusions References
Tables Figures
◭ ◮
◭ ◮
Back Close
Full Screen / Esc
Printer-friendly Version
Interactive Discussion
Discussion
P
a
per
|
Dis
cussion
P
a
per
|
Discussion
P
a
per
|
Discussio
n
P
a
per
|
cloud coverage. The stereo-images used to compute the DEMs should be acquired as close as possible to the end of the glacier ablation season and with a minimal cloud cover. All these requirements make it difficult to obtain a larger number of stereo scenes
at suitable dates and locations. Despite these difficulties, our SPOT5 DEMs sampled
in total 21 500 km2of glaciers, about 30 % of the total glacierized area in the PKH. 5
The eastern-most sites (Hengduan Shan, Bhutan, Everest and West Nepal) are strongly influenced by the Indian and south-east Asian summer monsoons. Ablation and accumulation of monsoon-type glaciers occur both during the summer season. On the opposite, in the north-west (Pamir, Hindu Kush and Karakoram), the climate is dominated by the Westerlies and glaciers are of winter-accumulation type. The Spiti 10
Lahaul site lies in a transition zone, influenced both by the monsoon and the Wester-lies. The topography also plays a strong role in the moisture transfer as it prevents the air masses to travel further north, which results in a northward decrease of snowfall (Bookhagen and Burbank, 2010).
Monsoon-type glaciers are expected to be more sensitive to a change in the 15
rain/snow limit driven by an increase in temperature than winter-accumulation type glaciers. Indeed, a summer warming would increase the altitude of the rain/snow limit and would result in a reduced snow accumulation on glaciers, as well as a decrease in their surface albedo (less fresh snow with a high albedo) that would enhance ablation (Fujita, 2008).
20
Karakoram and Pamir are known to host numerous surge-type glaciers (Barrand and Murray, 2006; Kotlyakov et al., 2008; Hewitt, 2007), characterized by the alternation between active phases involving rapid mass transfer from high to low elevations, and longer quiescence phases of low mass fluxes. Copland et al. (2011) reported a dou-bling in the number of glacier surges after 1990 in the Karakoram, with a total of 90 25
TCD
7, 975–1028, 2013Region-wide glacier mass balances over
the Pamir-Karakoram-Himalaya
J. Gardelle et al.
Title Page
Abstract Introduction
Conclusions References
Tables Figures
◭ ◮
◭ ◮
Back Close
Full Screen / Esc
Printer-friendly Version
Interactive Discussion
Discussion
P
a
per
|
Dis
cussion
P
a
per
|
Discussion
P
a
per
|
Discussio
n
P
a
per
|
Many PKH glaciers are heavily debris-covered in their ablation area, because of steep rock walls that surround them, and an intense avalanche activity (Bolch et al., 2012). The size of these debris zones is highly variable and debris thickness can range from few centimeters (dust or sand) to several meters, especially at the glacier front (Mihalcea et al., 2008). The mean debris-cover is about 10 % of the total glacier area 5
in the PKH (Bolch et al., 2012), but can reach 36 % in the Central Himalaya (Scherler et al., 2011a).
In eastern PKH (Bhutan, Everest, West Nepal), glacier termini are often connected to pro-glacial lakes storing melt water behind frontal moraines or dead-ice dams, whereas in western PKH, pro-glacial lakes are less numerous and glacier ablation areas are 10
often scattered with supra-glacial lakes, resulting of successive coalescence of small melting ponds (Gardelle et al., 2011).
3 Data and methods
3.1 Digital elevation models
For each study site, we used the Shuttle Radar Topographic Mission (SRTM) version 15
4 DEM as the reference topography (Rabus et al., 2003). This data set, acquired in February 2000, comes along with a mask to identify the pixels which have been in-terpolated (both were downloaded from http://srtm.csi.cgiar.org/). On each site, the SRTM DEM is subtracted from a more recent DEM, built from a stereo pair acquired by the HRS sensor onboard the SPOT5 satellite (Korona et al., 2009). The date of each 20
SPOT5 DEM acquisition differs depending on the study site (Table 1) but 7 out of 8
TCD
7, 975–1028, 2013Region-wide glacier mass balances over
the Pamir-Karakoram-Himalaya
J. Gardelle et al.
Title Page
Abstract Introduction
Conclusions References
Tables Figures
◭ ◮
◭ ◮
Back Close
Full Screen / Esc
Printer-friendly Version
Interactive Discussion
Discussion
P
a
per
|
Dis
cussion
P
a
per
|
Discussion
P
a
per
|
Discussio
n
P
a
per
|
The SRTM DEM and mask, originally at a 3 arc sec resolution (∼90 m), are
resam-pled to 40 m (UTM projection, WGS84 ellipsoid) to match the posting and projection of the SPOT5 DEM. Altitudes are defined above the EGM96 geoid for both DEMs.
3.2 Glacier mask
Where available over the whole study site (Hengduan Shan, Everest and West Nepal), 5
the glaciers outlines were downloaded from the GLIMS dataset (Raup et al., 2007) and manually corrected if needed. Otherwise, the glacier mask was derived from Landsat-TM/-ETM+ images (path/row and dates of acquisition are given in Table 1 for each
study site). A threshold (between 0.5 and 0.7 depending on the study site) on the Nor-malized Difference Snow Index (TM2-TM5)/(TM2+TM5) was applied to detect clean ice
10
and snow automatically, whereas debris-covered parts were digitized manually by vi-sual interpretation (Racoviteanu et al., 2009). The total glacier area and debris-covered part can be found for each study site in Table 1.
Most inventories are derived from Landsat images with minimal snow cover from around the year 2000 (before the Scan Line Corrector failure in 2003, which used to 15
compensate for the forward motion of the Landsat 7 satellite, and results in a∼20 %
data loss within a scene after 2003) and checked based on the SPOT5 ortho-images. Glacier areas are expected to have experienced minor changes since then, except for glaciers that surged and thus advanced. For the latter, their front position was digitized manually based on the SPOT5 ortho-image.
20
For each study site, we favored user-defined glacier inventories instead of the global Randolph Glacier Inventory (RGI, Arendt et al., 2012) because the latter did not match our accuracy requirements for the adjustments and corrections of the DEMs (see Sect. 3.3).
We also estimated the altitude of the equilibrium line (ELA) as the snowline on the 25
∼2000 Landsat data with minimal snow cover to separate ablation and accumulation
TCD
7, 975–1028, 2013Region-wide glacier mass balances over
the Pamir-Karakoram-Himalaya
J. Gardelle et al.
Title Page
Abstract Introduction
Conclusions References
Tables Figures
◭ ◮
◭ ◮
Back Close
Full Screen / Esc
Printer-friendly Version
Interactive Discussion
Discussion
P
a
per
|
Dis
cussion
P
a
per
|
Discussion
P
a
per
|
Discussio
n
P
a
per
|
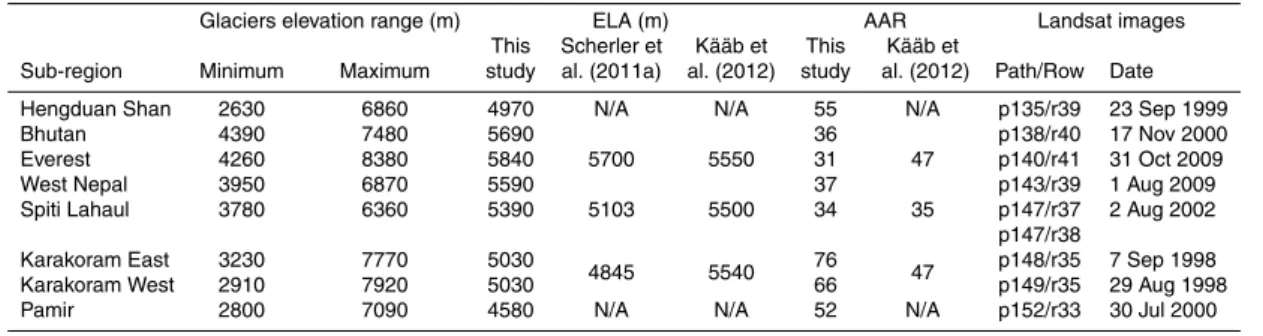
first snowfalls. Therefore, we digitized by visual interpretation snowlines for more than 30 glaciers on Landsat images for each study site and computed their mean elevations (see Landsat acquisition dates and corresponding ELAs in Table 2). Our ELAs are in good agreement with their recently published distribution around the Tibetan Plateau (Yao et al., 2012), and slightly differ from those given by Scherler et al. (2011a) and
5
Kääb et al. (2012) (see Table 2 for comparison).
3.3 Adjustments and corrections of DEMs biases
The different DEM processing steps to extract glaciers elevation changes have already
been widely investigated and validated before (e.g. Nuth and Kääb, 2011; Paul, 2008; Berthier et al., 2007; Gardelle et al., 2012b). Here, we applied to each study site the 10
successive corrections listed below:
(i) Planimetric adjustment of the DEMs
A horizontal shift between the two digital elevations models results in an aspect-dependent bias of elevation differences (Nuth and Kääb, 2011). To determine the
value of this shift, we minimize the root mean square error of elevation differences
15
(SPOT5-SRTM) offglaciers, where the terrain is assumed to be stable over the
study period (Berthier et al., 2007; Bolch et al., 2011). The SRTM DEM is then resampled (cubic convolution) according to the shift.
(ii) Along/across track corrections (drift of the satellite orbit)
In the case of DEMs derived from stereo-imagery, the satellite acquisition geome-20
try can induce a bias along and/or across the track direction (Berthier et al., 2007). We estimate the along-track angle of each SPOT5 DEM and use it to rotate the coordinate system accordingly (Nuth and Kääb, 2011). Then, we compute the el-evation differences along and across the satellite track on stable areas and when
TCD
7, 975–1028, 2013Region-wide glacier mass balances over
the Pamir-Karakoram-Himalaya
J. Gardelle et al.
Title Page
Abstract Introduction
Conclusions References
Tables Figures
◭ ◮
◭ ◮
Back Close
Full Screen / Esc
Printer-friendly Version
Interactive Discussion
Discussion
P
a
per
|
Dis
cussion
P
a
per
|
Discussion
P
a
per
|
Discussio
n
P
a
per
|
(iii) Curvature correction
As suggested by Paul (2008) and Gardelle et al. (2012b), the difference in
orig-inal spatial resolutions of the two DEMs can lead to biases related with altitude in mountainous areas. When the curvature (defined as the first derivative of the slope) is high (sharp peaks or ridges), the altitude tends to be underestimated by 5
the coarse DEM, unable to reproduce high-frequency slope variations. Thus, this apparent “elevation bias” is corrected using the relation between elevation diff
er-ences and the maximum terrain curvature estimated over stable areas offglaciers
(Gardelle et al., 2012b). (Note that the units in Fig. 1b in Gardelle et al. (2012b) should be 10−2m−1, instead of m−1; A. Gardner, personal communication, 2012. 10
However, this does not impact the value or the validity of the correction.)
(iv) Radar penetration correction
The SRTM DEM, acquired in C-band, potentially underestimates glacier eleva-tions, since at this wavelength, the penetration of the radar signal into snow and ice can reach several meters (e.g. Rignot et al., 2001). Here, we estimate this 15
penetration for each study site by differencing the SRTM C-band (5.7 GHz) and
X-band (9.7 GHz) DEMs. The latter has been acquired simultaneously to the SRTM C-band at higher resolution (30 m) but with a narrower swath and thus has a cover-age restricted to selected stripes only. Since the X-band penetration is expected to be low compared to C-band penetration (an hypothesis that still need to be 20
confirmed), we consider the elevation difference (SRTM
C-band–SRTMX-band) to be a first approximation of C-band radar penetration over glaciers (Gardelle et al., 2012b). The correction is calculated as a function of altitude and applied to each pixel separately.
In Spiti Lahaul and West Nepal, due to the lack of SRTMX-band data, we were 25
TCD
7, 975–1028, 2013Region-wide glacier mass balances over
the Pamir-Karakoram-Himalaya
J. Gardelle et al.
Title Page
Abstract Introduction
Conclusions References
Tables Figures
◭ ◮
◭ ◮
Back Close
Full Screen / Esc
Printer-friendly Version
Interactive Discussion
Discussion
P
a
per
|
Dis
cussion
P
a
per
|
Discussion
P
a
per
|
Discussio
n
P
a
per
|
(v) Seasonality correction
SPOT5 DEMs have been acquired between late October and early January, de-pending on the study site. Since the SRTM DEM is from mid-February, we chose to correct its elevations to match the time of the year when the SPOT5 DEM was acquired and, thereby, measure glacier mass balance over a full number of years 5
(Berthier et al., 2010; Gardelle et al., 2012a). For Karakoram, we used the win-ter accumulation rate+0.13 m w.e. per month measured on Biafo Glacier (Wake,
1989). For the other study sites, it is derived from the mean of winter mass bal-ances of 35 glaciers in the Northern Hemisphere,+892 mm yr−1w.e. over 2000–
2005 (∼+0.15 m w.e. per winter month), given by Ohmura (2011). The accuracy
10
of this correction is estimated below (Sect. 3.5), but it should be pointed out that the sensitivity of the final mass balance to this correction will tend to decrease as the study period gets longer (Berthier et al., 2010). In our case, this correction will be approximately one to two orders of magnitude lower than a 10-yr cumulative mass balance.
15
3.4 Mean elevation changes and mass balance calculation
Before averaging elevation changes, we exclude all interpolated pixels in the SRTM or SPOT5 DEMs, as well as unexpected elevation changes exceeding±150 m for study
sites that include surge-type glaciers (Pamir and Karakoram) or±80 m for others sites.
Glaciers that are truncated at the edges of the DEM are also excluded from mass bal-20
ance calculations as they may bias the final results, except for Siachen and Fedtchenko glaciers (see below).
Elevation changes are then averaged for 100-m altitude bins, given that they are expected to be similar at a given altitude among a study site. This assumption does not hold in case of the presence of glacier surges within the study site. Thus, for the 25
TCD
7, 975–1028, 2013Region-wide glacier mass balances over
the Pamir-Karakoram-Himalaya
J. Gardelle et al.
Title Page
Abstract Introduction
Conclusions References
Tables Figures
◭ ◮
◭ ◮
Back Close
Full Screen / Esc
Printer-friendly Version
Interactive Discussion
Discussion
P
a
per
|
Dis
cussion
P
a
per
|
Discussion
P
a
per
|
Discussio
n
P
a
per
|
100-m altitude band, excluding elevation differences whose absolute values differ by
more than three standard deviations from the mean (Berthier et al., 2004; Gardner et al., 2012).
Where no elevation change is available for a pixel, we assign to it the value of the mean elevation change of the altitude band it belongs to, in order to assess the 5
mass balance over the whole glacier area. Given the wide coverage of Siachen and Fedtchenko glaciers within the SPOT5 DEMs, we chose to include their small missing parts (empty polygons on the right-hand side of Figs. A5 and 3) in the mass balance calculation of the study site they belong to. Therefore, we use the SRTM hypsometry to determine the altitude of the missing parts and proceed as described above to evaluate 10
their elevation changes.
The conversion of elevation changes to mass balance requires the knowledge of the density of the material that has been lost or gained and its evolution during the study period. As suggested by Huss (2013), we chose to apply a density conversion factor of 850±60 kg m−3for all our study sites, a reasonable assumption given our observation
15
periods of∼10 yr.
The mass balance of each surge-type glacier is computed separately as described above and added (area-weighted) to the mass balance of the rest of the glaciers to estimate the mass balance of the whole study site.
The total mass balance of PKH glaciers, as defined in Sect. 2, is computed by ex-20
trapolating the mass balance from each study site to a wider sub-region (Fig. 1) that is assumed to experience the same glacier changes because of its similar climate. This approach and the selection of sub-regions are backed up by a previous region-wide mass balance assessment (Kääb et al., 2012). The total glacier area for each sub-region is computed from the Randolph Glacier Inventory 2.0 (Arendt et al., 2012). For 25
TCD
7, 975–1028, 2013Region-wide glacier mass balances over
the Pamir-Karakoram-Himalaya
J. Gardelle et al.
Title Page
Abstract Introduction
Conclusions References
Tables Figures
◭ ◮
◭ ◮
Back Close
Full Screen / Esc
Printer-friendly Version
Interactive Discussion
Discussion
P
a
per
|
Dis
cussion
P
a
per
|
Discussion
P
a
per
|
Discussio
n
P
a
per
|
The periods over which we calculate mass balance are slightly different from one
site to another (Table 1) and depend on the year of acquisition of the SPOT5 DEM (one in 2008, two in 2010 and five in 2011). In the following, we will assume that all mass balances are representative of the period 1999–2011, in order to be able to give a region-wide estimate of PKH glacier loss and contribution to sea-level rise over this 5
period.
3.5 Accuracy assessment
The errorE∆hi of a pixel-wise elevation changes∆hi can be evaluated in a formal way, considering the vertical error of±10 m (at 90 %) of the SPOT5 DEM elevations (Korona et al., 2009) and±16 m (at 90 %) on the SRTM DEM elevations (Rabus et al., 2003),
10
which yields to E∆hi =p(102+162)=±18.9 m, i.e. ±11.5 m at a 1-sigma level. This
approach is for example included in the accuracy assessment of elevation changes computed from satellite and map DEMs in Larsen et al. (2007) or Berthier et al. (2010). An alternative accuracy assessment consists in assuming that E∆hi is equal to the standard deviation of elevation differences offglaciers after correcting all biases. For
15
this second approach the accuracy ranges between±6.6 m and ±15.0 m, depending
on the study site (Table 4), values which are consistent with the first approach. Bolch et al. (2011), as well as Kääb et al. (2012), included such off-glacier uncertainties in
their final glacier error budget.
Here, we assumed that the errorE∆hi to be expected for a pixel elevation change 20
∆hi is equal to the standard deviation σ∆h of the mean elevation change ∆h of the altitude band it belongs to. The value of σ∆h can range from±4 to ±20 m depending on the study site and elevation, and tends to increase with altitude and in accumulation areas. This third alternative is rather conservative as the value ofσ∆hcontains also the intrinsic natural variability of elevation changes within the altitude band (i.e. it contains 25
TCD
7, 975–1028, 2013Region-wide glacier mass balances over
the Pamir-Karakoram-Himalaya
J. Gardelle et al.
Title Page
Abstract Introduction
Conclusions References
Tables Figures
◭ ◮
◭ ◮
Back Close
Full Screen / Esc
Printer-friendly Version
Interactive Discussion
Discussion
P
a
per
|
Dis
cussion
P
a
per
|
Discussion
P
a
per
|
Discussio
n
P
a
per
|
The errorE∆hof the mean elevation change∆his then calculated according to stan-dard principles of error propagation:
E∆h= E∆hi
p N
eff
(1)
N
eff represents the number of independent measurements among the altitude band that is considered.N
eff will be lower thanNtot, the total number of elevation changes 5
∆hi measured in a band, since the latter are correlated spatially (Bretherton et al., 1999):
N eff=
Ntot
2d (2)
whered is the distance of spatial autocorrelation, determined using Moran’s I autocor-relation index on elevation differences offglaciers (on the average over the eight study
10
sites,d=492±72 m). For Alaskan glaciers, Berthier et al. (2010) estimated the mean
value ofd at 500 m using mostly 40-m DEMs, while Bolch et al. (2011) chose a value of 600 m using 30-m ASTER DEMs in the Everest area.
The error on the penetration correction is computed in the same way as for the ele-vation differences described above, but based on the elevation differences on glaciers
15
between SRTMC-band and SRTMX-band, instead of the elevation differences between
SRTMC-band and the SPOT DEMs (Gardelle et al., 2012b).
We assume the error on the seasonality correction to be equal to the correction itself (i.e. 100 % error), since this value is derived either from a mean global winter mass balance value based on 35 glaciers in the Northern Hemisphere (Ohmura, 2011) or 20
from a single accumulation rate on Biafo glacier for the Karakoram sites (Wake, 1989). All errors are summed quadratically for each altitude band, and then propagated assuming that altitude bands are 100 % dependent.
During the volume to mass change conversion, we assume an error on the den-sity conversion factor of±60 kg m−3, as suggested by Huss (2013). This±7 % error is
25
TCD
7, 975–1028, 2013Region-wide glacier mass balances over
the Pamir-Karakoram-Himalaya
J. Gardelle et al.
Title Page
Abstract Introduction
Conclusions References
Tables Figures
◭ ◮
◭ ◮
Back Close
Full Screen / Esc
Printer-friendly Version
Interactive Discussion
Discussion
P
a
per
|
Dis
cussion
P
a
per
|
Discussion
P
a
per
|
Discussio
n
P
a
per
|
Finally, for sub-regions and total PKH estimates of mass change, we also include a±15 % error on the glacier area computed from the Randolph Glacier Inventory 2.0. (Arendt et al., 2012). This error is evaluated based on the comparison of our user-defined inventory on each study site with the Randolph Inventory 2.0. (Table 1).
4 Results
5
4.1 Elevation changes in ablation areas
The maps of glacier elevation changes are given in Figs. 2 and 3 for the Hengduan Shan and Pamir study sites where, to our knowledge, no geodetic mass balances have been published previously. Similar maps are shown for other sites in Figs. A1 to A6. Over the Hengduan Shan area, the thinning below the ELA is strong and homoge-10
neous over the glacier tongues, with a mean value of−0.83±0.06 m yr−1 (Fig. 2). In
Bhutan, Everest and West Nepal (Figs. A1 to A3), some glaciers experienced higher thinning rates than others, especially when their front is in contact with a proglacial lake. The mean lowering rates in ablation areas are −0.52±0.08 m yr−1 in Bhutan, −0.57±0.10 m yr−1 in the Everest area and−0.55±0.10 m yr−1 in West Nepal. In the
15
Spiti Lahaul area, glaciers experienced a general and homogeneous thinning over their ablation areas (−0.63±0.05 m yr−1). The Spiti Lahaul map of elevation changes
(Fig. A4) contains however many voids, due to the presence of thin clouds during the acquisition of the SPOT5 DEM.
In Karakoram (east and west, Figs. A5 and A6), as well as in Pamir (Fig. 3), the pat-20
tern of elevation changes is highly heterogeneous and is a consequence of numerous glacier surges or similar flow instabilities in these areas (see Sect. 4.4 and Gardelle et al., 2012a). For non surge-type glaciers, thinning rates in ablation areas are moder-ate in western (−0.30±0.05 m yr−1) and eastern (−0.29±0.04 m yr−1) Karakoram and
null on average in Pamir (+0.01±0.03 m yr−1).
TCD
7, 975–1028, 2013Region-wide glacier mass balances over
the Pamir-Karakoram-Himalaya
J. Gardelle et al.
Title Page
Abstract Introduction
Conclusions References
Tables Figures
◭ ◮
◭ ◮
Back Close
Full Screen / Esc
Printer-friendly Version
Interactive Discussion
Discussion
P
a
per
|
Dis
cussion
P
a
per
|
Discussion
P
a
per
|
Discussio
n
P
a
per
|
4.2 Influence of a debris cover
To evaluate thinning rates over debris-covered and debris-free ice, we perform a his-togram adjustment, in order to compare data sets with similar altitude distributions. This is needed because debris-covered parts tend to be concentrated at lower eleva-tions. The adjustment consists in randomly excluding pixels over debris-free ice from 5
each elevation band, to match a scaled version of the debris-covered pixels distribution (Kääb et al., 2012). The resulting relation of elevation changes with altitude for clean and debris-covered ice is given in Fig. 4 for each study site.
The thinning is higher for debris-covered ice in the Everest area and on the lower-most part of glaciers in Pamir. But on average, in Pamir, western Karakoram and Spiti 10
Lahaul, the lowering of debris-free and debris-covered ice is similar. The thinning is stronger over clean ice in the Hengduan Shan, Bhutan, West Nepal, and, although to a lesser extent, in eastern Karakoram.
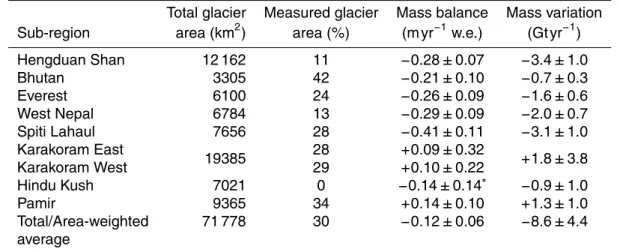
4.3 Mass balance over the 8 study sites
Glacier mass changes are highly heterogeneous over the PKH since 1999. Mass gain 15
is found in the north-west, in Pamir (+0.14±0.10 m yr−1w.e.) and for the two study sites
in central Karakoram (+0.09±0.32 m yr−1 w.e. and+0.10
±0.22 m yr−1w.e.). Glaciers
in all our eastern study sites (Nepal, Bhutan and Hengduan Shan) experienced ho-mogeneous mass losses with mass balances ranging from−0.29±0.09 m yr−1w.e. to −0.21±0.10 m yr−1w.e. The most negative mass balance is measured in Spiti Lahaul
20
(North-West India), at−0.41±0.11 m yr−1w.e. (Table 5).
However, within a study site, mass balances can be highly variable from one glacier to another. In the Everest area, two large glaciers (71 km2each) experienced distinctly different mass balance with −0.18±0.19 m yr−1 w.e. for the south-flowing Ngozumpa
Glacier and−0.65±0.14 m yr−1w.e. for north-flowing Rongbuk Glacier (see their
loca-25
tions on Fig. A2). In Bhutan, mass loss is higher south (−0.25±0.19 m yr−1w.e.) than
TCD
7, 975–1028, 2013Region-wide glacier mass balances over
the Pamir-Karakoram-Himalaya
J. Gardelle et al.
Title Page
Abstract Introduction
Conclusions References
Tables Figures
◭ ◮
◭ ◮
Back Close
Full Screen / Esc
Printer-friendly Version
Interactive Discussion
Discussion
P
a
per
|
Dis
cussion
P
a
per
|
Discussion
P
a
per
|
Discussio
n
P
a
per
|
significant level. Bhutanese glaciers south of the main Himalaya ridge are largely stag-nant or slow flowing, and the north-bound glaciers are dynamically much more active (Kääb, 2005).
The global mass budget of PKH glaciers is negative, −8.6±4.4 Gt yr−1 (−0.12±
0.06 m yr−1 w.e.), which corresponds to a sea level rise contribution of 0.024
±
5
0.012 mm yr−1 over 1999–2011. This is 2 % of the total glacier contribution given by Cogley (2009) over 2001–2005.
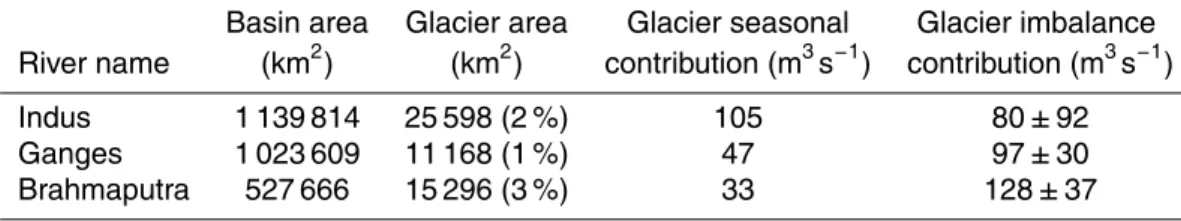
Our method does not allow estimating the seasonal contribution of glaciers to river runoff(Kaser et al., 2010), but only the contribution due to glacier imbalance. For the
three rivers for which we cover the entire glacierized area of their catchments within 10
our sub-regions (Indus, Ganges and Brahmaputra, Fig. 1), these contributions to the river discharge equal to 80, 97 and 128 m3s−1, respectively, for the period 1999–2011. These are estimated by converting mass changes to discharge equivalent and assum-ing only direct river runoffwithout loss terms.
For study sites with a high concentration of growing pro-glacial lakes, such as 15
Bhutan, Everest and West Nepal (Gardelle et al., 2011), mass balance values are likely to be minimum estimates, as they do not take into account the glacier ice that has been replaced by water during the expansion of the lake.
4.4 Glacier surges
In Pamir and Karakoram, the spatial pattern of elevation changes of many glaciers is 20
typical of surge events or flow instabilities. They can be identified because of their very high thinning and thickening rates that can both reach up to 16 m yr−1(Figs. 3, A5 and A6).
Most of them have already been reported to be surge-type glaciers, based on their velocity (Kotlyakov et al., 2008; Quincey et al., 2011; Copland et al., 2009; Heid and 25
TCD
7, 975–1028, 2013Region-wide glacier mass balances over
the Pamir-Karakoram-Himalaya
J. Gardelle et al.
Title Page
Abstract Introduction
Conclusions References
Tables Figures
◭ ◮
◭ ◮
Back Close
Full Screen / Esc
Printer-friendly Version
Interactive Discussion
Discussion
P
a
per
|
Dis
cussion
P
a
per
|
Discussion
P
a
per
|
Discussio
n
P
a
per
|
exhaustive up-to-date surge inventory. This is why the published surge inventories in Pamir and Karakoram do not necessarily match the surge-type glaciers labeled on the elevation change maps (Figs. 3, A5 and A6), as these refer only to our observation period (1999–2011).
The mass balance of surge-type glaciers (respectively non-surge-type glaciers) is 5
+0.20±0.24 m yr−1 w.e. (+0.13±0.07 m yr−1 w.e.) in Pamir, +0.10±0.31 m yr−1 w.e.
(+0.10±0.19 m yr−1 w.e.) in the western Karakoram (Gardelle et al., 2012a) and +0.07±0.39 m yr−1w.e. (+0.09±0.31 m yr−1w.e.) in the eastern Karakoram. The
simi-larity between the numbers for surge-type and non-surge-type glaciers shows that the flow instabilities are internal dynamical processes that seem not to affect much the total
10
mass balance of the glacier over shorter time periods, here over a 10-yr period.
5 Discussion
5.1 SRTM penetration
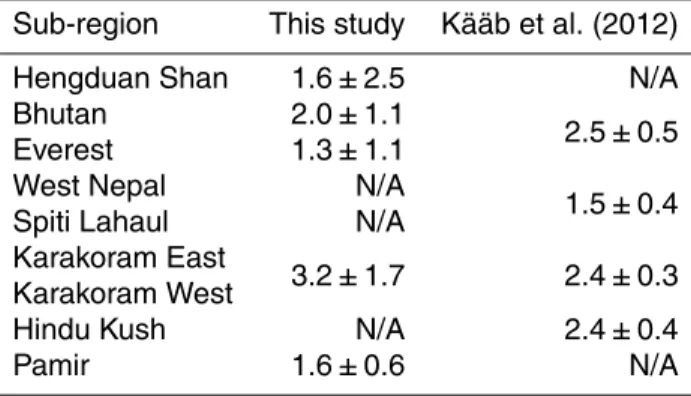
From Table 3, we can notice that the mean SRTMC-band penetration over glaciers is higher in Karakoram, where glaciers are of winter-accumulation type. Snow thickness 15
is indeed expected to be higher in February 2000 (i.e. when the SRTM mission was flown) than in the eastern PKH, where glaciers are of summer-accumulation type.
Other estimates of SRTMC-bandpenetration values for the PKH region were given by Kääb et al. (2012), by comparing elevations of the ICESat altimeter (Zwally et al., 2002) with the SRTMC-band DEM in PKH and extrapolating the 2003–2008 trend of elevation 20
changes back to the acquisition date of SRTM. The difference between east and west
is more distinct in our case, with a mean penetration in Karakoram of 3.2±1.7 m (2.4±
0.3 m in Kääb et al., 2012), 2.0±1.1 m in Bhutan and 1.3±1.1 m around the Everest
area (2.5±0.5 m for a wider area including east Nepal and Bhutan in Kääb et al., 2012).
Both estimates agree within their error bars and seem thus to provide robust first-order 25
TCD
7, 975–1028, 2013Region-wide glacier mass balances over
the Pamir-Karakoram-Himalaya
J. Gardelle et al.
Title Page
Abstract Introduction
Conclusions References
Tables Figures
◭ ◮
◭ ◮
Back Close
Full Screen / Esc
Printer-friendly Version
Interactive Discussion
Discussion
P
a
per
|
Dis
cussion
P
a
per
|
Discussion
P
a
per
|
Discussio
n
P
a
per
|
5.2 Thinning over debris-covered ice
PKH glaciers are heavily debris-covered in their ablation area, because of steep rock walls that surround them, and an intense avalanche activity. They represent about 13 % of the studied glacier area (up to 22 % in the Everest area, Table 1), which is in agree-ment with the estimate of 13 % for Himalaya and Karakoram in Kääb et al. (2012) and 5
slightly larger than the 10 % estimate given by Bolch et al. (2012) for Himalaya and Karakoram. The debris layer is expected to modify the ablation of the underlying ice, by either increasing it if the layer is just a few centimeters thick, or decreasing it if the layer is thick enough to protect the ice from solar radiation as the gain in insulation exceeds then in general the decrease in albedo (Mattson et al., 1993; Mihalcea et al., 10
2006; Benn et al., 2012).
However, recent studies have reported similar thinning rates over debris-covered and debris-free ice in PKH (Kääb et al., 2012; Gardelle et al., 2012a), or even higher lowering rates over debris-covered parts in the Everest area (Nuimura et al., 2012).
Our findings are consistent with Nuimura et al. (2012) for the Everest study site, 15
with a net lowering in debris-covered areas (−0.96 m yr−1) and a reduced thinning over
clean ice (−0.55 m yr−1). In Pamir, Karakoram and Spiti Lahaul these rates are similar, while in West Nepal, Bhutan and Hengduan Shan, lowering is higher over clean ice, in agreement with the commonly assumed protective effect of debris (Fig. 4).
As local glacier thickness changes are a result of both mass balance processes and 20
a dynamic component, these unexpected high thinning rates over debris-covered parts are potentially the result of glacier-wide processes. Over a glacier tongue, the ablation can be enhanced by the presence of steep exposed ice cliffs or supraglacial lakes and
ponds (Sakai et al., 2000, 2002). In addition, ice-flow rates could be very low at debris-covered parts, as shown by Quincey et al. (2007) in the Everest area, Kääb (2005) for 25
TCD
7, 975–1028, 2013Region-wide glacier mass balances over
the Pamir-Karakoram-Himalaya
J. Gardelle et al.
Title Page
Abstract Introduction
Conclusions References
Tables Figures
◭ ◮
◭ ◮
Back Close
Full Screen / Esc
Printer-friendly Version
Interactive Discussion
Discussion
P
a
per
|
Dis
cussion
P
a
per
|
Discussion
P
a
per
|
Discussio
n
P
a
per
|
velocity fields and maps of elevation changes such as ours could allow evaluating more closely the relative role of ablation and ice fluxes in thinning rates over PHK glacier tongues (e.g. Berthier and Vincent, 2012; Nuth et al., 2012).
Note that in the case of debris-covered tongues, the elevation change measurement represents the glacier thickness change but also the possible debris thickness evolu-5
tion. The latter remains poorly known in the PKH or in any other mountain range. But based on the debris discharges given by Bishop et al. (1995) for Batura Glacier (Pak-istan), 48 to 90×103m3yr−1, the thickening of the debris can be estimated between 2.7 and 5.5 mm yr−1, which is negligible given the magnitude of the glacier elevation changes. However, in Everest and West Nepal, some thickening is observed near the 10
glacier fronts for debris-covered parts (Fig. 4). This is likely a consequence of debris accumulation and debris thickening due to insufficient debris evacuation, rather than
thickening of the underlying ice.
5.3 Comparison to previous mass balance studies
Based on repeat ICESat track measurements and the SRTM DEM, Kääb et al. (2012) 15
measured a total mass balance of −0.21±0.05 m yr−1 w.e. between 2003 and 2008
for Hindu Kush-Karakoram-Himalaya glaciers. For that same area (i.e. excluding the Pamir and Hengduan Shan sites), we found a mass balance of −0.13±0.08 m yr−1
w.e. Thus, in total, our result agrees with Kääb et al. (2012) within the error bars, although our study period is longer (1999–2011) and our measurement principle and 20
extrapolation approach is very different. In addition, updated mass balances from Kääb
et al. (2012) (Table A2), i.e. averages over 3×3 degree cells centered over our study
sites, are consistent, within error bars with our mass balance estimates. This confirms the homogeneity hypothesis used during the extrapolation of mass balance results from a study site to a sub-region.
25
At a more local scale, Bolch et al. (2011) reported a mass balance of −0.79±
0.52 m yr−1 w.e. between 2002 and 2007 by DEM differencing, over a glacier area of
TCD
7, 975–1028, 2013Region-wide glacier mass balances over
the Pamir-Karakoram-Himalaya
J. Gardelle et al.
Title Page
Abstract Introduction
Conclusions References
Tables Figures
◭ ◮
◭ ◮
Back Close
Full Screen / Esc
Printer-friendly Version
Interactive Discussion
Discussion
P
a
per
|
Dis
cussion
P
a
per
|
Discussion
P
a
per
|
Discussio
n
P
a
per
|
Nuimura et al. (2012) found a mean mass balance of−0.45±0.60 m yr−1 w.e. for the
period 2000–2008, while they computed a mass balance of−0.40±0.25 m yr−1 w.e.
between 1992 and 2008 over an area of 183 km2 around Mt. Everest. In the present study, we found an average mass balance of −0.43±0.22 m yr−1 w.e. over the ten
glaciers mentioned above (Table A2), and a value of−0.26±0.09 m yr−1 w.e. over the
5
whole Everest study site between 2000–2011. Our values are comparable to Nuimura et al. (2012), while they differ from Bolch et al. (2011) who acknowledged some high
uncertainties for this short time period (Fig. 5). The value of−0.30±0.09 m yr−1 w.e.
found by Kääb et al. (2012) in east Nepal and Bhutan between 2003–2008 is also similar to ours.
10
In Bhutan, our results indicate a stronger mass loss for southern glaciers than for northern ones. Interestingly, in this area, Kääb (2005) measured high speeds (up to 200 m yr−1) for glaciers north of the Himalayan main ridge, and rather low velocities over southern glacier tongues, by using repeat ASTER data. This is consistent with the more negative mass balance that we report for the southern glaciers in Bhutan, i.e. for 15
the dynamically little active, presumably downwasting glaciers.
Berthier et al. (2007) reported a mass balance between−0.69 and−0.85 m yr−1w.e.
for an ice-covered area of 915 km2around Chhota Shigri glacier between 1999 (SRTM DEM) and 2004 (SPOT5-HRG DEM). For the same area, we found a mass balance of−0.41±0.11 m yr−1w.e. over 1999–2011. The difference in the study period explain
20
part of the differences. Also, the methodology by Berthier et al. (2007) did not explicitly
took into account the SRTM radar penetration over glaciers, and also corrected an apparent elevation-dependent bias according to glacier elevations, which is now known as a resolution issue and is best corrected according to the terrain maximum curvature, (Gardelle et al., 2012b). More details and discussions about these differences can be
25
found in the supplementary material of Vincent et al. (2012).
TCD
7, 975–1028, 2013Region-wide glacier mass balances over
the Pamir-Karakoram-Himalaya
J. Gardelle et al.
Title Page
Abstract Introduction
Conclusions References
Tables Figures
◭ ◮
◭ ◮
Back Close
Full Screen / Esc
Printer-friendly Version
Interactive Discussion
Discussion
P
a
per
|
Dis
cussion
P
a
per
|
Discussion
P
a
per
|
Discussio
n
P
a
per
|
of glaciers) where elevation differences agree within 1 m. Both sites show similar mass
balances over slightly different periods: +0.09±0.32 m yr−1 w.e. over 1999–2010 in
the east and+0.10±0.22 m yr−1 w.e. over 1999–2008 in the west. This confirms that,
when large study areas are considered, glacier mass balance are homogeneous in the Karakoram sub-region and that the extrapolation of mass balances to unmeasured ar-5
eas is justified. This also shows that changes are consistent in time on average, since mass balances are similar over 1999–2008 and 1999–2010. In addition, we report a mass balance of+0.07±0.46 m yr−1w.e. for Baltoro Glacier (see location in Fig. A5,
size=304 km2) between 1999 and 2010, which is consistent with its gradual speed-up
reported since 2003 by Quincey et al. (2009). However, given the completely different
10
methods used in our and the latter study, we cannot conclude whether this demon-strates a real shift from negative to positive mass balance. Again, within error bars our Karakoram results agree with the−0.07±0.04 m yr−1 w.e. found by Kääb et al. (2012)
for the entire Karakoram over 2003–2008.
The mass balance of the Hindu Kush study site, computed as the average of the Spiti 15
Lahaul and Pamir values (see Sect. 3.4), is estimated at−0.14±0.08 m yr−1 w.e. This
value agrees reasonably well with the mass budget given by Kääb et al. (2012) over that same area between 2003 and 2008 (−0.20±0.06 m yr−1w.e.), and thus confirms
that our interpolation is plausible. However, since this value is not computed with the same standard procedure as the other study sites, we choose to assign to it a 100 % 20
error, i.e.±0.14 m yr−1w.e.
In Pamir, the mass balance of Abramov Glacier has been measured in the field for 30 yr between 1968 and 1998 (WGMS, 2012), with a mean value of−0.46 m yr−1
w.e. Here, we report a mass balance of−0.04±0.10 m yr−1 w.e. for this glacier over
1999–2011. This nearly balanced mass budget is coherent with the wider budget 25
measured for the first time over the Pamir (+0.14±0.10 m yr−1 w.e.). We also note
TCD
7, 975–1028, 2013Region-wide glacier mass balances over
the Pamir-Karakoram-Himalaya
J. Gardelle et al.
Title Page
Abstract Introduction
Conclusions References
Tables Figures
◭ ◮
◭ ◮
Back Close
Full Screen / Esc
Printer-friendly Version
Interactive Discussion
Discussion
P
a
per
|
Dis
cussion
P
a
per
|
Discussion
P
a
per
|
Discussio
n
P
a
per
|
is located outside of our Pamir study site, it is also in agreement with our remotely-sensed mass balance. Thus the “Karakoram anomaly” should probably be renamed the “Pamir-Karakoram anomaly”, since glacier mass balance is also slightly positive on average in the mountains of Tajikistan.
However, this positive mass balance measured in Pamir seems to contradict previ-5
ous findings by Heid and Kääb (2012). They reported rapidly decreasing glacier speeds in Pamir between two snapshots of annual velocities in 2000/2001 and 2009/2010, an observation that would fit with negative mass balances (Span and Kuhn, 2003; Azam et al., 2012). We note that the relationship between glacier mass balance and ice fluxes is not simple, and might in particular involve a time delay between a change in mass 10
balance and the related dynamic response (Heid and Kääb, 2012). Thus, the decrease in speed could well be due to negative mass balances before or partially before 1999– 2011. We acknowledge, though, that this discrepancy needs to be investigated further, in particular by examining continuous changes in annual glacier speed through the first decade of the 21st century. Note that in (Heid and Kääb, 2012), measurements are 15
based on differences between two annual periods and thus do not necessarily
repre-sent mean decadal changes. This effect could account for the discrepancies between
the observed decrease in glacier speeds and the positive mass balance measured in Pamir.
Jacob et al. (2012), using satellite gravimetry (GRACE), measured a mass budget of 20
−5±6 Gt yr−1 over 2003–2010 for “Karakoram-Himalaya”, their region 8c, which
cor-responds to our study area excluding the Pamir, Karakoram and Hindu Kush sub-regions but including some glaciers north of the Himalayan ridge already on the Ti-betan Plateau. For this subset of our PKH study area, we measured a mass budget of
−10.8±1.7 Gt yr−1. Although our study period is five years longer and our study area is
25
TCD
7, 975–1028, 2013Region-wide glacier mass balances over
the Pamir-Karakoram-Himalaya
J. Gardelle et al.
Title Page
Abstract Introduction
Conclusions References
Tables Figures
◭ ◮
◭ ◮
Back Close
Full Screen / Esc
Printer-friendly Version
Interactive Discussion
Discussion
P
a
per
|
Dis
cussion
P
a
per
|
Discussion
P
a
per
|
Discussio
n
P
a
per
|
models used to remove the hydrological contribution from the gravimetric signal (see Jacob et al. (2012) for more details).
The estimation of Jacob et al. (2012) over our complete study region (PKH), i.e.
−6±8 Gt yr−1 over their region 8b and 8c, also includes mass changes for the Kunlun
Shan sub-region for which we did not measure glacier mass balances. Therefore the 5
comparison with our PHK value (−8.6±4.4 Gt yr−1) is not straightforward but suggest
a reasonable agreement.
The evolution of glacial lakes along the mountain ranges studied (except Pamir and Hengduan Shan) has been investigated between 1990, 2000 and 2009 (Gardelle et al., 2011). The expansion rates of the lakes between 2000 and 2009 were highest in west 10
Nepal, Everest and Bhutan (where 60 % of the lakes are of pro-glacial type), insignifi-cant in Spiti Lahaul and Karakoram (where 80 % of the lakes are of supraglacial type). Since we measured a net glacier mass loss over the Spiti Lahaul and a slight mass gain in Karakoram, we suggest that supraglacial lakes are not appropriate indicators of glacier mass balance, as opposed to proglacial lakes, whose growth is in agreement 15
with the mass loss that we measured over the eastern sites during the last decade. Supraglacial lakes, located on the glacier itself, have a very short lifetime, due to the ice displacement from one year to another (Benn et al., 2001). On the opposite, proglacial lakes are more stable, more likely to store melt water from previous years, and thus better reflect the glacier mass balance on long timescales. In fact, their expansion can 20
be seen as a consequence of a greater surface and aqueous ice melt than ice flux at the glacier front, which also points towards a negative mass balance.
5.4 Origin of the heterogeneous pattern of mass balance
The overall PKH glacier mass balance is negative (−0.12±0.06 m yr−1 w.e.), but
changes are not homogeneous from one sub-region to another and seem to be re-25
TCD
7, 975–1028, 2013Region-wide glacier mass balances over
the Pamir-Karakoram-Himalaya
J. Gardelle et al.
Title Page
Abstract Introduction
Conclusions References
Tables Figures
◭ ◮
◭ ◮
Back Close
Full Screen / Esc
Printer-friendly Version
Interactive Discussion
Discussion
P
a
per
|
Dis
cussion
P
a
per
|
Discussion
P
a
per
|
Discussio
n
P
a
per
|
(∼ −0.25 m yr−1 w.e.). At the west-end of the PKH, in the Pamir and Karakoram sites,
where the climate is mostly driven by the Westerlies in winter, mass balances are slightly positive (∼+0.10 m yr−1w.e.). In between these two influences, the glaciers of
the Spiti Lahaul site, in a monsoon-arid transition zone, experienced a stronger mass loss (−0.41±0.11 m yr−1w.e.).
5
This heterogeneous pattern of mass balances seems to be related to trends in pre-cipitation throughout the PKH. Archer and Fowler (2004) reported an increase in win-ter precipitation over the Upper Indus basin since 1961, recently confirmed by Yao et al. (2012) over Pamir and Karakoram, based on the analysis of the Global Precipita-tion Climatology Project data set (GPCP; Adler, et al., 2003). This precipitaPrecipita-tion increase 10
is a source of greater accumulation for glaciers in these areas and thus a possible ex-planation for their slightly positive mass budget. In addition, in the Upper Indus basin, the mean summer temperature has been decreasing since 1961 (Fowler and Archer, 2006), which is consistent with the findings of Shekhar et al. (2010) in Karakoram, who reported a decrease in both maximum and minimum temperature since 1988. These 15
temperature trends are likely to be responsible for a reduced ablation over Karakoram glaciers and thus consistent with the balanced glacier mass budget.
On the opposite, in the east, the Indian summer monsoon has been weakening since the 1950s (Bollasina et al., 2011), which could have potentially reduced the amount of snowfall over the eastern study sites, and thus resulted in negative mass balances. In 20
addition, maximum and minimum temperature have been reported to increase since 1988 in Western Himalaya (Shekhar et al., 2010), as well as maximum temperatures have been increasing in Central Himalaya (Nepal) since the mid-1970s (Shrestha et al., 1999). Thus both precipitation and temperature trends in Himalaya likely contributed to the negative mass balances measured over the corresponding study sites (Spiti 25
Lahaul, West Nepal, Everest, Bhutan and Hengduan Shan).
TCD
7, 975–1028, 2013Region-wide glacier mass balances over
the Pamir-Karakoram-Himalaya
J. Gardelle et al.
Title Page
Abstract Introduction
Conclusions References
Tables Figures
◭ ◮
◭ ◮
Back Close
Full Screen / Esc
Printer-friendly Version
Interactive Discussion
Discussion
P
a
per
|
Dis
cussion
P
a
per
|
Discussion
P
a
per
|
Discussio
n
P
a
per
|
not captured by reanalysis data, values recently confirmed by Immerzeel et al. (2012). Thus, high-altitude weather stations are truly needed to validate the large scale gridded data set (e.g. reanalysis), test their ability to describe the specific climate nearby PKH glaciers and assess the relative role played by temperature and precipitation changes.
5.5 Contribution to water resources
5
Rivers of PKH represent a major contribution to water resources in the region, and measures of their discharges are therefore highly sensitive and with a restricted ac-cess for political reasons. Papa et al. (2010) built recent time-series of discharges for Ganges and Brahmaputra by using altimetry measurements. The locations of the cor-responding discharge estimates in Bangladesh are given in Fig. 1. We can therefore 10
evaluate the contribution of glacier imbalance (Table 6) to annual river run-offat 0.8 %
for the Ganges at Hardinge (basin area of∼1 020 000 km2) and 0.7 % for Brahmaputra at Bahadurabad (basin area of∼530 000 km2) between 1999 and 2011. Given the
dis-charge measured at the Guddu station (Pakistan, see location of Fig. 1) between 1999 and 2003 (carried out by the Surface Water Hydrology Project of the Water and Power 15
Development Authority), we can estimate the glacier imbalance contribution at 3.7 % for the Indus river.
The seasonal contributions of glaciers to river run-off (i.e. the annual precipitation
that experiences seasonally delayed release from the glaciers) modeled by Kaser et al. (2010) are also given in Table 6. We notice that for the basins under the influence 20
of the Indian summer monsoon (Ganges and Brahmaputra), the glacier imbalance con-tribution is higher than the seasonal concon-tribution. The situation is reversed for the Indus basin, mostly under the influence of the Westerlies, where the glacier ablation season occurs during the drier months of the year. Both contributions are strongly dependent on the location of the discharge measurement and expected to be more important in 25