Uric Acid and the Prediction Models of Tumor
Lysis Syndrome in AML
A. Ahsan Ejaz1*, Negiin Pourafshar1, Rajesh Mohandas1,2, Bryan A. Smallwood3, Richard J. Johnson4, Jack W. Hsu5
1Division of Nephrology, Hypertension and Transplantation, North Florida/South Georgia Veterans Health System, Gainesville, Florida, United States of America,2Nephrology & Hypertension Section, Department of Veterans Affairs Medical Center, North Florida/South Georgia Veterans Health System, Gainesville, Florida, United States of America,3Department of Epidemiology, College of Public Health and Health Professions and the College of Medicine, University of Florida, Gainesville, Florida, United States of America,
4Division of Renal Diseases and Hypertension, University of Colorado Health Sciences Center, Gainesville, Florida, United States of America,5Division of Hematology and Oncology, University of Florida, Gainesville, Florida, United States of America
Abstract
We investigated the ability of serum uric acid (SUA) to predict laboratory tumor lysis syn-drome (LTLS) and compared it to common laboratory variables, cytogenetic profiles, tumor markers and prediction models in acute myeloid leukemia patients. In this retrospective study patients were risk-stratified for LTLS based on SUA cut-off values and the discrimina-tion ability was compared to current predicdiscrimina-tion models. The incidences of LTLS were 17.8%, 21% and 62.5% in the low, intermediate and high-risk groups, respectively. SUA was an independent predictor of LTLS (adjusted OR 1.12, CI95% 1.0–1.3, p = 0.048). The
discriminatory ability of SUA, per ROC curves, to predict LTLS was superior to LDH, cyto-genetic profile, tumor markers and the combined model but not to WBC (AUCWBC 0.679). However, in comparisons between high-risk SUA and high-risk WBC, SUA had superior dis-criminatory capability than WBC (AUCSUA 0.664 vs. AUCWBC 0.520; p<0.001). SUA also demonstrated better performance than the prediction models (high-risk SUAAUC 0.695, p<0.001). In direct comparison of high-risk groups, SUA again demonstrated superi-or perfsuperi-ormance than the prediction models (high-risk SUAAUC 0.668, p = 0.001) in predict-ing LTLS, approachpredict-ing that of the combined model (AUC 0.685, p<0.001). In conclusion, SUA alone is comparable and highly predictive for LTLS than other prediction models.
Introduction
Tumor lysis syndrome (TLS) is a medical emergency, a consequence of cell lysis and the rapid release of intracellular contents into the blood stream and the potential for subsequent multiple organ damage leading to renal failure, cardiac arrhythmia, pulmonary edema and death. TLS, once reserved for high-bulk chemosensitive tumors, is increasingly being diagnosed in nontra-ditional settings due to the introduction of omnipotent drugs in clinical practice. Therefore,
OPEN ACCESS
Citation:Ejaz AA, Pourafshar N, Mohandas R, Smallwood BA, Johnson RJ, Hsu JW (2015) Uric Acid and the Prediction Models of Tumor Lysis Syndrome in AML. PLoS ONE 10(3): e0119497. doi:10.1371/journal.pone.0119497
Academic Editor:Gotthard Kunze, IPK, GERMANY
Received:September 26, 2014
Accepted:January 28, 2015
Published:March 16, 2015
Copyright:© 2015 Ejaz et al. This is an open access article distributed under the terms of theCreative Commons Attribution License, which permits unrestricted use, distribution, and reproduction in any medium, provided the original author and source are credited.
Data Availability Statement:All relevant data are within the paper. We are also able to provide a minimal anonymized raw dataset upon request to corresponding author.
Funding:The authors have no support or funding to report.
prediction of TLS and institution of prophylactic and therapeutic options are paramount to the favorable clinical outcomes for patients undergoing cancer treatment. The current prediction models of laboratory TLS (LTLS) in acute myeloid leukemia (AML) are based on white blood cell count (WBC), with or without lactate dehydrogenase (LDH), and specific cytogenetic ab-normalities and karyotype complexity. None of the prediction models include serum uric acid (SUA). Recent experimental and clinical studies have demonstrated that SUA has prooxidative and pro-inflammatory properties via crystal dependent and independent mechanisms [1–2]. We have also demonstrated that SUA is an independent predictor of acute kidney injury (AKI) [3]. Given our findings, we wanted to investigate the discrimination ability of baseline SUA to predict TLS and also to compare it to the conventional prediction models.
Materials and Methods
In this retrospective analysis, 183 consecutive patients with diagnosis of AML were identified from an oncology database at the University of Florida between 2000 and 2012. Data on patient demographics, comorbidities, tumor characteristics, cytogenetic abnormalities, gene muta-tions, tumor markers, laboratory parameters, prophylaxis and treatment regimen, length of hospital stay (LOS), and incidences of AKI and LTLS were extracted from electronic medical records for analyses.
WediagnosedLTLS based on the Cairo-Bishop definition of LTLS [4]. LTLS was considered present if levels of two or more serum values of the following were abnormal at presentation (as specified below) or if they changed by 25% within 3 days before until 7 days after cytotoxic therapy: SUA8 mg/dL (476mol/L) or 25% increase from baseline; potassium (K)6mg/dL (6.0 mmol/L) or 25% increase from baseline; phosphate (Phos)4.5mg/dL (1.45 mmol/L) or 25% increase from baseline; albumin corrected calcium (Ca)7mg/dL (1.75mmol/L) or 25% decrease from baseline, with two markers being abnormal within a 24-hour period. SUA was not included if urate oxidase was administered within previous 24 hours. Clinical TLS was de-fined as evidence of LTLS plus one or more of serum creatinine (SCreat>1.5 x upper limits of
normal), cardiac arrhythmia, seizure or sudden death. Acute kidney injury (AKI) was defined as an abrupt (within 48 hours) reduction in kidney function, defined as an absolute increase in serum creatinine0.3 mg/dl (26.4 mmol/L), a percentage increase in SCreat50% (1.5-fold from baseline in accordance with criteria established by the Acute Kidney Injury Network (AKIN) [5].
Predictionmodels of LTLS in AML utilized in the analyses included the Cairo (N.B., not synonymous with the Cairo-Bishop diagnostic criteria for LTLS referenced previously) [6], Surrey, West Sussex and Hampshire Cancer Network NHS [7] and Cancer and Leukemia Group B (CALGB) [8] and the proposed SUA criteria based on our previous findings in AKI [3]. The Cairo, NHS and the CALGB do not include SUA in their prediction models. The Cairo prediction model of LTLS in AML was developed by an international consensus expert panel and classifies patients according to WBC and LDH levels into low (WBC<25x109/L and
LDH<2x upper limits of normal), intermediate (WBC25x109/L and LDH2x upper limits of normal) and high (WBC100x109/L) risk. The NHS model classifies AML based only on WBC but with lower cutoff values: low, WBC<10x109/L; intermediate, WBC 10–50x109/L;
and high risks, WBC50x109/L. It does not include LDH. CALGB classifies patients into fa-vorable, intermediate and adverse groups based on remission outcomes for specific cytogenetic abnormalities and karyotype complexity. SUA criteria is based on our prior studies where SUA
>5.5mg/dL was associated with a four-fold, SUA>6mg/dL with a six-fold, SUA>6.5mg/dL
with an eight-fold SUA>7mg/dL with a forty-fold increased risk for AKI [3]. Accordingly,
pa-tients are classified as low (SUA<5.5mg/dL), intermediate (SUA>5.5mg/dL and<7mg/dL) diabetic renal disease. He also has shares with
and high (SUA7mg/dL) risk for LTLS. SUA refers to baseline (pretreatment) values unless otherwise indicated. Waiver of consent approval for this retrospective analysis was obtained from the University of Florida Institutional Review Board. Only adult patients' data were in-cluded for analysis. Patient records/information was anonymized and de-identified prior to analysis.
Statistical methods
Baseline patient characteristics are presented as mean ± SEM. Univariate logistic regression analysis was performed to determine the association of the known risk factors and incidence of LTLS, and also of pretreatment SUA and LTLS. The risk factors for LTLS included: age>60
years, primary vs. secondary AML, French-American-British (FAB) classification of subtypes, WBC, SCreat, markers on the leukemia cells, chromosome abnormalities, gene mutations, and prophylaxis and treatment protocols. These predictors were included in a multinomial logistic regression model to identify their independent effect on LTLS. We actively selected not to ex-clude any of the risk factors based on the known association with LTLS described previously and the risk of negative confounding. We also performed analysis that included only the vari-ables that were significant in the unadjusted model. The strength of the association of each var-iable with LTLS was summarized by calculating an odds ratio (OR) and a corresponding 95% CI from the coefficients were estimated in the logistic regression models. Receiver-operating characteristic (ROC) curves were used to determine overall accuracy, as measured by area under the curve (AUC), to compare the ability of the different prediction models to predict LTLS. Statistical analyses were performed using SPSS, version 18.
Results
Baseline patient characteristics
Incidences and risks of TLS
The incidence of LTLS in the full study cohort was 26.4% and that of clinical TLS (CTLS) was 5.4%. The incidence of CTLS was 7.1% when the more sensitive AKIN [5] definition was used instead of the criteria for AKI (>1.5x base SCreat) used in Cairo-Bishop definition of CTLS
[4]. The incidence of LTLS and CTLS in patients with primary AML was 26.8% and 1.4%, re-spectively. The incidences of LTLS in the traditional high risk groups were as follows: age>60
years 28.8%, primary AML 26.8%, secondary AML 25%; WBC>100x109/L 50%, LDH >2xULN 21.6%, CD34+leukemias 16.3%, NPMI 27.2% and FLT3 gene mutation 33.3%.
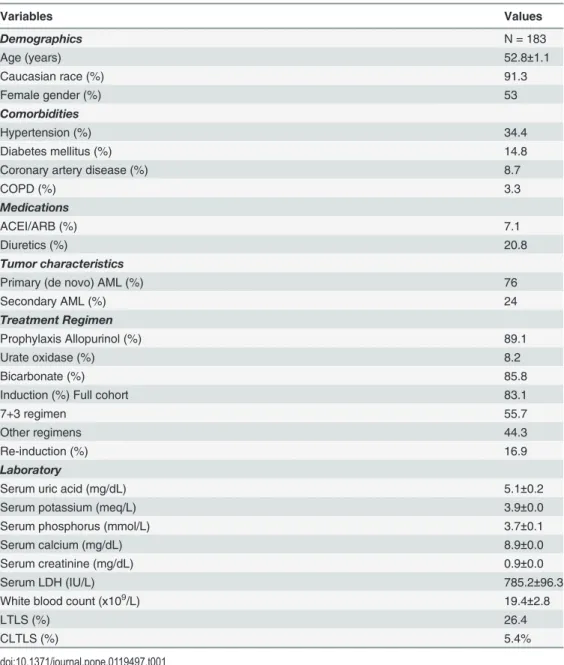
Sig-nificant effect of prophylactic sodium bicarbonate therapy on the incidence of LTLS could not be demonstrated (bicarbonate 24.8% vs. no bicarbonate 36%, p = 0.327). Analysis by prediction models yielded the following incidences of LTLS in each subgroups: Cairo, low-risk 31.4%, Table 1. Baseline patient characteristics.
Variables Values
Demographics N = 183
Age (years) 52.8±1.1
Caucasian race (%) 91.3
Female gender (%) 53
Comorbidities
Hypertension (%) 34.4
Diabetes mellitus (%) 14.8
Coronary artery disease (%) 8.7
COPD (%) 3.3
Medications
ACEI/ARB (%) 7.1
Diuretics (%) 20.8
Tumor characteristics
Primary (de novo) AML (%) 76
Secondary AML (%) 24
Treatment Regimen
Prophylaxis Allopurinol (%) 89.1
Urate oxidase (%) 8.2
Bicarbonate (%) 85.8
Induction (%) Full cohort 83.1
7+3 regimen 55.7
Other regimens 44.3
Re-induction (%) 16.9
Laboratory
Serum uric acid (mg/dL) 5.1±0.2
Serum potassium (meq/L) 3.9±0.0
Serum phosphorus (mmol/L) 3.7±0.1
Serum calcium (mg/dL) 8.9±0.0
Serum creatinine (mg/dL) 0.9±0.0
Serum LDH (IU/L) 785.2±96.3
White blood count (x109/L) 19.4±2.8
LTLS (%) 26.4
CLTLS (%) 5.4%
intermediate-risk 22.8% and high-risk 50%; NHS, low-risk 22.9%, intermediate-risk 26.2% and high-risk 32.6%; and CALGB, adverse 18.7%, intermediate 25.3% and favorable 44%. The SUA prediction model subgroups were associated with a 17.8% (low-risk), 21% (intermediate-risk) and 62.5% (high-risk) incidence of LTLS. Interestingly, we estimated that the incidence of LTLS would have been 17.4% if the definition of LTLS included only K, Phos and Ca but not SUA (LTLSmodified).
The odds ratios (OR) were determined for the previously mentioned risk factors to predict LTLS. In the unadjusted model, CALGB favorable status, CD34 and pretreatment SUA (full co-hort, low and high risk groups) were significant predictors of LTLS(Table 3).In the adjusted model, we actively selected not to exclude any of the risk factors based on the known associa-tion with LTLS described previously and the risk of negative confounding. In this model CD34 was the only significant predictor of LTLS (OR 0.3, CI95%0.1–0.6, p = 0.001). When we
includ-ed only the variables that were significant in the unadjustinclud-ed model, CALGB favorable status (OR 2.7, CI95% 1.1–6.5, p = 031), baseline SUA (OR 1.12, CI95%1.0–1.3, p = 0.048) and SUA
high-risk group (OR 6.6, CI95%2.4–17.9, p<0.001) were significant predictors of LTLS.
Interestingly, we observed significant negative correlations between delta pre-post-treat-ment SUA and the incidence of LTLS (r =−0.32, p<0.001) and post-treatment peak K
concen-trations (r =−0.15, p = 0.042). To further investigate the effect of SUA on LTLS we
subsequently restricted the analysis to patients with post-treatment increase in SUA (delta SUA) and used the definition of LTLSmodifieddiscussed previously. Delta SUA was associated
with a 1.4-fold increased risk for LTLSmodified(OR 1.43, CI95% 1.1–1.99, p = 0.032). In an
ad-justed model that included the previously referenced risk factors, SCreat (OR 3.1, CI95%1.3–
7.2, p = 0.009) and high-risk SUA group were significant predictors of LTLSmodified.(OR 2.8,
CI95%1.1–7.1, p = 0.033).
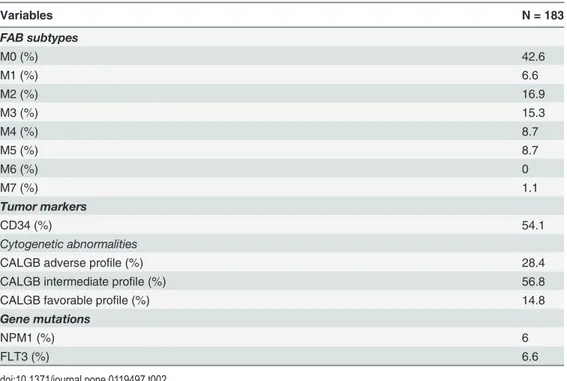
Table 2. AML subtypes, tumor markers and cytogenetic abnormalities.
Variables N = 183
FAB subtypes
M0 (%) 42.6
M1 (%) 6.6
M2 (%) 16.9
M3 (%) 15.3
M4 (%) 8.7
M5 (%) 8.7
M6 (%) 0
M7 (%) 1.1
Tumor markers
CD34 (%) 54.1
Cytogenetic abnormalities
CALGB adverse profile (%) 28.4
CALGB intermediate profile (%) 56.8
CALGB favorable profile (%) 14.8
Gene mutations
NPM1 (%) 6
FLT3 (%) 6.6
Incidence and risk of AKI
The incidence of AKI was 11.5% and 2.2% of the full cohort required dialysis therapy. Age>60
years was associated with the highest incidence of AKI (21.2%), followed by WBC>100x109/L
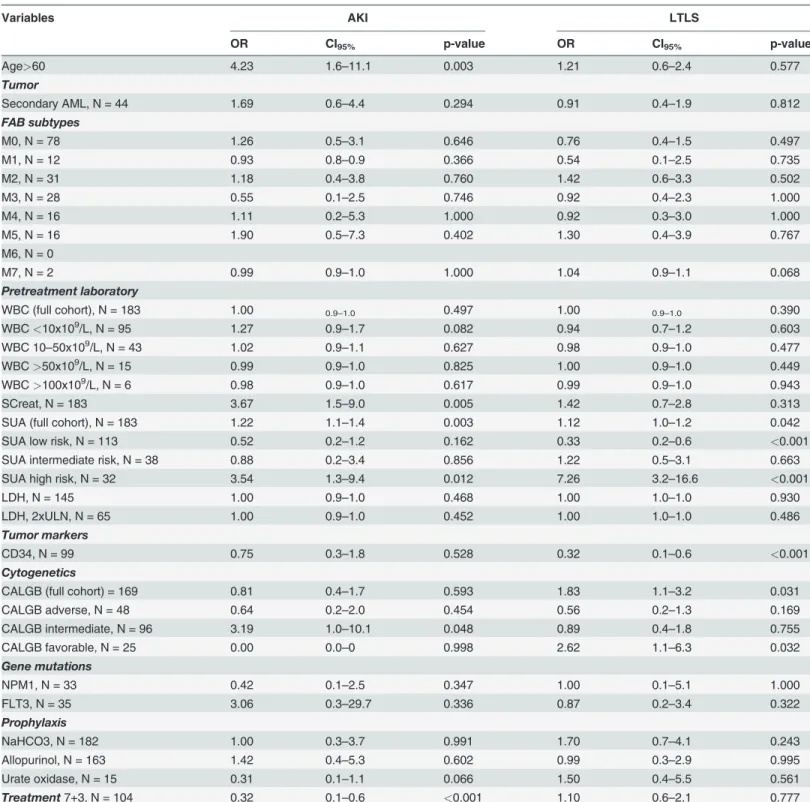
Table 3. Univariate analysis of risk factors for AKI and LTLS.
Variables AKI LTLS
OR CI95% p-value OR CI95% p-value
Age>60 4.23 1.6–11.1 0.003 1.21 0.6–2.4 0.577
Tumor
Secondary AML, N = 44 1.69 0.6–4.4 0.294 0.91 0.4–1.9 0.812
FAB subtypes
M0, N = 78 1.26 0.5–3.1 0.646 0.76 0.4–1.5 0.497
M1, N = 12 0.93 0.8–0.9 0.366 0.54 0.1–2.5 0.735
M2, N = 31 1.18 0.4–3.8 0.760 1.42 0.6–3.3 0.502
M3, N = 28 0.55 0.1–2.5 0.746 0.92 0.4–2.3 1.000
M4, N = 16 1.11 0.2–5.3 1.000 0.92 0.3–3.0 1.000
M5, N = 16 1.90 0.5–7.3 0.402 1.30 0.4–3.9 0.767
M6, N = 0
M7, N = 2 0.99 0.9–1.0 1.000 1.04 0.9–1.1 0.068
Pretreatment laboratory
WBC (full cohort), N = 183 1.00 0.9–1.0 0.497 1.00 0.9–1.0 0.390
WBC<10x109/L, N = 95 1.27 0.9–1.7 0.082 0.94 0.7–1.2 0.603
WBC 10–50x109/L, N = 43 1.02 0.9–1.1 0.627 0.98 0.9–1.0 0.477
WBC>50x109/L, N = 15 0.99 0.9–1.0 0.825 1.00 0.9–1.0 0.449
WBC>100x109/L, N = 6 0.98 0.9–1.0 0.617 0.99 0.9–1.0 0.943
SCreat, N = 183 3.67 1.5–9.0 0.005 1.42 0.7–2.8 0.313
SUA (full cohort), N = 183 1.22 1.1–1.4 0.003 1.12 1.0–1.2 0.042
SUA low risk, N = 113 0.52 0.2–1.2 0.162 0.33 0.2–0.6 <0.001
SUA intermediate risk, N = 38 0.88 0.2–3.4 0.856 1.22 0.5–3.1 0.663
SUA high risk, N = 32 3.54 1.3–9.4 0.012 7.26 3.2–16.6 <0.001
LDH, N = 145 1.00 0.9–1.0 0.468 1.00 1.0–1.0 0.930
LDH, 2xULN, N = 65 1.00 0.9–1.0 0.452 1.00 1.0–1.0 0.486
Tumor markers
CD34, N = 99 0.75 0.3–1.8 0.528 0.32 0.1–0.6 <0.001
Cytogenetics
CALGB (full cohort) = 169 0.81 0.4–1.7 0.593 1.83 1.1–3.2 0.031
CALGB adverse, N = 48 0.64 0.2–2.0 0.454 0.56 0.2–1.3 0.169
CALGB intermediate, N = 96 3.19 1.0–10.1 0.048 0.89 0.4–1.8 0.755
CALGB favorable, N = 25 0.00 0.0–0 0.998 2.62 1.1–6.3 0.032
Gene mutations
NPM1, N = 33 0.42 0.1–2.5 0.347 1.00 0.1–5.1 1.000
FLT3, N = 35 3.06 0.3–29.7 0.336 0.87 0.2–3.4 0.322
Prophylaxis
NaHCO3, N = 182 1.00 0.3–3.7 0.991 1.70 0.7–4.1 0.243
Allopurinol, N = 163 1.42 0.4–5.3 0.602 0.99 0.3–2.9 0.995
Urate oxidase, N = 15 0.31 0.1–1.1 0.066 1.50 0.4–5.5 0.561
Treatment7+3, N = 104 0.32 0.1–0.6 <0.001 1.10 0.6–2.1 0.777
(16.6%), diagnosis of secondary AML (15.9%) and LDH 2x upper limits of normal (11.6%). Benefi-cial effects of prophylactic sodium bicarbonate therapy on the incidence of AKI could not be dem-onstrated (p = 1.000). We also determined the unadjusted ORs for AKI. Age>60 years,
pretreatment SCreat, SUA (full cohort and high risk group) and 7+3 treatment regimen were sig-nificant predictors of AKI. In the adjusted model, age>60 years (OR 3.44, CI95%1.1 = 11.1, p =
0.040), pretreatment SCreat (OR 2.7, CI95%1.1–6.9, p = 0.035), CALGB intermediate status (OR
4.6, CI95%1.2–17.7, p = 0.024) and SUA (OR 1.3, CI95%1.1–1.5, p = 0.012) were significant
predic-tors of AKI. We observed significant correlations between SUA and post-treatment peak SCreat in the high-risk groups of the prediction models investigated (Cairo, R2: 0.996 and CALGB, R2: 0.509). AKI was also associated with a four-fold (unadjusted OR 4.63, CI95% 1.8–11.8, p = 0.002; adjusted OR 3.97, CI95%1.5–10.5, p = 0.006) increased risk for LTLS adjusted for SUA.
Comparison of combination pairs of SUA, K, Phos and Ca in the
diagnosis of LTLS
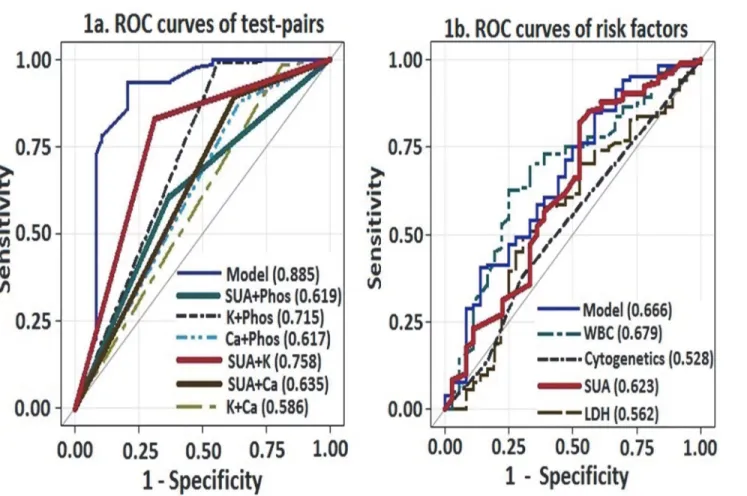
The frequency of abnormal laboratory values were: SUA 27%, K 18%, Phos 47.5% and Ca 10.3%. The frequency of abnormal test-pairs for the diagnosis of LTLS was as follows: SUA-Phos 44.8%, SUA-K 30.6%, SUA-Ca 17.6%, K-SUA-Phos 12%, K-Ca 6% and SUA-Phos-Ca 18%. Since the Cairo-Bishop criteria for the diagnosis of LTLS is based on the change in levels of two or more serum values of SUA, K, Phos or Ca, we compared the diagnostic utility of the combina-tion test-pairs of these variables using ROC curves(Fig. 1A).The combination pair of SUA-K
Fig 1. Comparison of ROC curves to predict LTLS: a) Test-pairs and b) Risk factors (cytogenetics, WBC, LDH and SUA).
had the best diagnostic performance, followed by K-Phos and SUA-Ca. The“model”curve dis-plays the diagnostic performance when all the variables are included in the analysis.
Comparison of prediction models of LTLS
We investigated the discriminatory ability of clinically important risk factors of LTLS by using AUC of the ROC curves(Fig. 1B). The discriminatory ability of SUA was superior to LDH, cy-togenetic profile, tumor markers and the combined model but not to WBC (AUCWBC0.679).
However in comparisons between high-risk SUA and high-risk WBC, SUA had superior dis-tinguishing capability (AUCSUA0.664 vs. AUCWBC0.520; p<0.001) to predict LTLS. We also
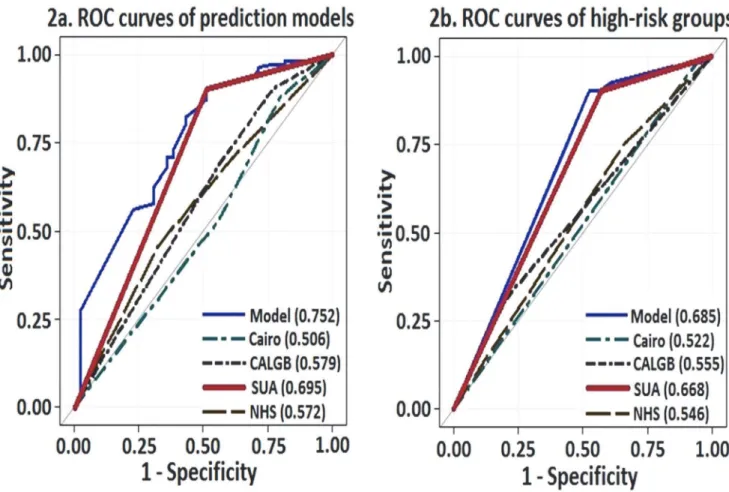
compared the three prediction models described previously with SUA. We elected to include only the high-risk SUA group for comparison rather than the full SUA cohort due to the known properties of SUA to act both as an antioxidant and a pro-oxidant agent depending on its serum concentration, cellular location, and milieu. SUA demonstrated better performance than the prediction models (AUChigh-risk SUA0.695, p<0.001;Fig. 2A). In direct comparison of
high-risk groups of each prediction model, SUA again demonstrated superior performance than the prediction models (AUChigh-risk SUA0.668, p = 0.001) in predicting LTLS,
approach-ing that of the combined model (AUC 0.685, p<0.001;Fig. 2B).
Length of stay and mortality
The mean LOS was 32.2±2.7 days (median 27 days). In patients with CD34+ or NPM1 or FLT3 gene mutations, the mean LOS was 33.8±3.6 days, 59.6±28.3 days and 60.0±25.7 days, re-spectively. The mean LOS according to the different prediction models were as follows: Cairo, low-risk 30.2±2.1 days, intermediate-risk 36.4±9.2 days and high-risk 41.5±8.5 days; NHS, low-risk 35.7±5.2 days, intermediate-risk 30.9±3.2 days and high-risk 33.4±6.8 days; CALGB, adverse 32.7±5.7 days, intermediate 32.9±4.7 days and favorable 33.9±3.6 days; and SUA, low-risk 36.5±4.2 days, intermediate-low-risk 25.8±2.2 days and high-low-risk 24.8±2.5 days. However, there were no significant correlations between LOS and the prediction models.
The overall all-cause mortality was 17.5% during the hospital stay. Patients who died be-longed to the following groups per prediction model utilized: Cairo, low-risk 34.4%, intermedi-ate-risk 28.1% and high-risk 3.1%; NHS, low-risk 34.4%, intermediintermedi-ate-risk 15.6% and high-risk 37.5%; CALGB, adverse 31.3%, intermediate 56.3% and favorable 3.1%; and SUA, low-risk 59.4%, intermediate-risk 28.1% and high-risk 12.5%. CD34+ and NPM1 and FLT3 gene muta-tions were present in 50%, 21.9% and 25% of the deceased, respectively. There were no signifi-cant correlations between mortality and the prediction models.
Discussion
SUA is a catabolic product of nucleic acid, large amount of which is released into the circula-tion following spontaneous or treatment-induced lysis of tumor cells in AML. In this study we investigated the ability of pretreatment SUA to predict LTLS and directly compared its dis-crimination capacity to commonly utilized laboratory values, cytogenetic profiles, tumor mark-ers and existing prediction models of LTLS in patients with AML. The major finding was that SUA had comparable predictive value as conventional prediction models and the combined model. SUA was associated with a significantly increased risk for LTLS and the effect size was six-fold higher in the high-risk group. Similar results have been reported wherein SUA
>7.5mg/dL was associated with a 5.7-fold (CI95%2.6–12.7) increased risk for LTLS when
com-pared to SUA<7.5mg/dL [9]. Our study differs from the previous study in that we utilized
pro-inflammatory properties at concentrations>5.5mg/dL [3,10–11]. Indeed, we demonstrated a
progressively increased risk for LTLS and AKI respectively with higher SUA levels. In the direct comparison of risk factors of LTLS using ROC curves, SUA demonstrated superior perfor-mance to cytogenetic profile and LDH concentrations, but not to WBC. However, in high-risk groups, SUA was superior to WBC in predicting LTLS. The high-risk SUA group also demon-strated superior predictive performance than the Cairo, CALGB and NHS prediction models.
The CALGB favorable group was associated with a higher risk for LTLS compared to the in-termediate and adverse groups, a reflection possibly of the greater chemo-responsiveness of the tumor cells. Although there were no significant correlations between LOS or mortality and pre-diction models, the observed trend towards decreased mortality in the CALGB favorable group is interesting since cytogenetics have been reported to be prognostic only in newly diagnosed AML patients. SUA was significantly correlated with post-treatment peak SCreat values in the high-risk groups of the prediction models. Similar relationships between SUA and SCreat have been demonstrated in cardiac surgery patients where crystal-dependent renal injury is not the predominant phenomenon [3,12]. These findings are clinically relevant considering the rela-tionship between acute and chronic kidney diseases and the progression to end stage disease states [13].
Other important findings include the low incidence of CTLS and the relatively higher than expected incidence of LTLS than the previous report of 12% [9]. The development of CTLS has been reported to impact higher mortality rates from induction therapy in AML [9]. Another Fig 2. ROC curves of a) Prediction models (CALGB, Cairo, NHS and SUA) and b) High-risk groups of the prediction models.
observation is the much lower than expected frequency of laboratory abnormalities compared to previous reports of 60–70% for SUA, K and Phos [9]. Although the diagnosis of LTLS is based on laboratory test-pair abnormalities, little data exist regarding their frequency. To that regard we provide data that SUA-containing test-pairs (SUA-K and SUA-Phos) were the most frequent laboratory abnormalities and also among the better performing diagnostic test-pairs (SUA-K, SUA-Ca, SUA-Phos).
Our observations also emphasize the emerging role of SUA in TLS via crystal-dependent and crystal-independent mechanisms [1–2,14]. Johnson et al have demonstrated in animal models that hyperuricemia in concentrations that do not result in crystal formation, causes renal vasoconstriction by activating the renin-angiotensin system, decreasing nitric oxide bio-availability, oxidant generation, upregulation of inflammatory mediators, proliferation of vas-cular muscle cells and inhibition of angiogemesis [15–17]. This resulted in a 40–60% decrease in renal blood flow and a 40–50% decrease in glomerular filtration rate (GFR) [10–11]. Lower-ing SUA with recombinant urate oxidase attenuated renal parenchymal damage [18]. There-fore, it is tempting to speculate that the observed negative correlations with changes in SUA and K concentrations and decrease in the incidence of LTLS were secondary to attenuated renal vasoconstriction and blunted decrease in renal blood flow and GFR from the lowering of SUA.
The strength of the current study is the direct comparison of laboratory values, cytogenetic profiles, tumor markers and prediction models of LTLS in a complex disease entity with rela-tively good sample size. Despite the inherent limitations of a retrospective analysis, the study provides ample evidence that SUA alone is relatively comparable and highly predictive for LTLS than the other prediction models. Each 1mg/dl increase in SUA was also associated with a 30% increased risk for AKI. AKI causes interruptions in therapy and substantially increases mortality in patients with cancer [19]. Therefore, it is critically important to accurately identify individuals who are at risk for LTLS and AKI. SUA alone is relatively comparable and highly predictive for LTLS than other expensive models that includes tumor markers and
cytogenetic profiles.
Author Contributions
Conceived and designed the experiments: AAE JWH. Analyzed the data: AAE RM BAS RJJ JWH. Wrote the paper: AAE NP RM BAS RJJ JWH. Provision of study materials or patients: JWH AAE. Collection and assembly of data: NP AAE JWH.
References
1. Ejaz AA, Mu W, Kang DH, Roncal C, Sautin YY, Henderson G, et al. Could uric acid have a role in acute renal failure? Clin J Am Soc Nephrol. 2007; 2:16–21. PMID:17699382
2. Shimada M, Johnson RJ, May WS Jr, Lingegowda V, Sood P, Nakagawa T, et al. A novel role for uric acid in acute kidney injury associated with tumour lysis syndrome. Nephrol Dial Transplant. 2009; 24:2960–2964. doi:10.1093/ndt/gfp330PMID:19581334
3. Lapsia V, Johnson RJ, Dass B, Shimada M, Kambhampati G, Ejaz NI, et al. Elevated uric acid in-creases the risk for acute kidney injury. Am J Med. 2012; 125:302.e9–17. doi:10.1016/j.amjmed.2011. 06.021PMID:22340933
4. Cairo MS, Bishop M. Tumour lysis syndrome: new therapeutic strategies and classification. Br J Hae-matol. 2004; 127:3–11. PMID:15384972
5. Mehta RL, Kellum JA, Shah SV, Molitoris BA, Ronco C, Warnock DG, et al. Acute Kidney Injury Net-work. 8. Acute Kidney Injury Network: report of an initiative to improve outcomes in acute kidney injury. Crit Care. 2007; 11:R31. PMID:17331245
expert TLS panel consensus. Br J Haematol. 2010; 149:578–586. doi:10.1111/j.1365-2141.2010. 08143.xPMID:20331465
7. Surrey, West Sussex and Hampshire Cancer Network NHS. Guidelines for the management of tumour lysis syndrome. http://www.royalsurrey.nhs.uk/Default.aspx?DN=45ce893f-8494-413f-9dc6-b3c7a6e21a51. Last accessed July 27, 2014.
8. Byrd JC, Mrózek K, Dodge RK, Carroll AJ, Edwards CG, Arthur DC, et al. Pretreatment cytogenetic ab-normalities are predictive of induction success, cumulative incidence of relapse, and overall survival in adult patients with de novo acute myeloid leukemia: results from Cancer and Leukemia Group B (CALGB 8461). Blood. 2002; 100:4325–4336. PMID:12393746
9. Montesinos P, Lorenzo I, Martín G, Sanz J, Perez-Silvent ML, Martinez D, et al. Tumor lysis syndrome in patients with acute myeloid leukemia: identification of risk factors and development of a predictive model. Haematologica. 2008; 93:67–74. doi:10.3324/haematol.11575PMID:18166787
10. Sánchez-Lozada LG, Tapia E, Santamaría J, Avila-Casado C, Soto V, Nepomuceno T, et al. Mild hy-peruricemia induces vasoconstriction and maintains glomerular hypertension in normal and remnant kidney rats. Kidney Int. 2005; 67:237–247. PMID:15610247
11. Sanchez-Lozada LG, Tapia E, Lopez-Molina R, Nepomuceno T, Soto V, Avila-Casado C, et al. Effects of acute and chronic L-arginine treatment in experimental hyperuricemia. Am J Physiol Renal Physiol 2007; 292: F1238–F1244. PMID:17190912
12. Ejaz AA, Beaver TM, Shimada M, Sood P, Lingegowda V, Schold JD, et al. Uric acid: a novel risk factor for acute kidney injury in high-risk cardiac surgery patients? Am J Nephrol. 2009; 30:425–429. doi:10. 1159/000238824PMID:19752530
13. Chawla LS, Eggers PW, Star RA, Kimmel PL. Acute kidney injury and chronic kidney disease as inter-connected syndromes. N Engl J Med. 2014; 371:58–66. doi:10.1056/NEJMra1214243PMID: 24988558
14. Shimada M, Dass B, Ejaz AA. Paradigm shift in the role of uric acid in acute kidney injury. Semin Nephrol. 2011; 31:453–458. doi:10.1016/j.semnephrol.2011.08.010PMID:22000653
15. Khosla UM, Zharikov S, Finch JL, Nakagawa T, Roncal C, Mu W, et al. Hyperuricemia induces endo-thelial dysfunction. Kidney Int. 2005; 67: 739–1742.
16. Kang DH, Park SK, Lee IK, Johnson RJ. Uric acid induced C-reactive protein (CRP) expression: impli-cation on cell proliferation, and nitric oxide production in human vascular cells. J Am Soc Nephrol. 2005; 16:3553–3562. PMID:16251237
17. Feig DI, Nakagawa T, Karumanchi SA, Oliver JW, Kang DH, Finch J, et al. Hypothesis: uric acid, neph-ron number, and the pathogenesis of essential hypertension. Kidney Int. 2004; 66:281–287. PMID: 15200435
18. Roncal CA, Mu W, Croker B, Reungjui S, Ouyang X, Tabah-Fisch I, et al. Effect of elevated serum uric acid on cisplatin-induced acute renal failure. Am J Physiol Renal Physiol. 2007; 292:F116–122. PMID: 17210794