Artiicial Neural Network Analysis in Preclinical Breast Cancer
Gholamreza Motalleb, Ph.D*
Department of Biology, Faculty of Science, University of Zabol, Zabol, Iran
*Corresponding Address: P.O.Box: 98615-53, Department of Biology, Faculty of Science, Zabol University, Zabol, Iran Emails: [email protected]; [email protected]
Received: 19/Apr/2013, Accepted:20/Jul/2013 Abstract
Objective: In this study, artiicial neural network (ANN) analysis of virotherapy in preclinical breast cancer was investigated.
Materials and Methods: In this research article, a multilayer feed-forward neural network trained with an error back-propagation algorithm was incorporated in order to develop a predictive model. The input parameters of the model were virus dose, week and tamoxifen citrate, while tumor weight was included in the output parameter. Two different training algorithms, namely quick propagation (QP) and Levenberg-Marquardt (LM), were used to train ANN.
Results: The results showed that the LM algorithm, with 3-9-1 arrangement is more
ef-icient compared to QP. Using LM algorithm, the coefef-icient of determination (R2) between
the actual and predicted values was determined as 0.897118 for all data.
Conclusion: It can be concluded that this ANN model may provide good ability to pre-dict the biometry information of tumor in preclinical breast cancer virotherapy. The results showed that the LM algorithm employed by Neural Power software gave the better perfor-mance compared with the QP and virus dose, and it is more important factor compared to tamoxifen and time (week).
Keywords:Neural Network Model, Breast Cancer, Virotherapy
Cell Journal(Yakht eh), Vol 15, No 4, Wint er 2014, Pages: 324- 331
Citation: Motalleb Gh. Artiicial neural network analysis in preclinical breast cancer. Cell J. 2014; 15(4): 324-331
Introduction
There is a need for new prognostic systems in cancer that can integrate an expanding number of prognostic factors (1). In order to generate the sur-vival estimates of a patient, an optimized method
is applied to evaluate both tumor speciication and
patient’s prognostic information (2). The use of
artiicial intelligence (AI) has become widely ac
-cepted in medical applications (3). Advantages of
neural network methods are as follows: ease of
optimization, cost-effective, lexible non-linear
modeling of large data sets, accuracy for predictive inference, and with potential to support clinical de-cision making. These models can make knowledge dissemination easier by providing explanation, for instance using of extraction rule or sensitivity analysis (4). In patients with breast cancer, earlier studies have reported promising results for neural network models (5). Intra tumoral injection is the method in vitro therapy in order to delivery local
viral genes in tumor tissues to decrease systemic
toxicity (6). Avian paramyxo virus type1 (Newcas
-tle disease virus) has been shown to have
prop-erties as an excellent anticancer agent (6).
NDV-AF2240 has been tested as an anticancer agent in
vivo (7, 8).
An interesting question is whether artiicial neu
-ral network could improve the accuracy of pre-dictions in order to obtain prognostic information
of tumor during Intra tumoral injection of NDV-AF2240 in breast cancer induced in Balb/c mice.
Materials and Methods
In this research study, tumor development was
evaluated according to modiied method of Xan
-thopoulos as carried out previously (7). Briely, 200 females Balb/c mice were divided randomly into 10 cancerous groups consisting of 20 mice per
4T1 cells, NDV-AF2240 and tamoxifen co-culture.
Cancerous groups were divided into cancer control
(CC); cancer treated with 0.5 µg/ml tamoxifen cit
-rate (CT); cancer treated with 8, 16, 32 and 64HA units of NDV-AF2240 named as C/NDV8, C/ NDV16, C/NDV32, and C/NDV64,respectively; as well as cancer treated with 8, 16, 32 and 64HA units of NDV-AF2240 and tamoxifen named as CT/ NDV8, CT/NDV16, CT/NDV32 and CT/NDV64,
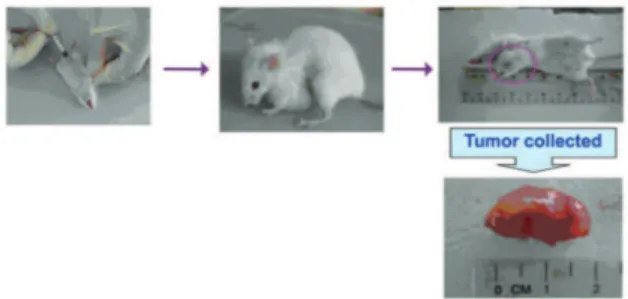
respectively, daily for four weeks. The tumor was detected by palpation around the induction area. Tumor size, volume and weight were measured weekly as described before (7). The collection of
tumor was done weekly. Five mice from each group
were sacriiced with diethyl ether (Fig 1). All pro
-cedures were approved by international guidelines
and by the Institute Research Ethics and Animal
Care and Use Committee of (University Putra Malaysia. Every effort was made to minimize the number of animals used and their suffering.)
Fig 1: The representative pictures of mice with tumor before
and after sacriicing.
Statistical methods
A commercial artiicial neural network (ANN) software, known as Neural Power version 2.5 (CPC-X Software, USA) was applied throughout
this study. The software has been also used by other researchers (9-15). This software is a Windows® -based package supporting several types of training
algorithms. Neural Power operates via a graphical
user interface (GUI) and enables a user to load the training and test sets, design the network architec-ture, select the training algorithm and generate the individual models for each output variable in a sin-gle operation (15).
Data sets
In order to determine the optimum number of neu-rons in hidden layer, a series of topologies was examined, in which the number of neurons was
varied from 1 to 20. The root mean square error
(RMSE) was used as the error function. Deci
-sion on the optimum topology was based on the minimum error of testing. Each topology was repeated five times to avoid random correlation due to the random initialization of the weights
(16). The experimental data used for ANN de
-sign are presented in table 1. The experimental data were randomly divided into the following three sets using the option available in the soft-ware: 24, 6 and 6 of data sets as training, testing and validation, respectively. The training data was used to compute the network parameters. The testing data was used to ensure robustness of the network parameters. To avoid the "over fitting" phenomenon, the testing stage was also used to control error; when it increased, the training was stopped (17). The validation data (or unseen data) was excluded from training, and testing was used to assess the predictive ability of the generated model (18).
ANN description
A multi-layer perceptron (MLP), based on
feed-forward ANN which uses back- propagation learn
-ing algorithm, was applied for model-ing of breast cancer virotherapy. The network consists of an in-put layer with three neurons, a hidden layer with nine neurons and an output layer. Inputs for the network are virus dose, tamoxifen and week (time), while the output is tumor weight. The structure of
proposed ANN is shown in igure 2.
Table1: Experimental values, actual and model predicating tumor weight on the breast cancer virotherapy
Tumor weight Actual Predicted Tamoxifen Week Virus dose Genes Training 0.000008 0 0 1 32 1 0.000001 0 0 1 64 2 0.000649 0 0 2 8 3 0.000008 0 0 2 16 4 0.016458 0 0 3 8 5 0.000054 0 0 3 16 6 0.000000 0 0 3 32 7 0.000000 0 0 3 64 8 0.007790 0 0 4 16 9 0.000000 0 0 4 64 10 0.002089 0 0 1 8 11 0.012448 0 0 1 16 12 0.984800 0.9825 0 1 64 13 0.000378 0 2 3 8 14 1.618200 1.62 2 3 32 15 2.046900 2.045 2 1 64 16 0.000842 0 3 2 16 17 0.993780 0.995 3 2 32 18 2.258800 2.27 3 3 64 19 0.000259 0 4 3 16 20 1.839400 1.8375 4 3 64 21 0.663030 0.6625 1 3 0 22 0.334240 0.335 2 1 0 23 2.373500 2.375 3 2 0 24 Testing 0.004600 0 0 1 8 25 0.000000 0 0 2 64 26 0.000006 0 0 4 32 27 0.002703 0 5 2 16 28 0.000082 0 5 4 8 29 2.633500 2.635 0 4 0 30 Validation 0.000012 0 0 1 16 31 0.000000 0 0 2 32 32 0.091257 0 0 4 8 33 0.269530 0.4225 5 1 32 34 0.000485 0 5 3 8 35 0.273280 1.895 5 4 32 36
Scaled data are passed into the input layer, and
then is propagated from input layer to hidden
lay-er, and inally to the output layer of the network
(19). In output layer, each node links and changes the inputs of previous layer as a junction
summa-tion using the following formula (20):
∑
= + = i 1 j j ij ii
x
w by (1)
where is the net input to node in hidden or output layer, is the inputs to node (or outputs of previous layer), wij is the weight representing the strength of the connection between the ith node and jth node, is the number of nodes and is the bias associated with node. Each neuron consists of a transfer function expressing internal activation level. Output from a neuron is determined by transforming its input using a suitable transfer function (21). Generally, the transfer functions for function approximation (regression) are sigmoidal function, hyperbolic
tangent and linear function (20). The most popular
transfer function for non-linear relationship is the sigmoid function (15, 22- 24). The general form of this function is as follows (20):
j e yy
z −
+
=
1 1(2)
zj, the output of node , is also an element of the inputs to the nodes in the next layer. In this study, the sigmoid function was used as the transfer function for the hidden and output layer nodes.
The algorithms used to train ANN in this study are quick propagation (QP) and Leven berg-Marquardt back propagation (LM). The details of
the algorithms have been reported elsewhere (15).
Model evaluation
The performance of the ANN models is assessed on the basis of the root mean squared error (RMSE)
and the coeficient of determination (R2) between
the predicted values of the network and the actual values, which are calculated as follows:
(
)
∑
=−
=
n 1 i 2 1 2 dii
y
)
y
n
1
(
RMSE (3)∑
∑
= = − − − = n 1 i 2 m di n 1 i 2 di i 2 ) y y ( ) y y ( 1is the number of points, yi is the predicted value ob-tained from the neural network model, ydi is the actual value, and ym is the average of the actual values. The
R2 shows the level of model itness (25). If value
of R2 is closer to 1, the model is considered as a
better design and its to the actual data (26). So, we considered the ANN model with lowest RMSE
and highest R2 as the best ANN design (27- 29).
Results
The ANN was employed to create and predict
a model in order to determine which factors, in-cluding virus dose, week (time) and tamoxifen, is the most important one during our preclini-cal in vivo study. Figure 2 illustrates the per -formance of the network for testing data versus the number of neurons in the hidden layer using
LM and QP algorithms. After repeated trials, it
was found that a network with 9 hidden
neu-rons produced the best performance when LM
algorithm was employed. However, a network with 3 hidden neurons produced the best result
for QP algorithm (Fig 3). These topologies have lowest RMSE for the testing sets.
The R2 and RMSE for two algorithms are pre
-sented in table 2. The LM algorithm has a better performance compared to QP algorithm (for all
data, RMSE=0.271946 and R2 =0.897118, Ta
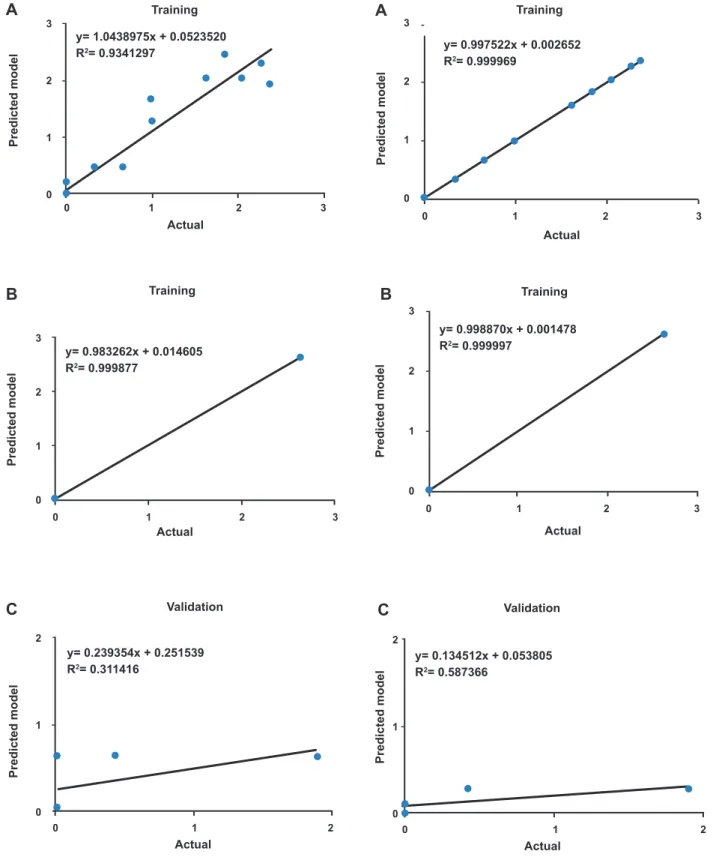
-ble 2). Figures 4 and 5 show the scatter plots of ANN predicted value versus actual value with QP and LM algorithms for the training, testing
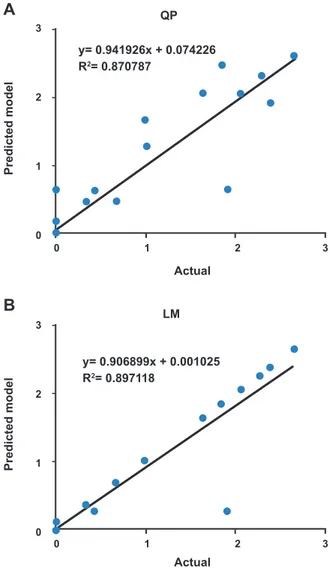
and validation sets, respectively. The scatter
plots for all data using QP and LM algorithms
are shown in figure 6. Therefore, it could be
concluded that model trained with LM algo
-rithm is more efficient compared to QP model.
In figure 7, the importance of selected variables
in the construction of the ANN model using LM
algorithm is shown. Interestingly, the virus dose showed higher contribution than the tamaxifen and time (week).
Number of neurons in hidden layer
A
RMSE
0.1
0.05
0
1 3 5 7 9 11 13 15 17 19
LM
B
RMSE
Number of neurons in hidden layer
0.5
0.4
0.3
0.2
0.1
0
1 3 5 7 9 11 13 15 17 19
OP
Fig 3: The performance of the network at different hidden neurons using: A. LM algorithm and B. QP algorithm.
Table 2: The RMSE and coeficient of determinations (R2) are two learning algorithms on modeling in preclinical breast
cancer
All data Validation
Training Training
R2
RMSE R2
RMSE R2
RMSE R2
RMSE The best
architecture Learning
algorithm
0.870787 0.310242
0.311416 0.582782
0.999877 0.020922
0.934129 0.243624
3-3-1
Quick propagation
0.897118 0.271946
0.587366 0.666038
0.999997 0.002261
0.999969 0.005157
3-9-1
Actual Training
y= 1.0438975x + 0.0523520
R2= 0.9341297 A
Predicted model
3
2
1
0
0 1 2 3
Actual Training
y= 0.983262x + 0.014605
R2= 0.999877 B
Predicted model
3
2
1
0
0 1 2 3
Actual Validation
y= 0.239354x + 0.251539
R2= 0.311416 C
Predicted model
2
1
0
0 1 2
Fig 4: The scatter plots of ANN predicted tumor weight ver-sus actual tumor weight for training (A), testing (B) and validation(C) data set using QP algorithm.
Actual Training
y= 0.997522x + 0.002652
R2= 0.999969 A
Predicted model
3
2
1
0
0 1 2 3
Actual Training
y= 0.998870x + 0.001478
R2= 0.999997 B
Predicted model
3
2
1
0
0 1 2 3
Actual Validation
y= 0.134512x + 0.053805
R2= 0.587366 C
Predicted model
2
1
0
0 1 2
Actual
y= 0.941926x + 0.074226
R2= 0.870787
Predicted model
2
1
0
0 1 2 3
Actual LM
y= 0.906899x + 0.001025
R2= 0.897118 B
Predicted model
3
2
1
0
0 1 2 3
Fig 6: The scatter plots of ANN predicted tumor weight versus actual tumor weight for all data set using QP algorithm (A) and LM algorithm (B)
Importance (%)
50
40
30
20
10
0
Virus dose Tamoxifen Week
40.87
36.39
22.74
Fig 7: The importance of independent variables in the con-structed ANN model.
At the present study, ANN analysis of Newcastle
disease virus in preclinical breast cancer was
in-vestigated. The RMSE was used as the error func
-tion. The R2 was used as a predictive ability of the network. The aim of a cancer monitoring program is to detect tumors at early stage in order to have a
successful treatment. A screening tool should not
be expensive and invasive in order to permit its
widespread application (30). Toxicity is very im
-portant in any experimental therapeutic agent, and oncolytic viruses are not different in killing
can-cer cells. Also, toxicity is dependent on the virus
strain, genetic changes, and the dose of virus (31). Tamoxifen is used in treatment of steroid recep-tor positive breast cancer as a standard endocrine
therapy (32). An artiicial neural network model contains hundreds of artiicial neurons combined
through weights, which is also described as
coef-icients, are adjustable factors, so neural network (NN) is considered as a system with parameters.
The weighed sum of the inputs constitutes the activation of the neuron. The activation signal is passed through transfer function to produce a
sin-gle output of the neuron. Coeficients optimiza
-tion in training continues until predic-tion errors is minimized, and the system gets accuracy with
speciied level. New input data or information can
be given to the network when it is trained and
test-ed. At this step, optimized coeficients or weights ratio shows the incorporation percentage in inal
result or output for each input data or parameter that could be computed as an important value (33). I selected dose of virus, week and tamoxifen as
the main input layer factors. The indings of my ANN model is in agreement with study of Motalleb
et al. (7), in which we showed changes of tumor weight and mass were dose-response during
intra-tumoral injection of virus (Fig 7). From another point of view, my ANN model compared factors
of virus dose, tamoxifen and time, among which
the dose of virus is more important factor. Direct
administration and intratumoral injection of
differ-ent strain of NDV in clinical trials have been ap
-plied to cancer patients and the results showed this
subject is required further evaluation. It is noted
that it has been shown that intratumoral injection
of NDV induce the tumor regressions signiicantly
(34). For all data, the R2 of LM was 0.897118 that
To say in a different way, in biomedical research, the behavior of data is not fully predicted, and for this reason, the R2 for all data was less than R2 for
testing. The research studies have been conirmed the dominant role of apoptosis by NDV-induced
cell death in cancer research. NDV induces apop
-tosis through the following steps: viral entry into the cell, its replication, synthesis of its protein, and
activation of caspases. NDV promotes oncolytic
activity in tumors by different mechanisms includ-ing multinucleated formation of syncytia, activa-tion of intrinsic and extrinsic apoptotic pathways, endoplasmic reticulum (ER) stress pathway
acti-vation, mitogen activated protein kinases (MAPK)
pathways and secretion of pro inlammatory cy
-tokines and chemokines (34). The model that was gained at this research could be very useful in saving time, cost and energy in pharmacology and viro-therapy of cancer research before go-ing to clinical trial phase in human. However, we
have to ind new methods in clinical application to
drop the disadvantages of intra tumoral injection of virus in gene therapy. To say in a different way,
ANN can improve the accuracy of cancer survival
prediction.
Conclusion
In this study, the ANN predictions in order to ob
-tain prognostic information of tumor during Intra
tumoral injection of NDV-AF2240 in preclinical
breast cancer have been optimized through a proper
selection of the training algorithm. Different ANNs,
trained with QP and LM, were evaluated with re
-spect to their predictive ability. The LM algorithm employed by Neural Power software showed the better performance compared with QP. The results
showed virus dose is more important factor com-pared to tamoxifen and time (week). It can be
con-cluded that the ANN model of this research paper
has good ability to predict the biometry information of tumor in preclinical breast cancer virotherapy.
Acknowledgments
Here, I highly appreciate from Dr. Mansour
Ghaffari Moghadam for his suggestions. The
au-thor has no conlicts of interest in this article.
References
1. Clark GM, Hilsenbeck SG, Ravdin PM, De Laurentiis M, Osborne CK. Prognostic factors: rationale and methods of analysis and integra-tion. Breast Cancer Res Treat. 1994;
32(1): 105-112.
2. Fielding LP, Henson DE. Multiple prognostic factors and outcome analysis in patients with cancer.Communication from the American Joint Committee on Cancer.Cancer. 1993; 71(7): 2426-2429.
3. Gant V, Rodway S, Wyatt J. Artiicial neural networks: practical considerations for clinical applications. In: Gant V, Dybowski R, editors. Clinical applications of artii-cial neural networks. Cambridge: Cambridge University Press; 2001; 329-356.
4. Lisboa PJ. A review of evidence of health beneit from artiicial neural networks in medical intervention. Neural Netw. 2002; 15(1): 11-39.
5. Burke HB, Goodman PH, Rosen DB, Henson DE, Wein-stein JN, Harrell FE, et al. Artiicial neural networks im-prove the accuracy of cancer survival prediction. Can-cer.1997; 79(4): 857-862.
6. Wang Y, Hu JK, Krol A, Li YP, Li CY, Yuan F. Systemic dis-semination of viral vectors during intratumoral injection. Mol Cancer Ther. 2003; 2(11): 1233-1242.
7. MotallebGh, Othman F, Ideris A, Rahmat A. Dissemination of Newcastle disease virus (NDV-AF2240) in liver during intratumoral injection of xenotransplant breast cancer in BALB/c mice. Cell J. 2009; 11(3): 303-310.
8. Fauziah O, Aini I, Asmah R, Omar AR, Abdul-Manaf A, Jafri MA, et al. Replication of Newcastle disease virus in the breast cancer cell lines. Proceedings Yemeni scientiic research foundation conference. 2004, Oct 11-13; Sanaa, Yemen.
9. Sanchooli M, Ghaffari Moghaddam M. Evaluation of acid-ity constants of anthraquinone derivatives in methanol/ water Mixtures using real quantum descriptors. J Chem Eng Jap. 2012; 45(6): 373-379.
10. Ghaffari Moghaddam M, Khajeh M. Comparison of re-sponse surface methodology and atiicialneural network in predicting the microwave-assisted extraction procedure to determine zinc in ish muscles. Food Nut Sci. 2011; 2(8): 803-808.
11. Masoumi HRF, Kassim A, Basri M, Abdullah DK, Haron MK. Multivariate optimization in the biosynthesis of a triethanolamine (TEA)-based esterquat cationic surfactant using an artiicial neural network. Molecules. 2011; 16(7): 5538-5549.
12. Ghaffari Moghaddam M, Ahmad FBH, Basri M, Rahman MBA. Artiicial neural network modeling studies to predict the yield of enzymatic synthesis of betulinic acid ester. Electron J Biotechnol. 2010; 13(3): 3-4.
13. Jain SK, Sarkar A, Garg V. Impact of the declining trend of low on Harike Wetland, India. WRM. 2008; 22(4): 409-421. 14. Basri M, Rahman RNZRA, Ebrahimpour A, Salleh AB,
Gunawan ER, Rahman MBA. Comparison of estimation capabilities of response surface methodology (RSM) with artiicial neural network (ANN) in lipase-catalyzed synthe-sis of palm-based wax ester. BMC Biotechnol. 2007; 7: 53-66.
15. Ghaffari A, Abdollahi H, Khoshayand MR, Bozchalooi IS, Dadgar A, Raiee-Tehrani M. Performance comparison of neural network training algorithms in modeling of bimodal drug delivery. Int J Pharm. 2007; 327(1-2): 126-138. 16. Kasiri MB, Aleboyeh H, Aleboyeh, A. Modeling and
op-timization of heterogeneous photo-fenton process with response surface methodology and artiicial neural net-works. Environ Sci Technol. 2008; 42(21): 7970-7975. 17. Song X, Mitnitski A, Macknight C, Rockwood K.
Assess-ment of individual risk of death using self-report data: an artiicial neural network compared with a frailty index.J Am Geriatr Soc. 2004; 52(7): 1180-1184.
Determi-nation of factors controlling the particle size in nanoemul-sions using artiicial neural networks. Eur J Pharm Sci. 2008; 35(1-2): 42-51.
19. Hussain M, Shaiur RM, Ng CW. Prediction of pores for-mation (porosity) in foods during drying: generic models by the use of hybrid neural network. J Food Eng. 2002; 51(3): 239-248.
20. Jorjani E, Chehreh CS, Mesroghli SH. Application of artii-cial neural networks to predict chemical desulfurization of tabas coal. Fuel. 2008; 87(12): 2727-2734.
21. Razavi MA, Mortazavi A, Mousavi M. Dynamic modeling of milk ultrailtration by artiicial neural network. J Mem-brane Sci. 2003; 220(1-2): 47-58.
22. Bowen WR, Jones MG, Yousef HNS. Dynamic ultrailtra-tion of proteins-a neural network approach.J Membrane Sci.1998; 146(2): 225-235.
23. Mohanty S. Estimation of vapour liquid equilibria of binary systems, carbon dioxide-ethyl caproate, ethyl caprylate and ethyl caprate using artiicial neural networks. Fluid Phase Equilib. 2005; 235(1): 92-98.
24. Shanker TJ, Bandyopadhyay S. Prediction of extrudate properties using artiicial neural networks. Food Bioprod Process. 2007; 85(1): 29-33.
25. Nath A, Chattopadhyay, PK. Optimization of oven toast-ing for improvtoast-ing crispness and other quality attributes of ready to eat potato-soy snack using response surface methodology. J Food Eng. 2007; 80(4): 1282-1292. 26. Sin HN, Yusof S, Sheikh Abdul Hamid N, Abd. Rahman R.
Optimization of enzymatic clariication of sapodilla juice using response surface methodology. J Food Eng. 2006; 73(4): 313-319.
27. Basri M, Rahman A, Ebrahimpour A, Salleh AB,
Gunawan ER, Rahmad MB. Comparison of estimation capabilities of response surfacemethodology (RSM) with artificial neural network (ANN) in lipase catalyzed synthesis of palm-based wax ester. BMC Biotechnol-ogy. 2007; 7: 53-66.
28. Izadifar M, ZolghadriJahromi M. Application of genetic algorithm for optimization of vegetable oil hydrogenation process. J Food Eng. 2007; 78(1): 1-8.
29. Wang L, Yang B, Wang R, DU X. Extraction of pepsin-sol-uble collagen from grass carp (Ctenopharyngodonidella) skin using an artiicial neural network. Food Chem. 2008; 111(3): 683-686.
30. Pepe MS, Etzioni R, Feng Z, Potter JD, Thompson ML, Thornquist M, et al. Phases of biomarker development for early detection of cancer. J Natl Cancer Inst. 2001; 93(14): 1054-1061.
31. Vile R, Ando D, Kirn D. The oncolyticvirotherapytreat-ment platform for cancer: unique biological and biosafety points to consider. Cancer Gene Ther. 2002; 9(12): 1062-1067.
32. Brauch H, Jordan VC. Targeting of tamoxifen to enhance antitumour action for the treatment and prevention of breast cancer: The 'personalised' approach?. Eur J Can-cer. 2009; 45(13): 2274-2283.
33. Ebrahimpour A, Rahman R, Kamarudin N, Basri M, Salleh A. Lipase production and growth modeling of a novel thermophilic bacterium: aneurinibacillusthermoaerophilus strain AFNA. Electron J Biotechnol. 2011; 14(4): 1-6. 34. Schirrmacher V, Griesbach A, Ahlert T. Antitumor effects