Regression and Art if icial Neural Net w orks
M ail Address
Ke yw ord s Aut hor(s)
Arrived: December / 2007 Approved: July / 2008
ABSTRACT
An artificial neural network (ANN) was compared with a multiple linear regression statistical method to predict hatchability in an artificial incubation process. A feedforward neural network architecture was applied. Network trainings were made by the backpropagation algorithm based on data obtained from industrial incubations. The ANN model was chosen as it produced data that fit better the experimental data as compared to the multiple linear regression model, which used coefficients determined by minimum square method. The proposed simulation results of these approaches indicate that this ANN can be used for incubation performance prediction.
INTRODUCTION
Poultry production is the most technologically advanced activity in Brazilian poultry production (Furtado et al., 2006). The state of Santa Catarina is outstanding in this scenario, hosting important poultry companies, particularly in the west. The poultry industry heavily invests in equipment, technology, innovations, management, and health (Denardin, 2004).
The artificial neural network (ANN), an artificial intelligence technique, is a potential tool for modeling data in poultry production. Roush et al. (1997) used an ANN to make a probabilistic prediction of ascitis in broilers, with no need of post-mortem examinations or other procedures. According to the authors, the developed models improved ascitis diagnosis in broilers. Salle et al. (2001) studied the possibility of using ANN methodology to estimate production parameters of developing broiler breeders, and found that this method allowed the simulation of the consequences of management decisions, determining the contribution of each variable to the studied phenomenon.
During embryo development, the nutrients, energy, and water used by the embryo are inside the egg. Embryo development also requires egg heating, proper air oxygen, steam, and carbon dioxide transport rates, which are necessary for cell metabolism during different incubation steps. Temperature and humidity are the main factors involved in embryo survival during incubation (Boleli, 2003). Low relative humidity levels increase the incubation period (Muraroli et al. 2003) and embryo late mortality (Decuypere et al., 2003). A mere increase of 0.2 ºC during incubation may also reduce the incubation period and affect embryo livability (Christensen et al., 2001). The biggest problem in artificial incubation is to control all these factors, as many are not well-known, and others are difficult to control. During artificial incubations, egg hatchability is a measure of embryo livability, and it is directly related to the combined action of a large number of factors.
The present study aimed at comparing the use artificial neural
Bolzan AC1
Machado RAF2
Piaia JCZ3
1 Dr. Chemical Engineer. Associate Professor
EQA – Chemical Engineering and Food Engineering Dept /UFSC.
2
Dr. Chemical Engineer. Associate Professor EQA – Chemical Engineering and Food Engineering Dept /UFSC.
3
Food Engineer, M.Sc. Dr. student at CPGENQ/UFSC.
Julio CZ Piaia
Universidade Federal de Santa Catarina -Centro Tecnológico
Departamento de Eng. Química e Eng. de Alimentos
Laboratório de Controle de Processos - LCP Campus Universitário - Trindade
CP: 476
88.010-970. Florianópolis, SC, Brazil. E-mail: [email protected]
networks with a multiple linear regression model to estimate the hatchability of artificially incubated eggs.
M ATERIALS AND M ETHODS
Experim ent al unit
After lay and collection, eggs remained in the farm for approximately seven hours at environment temperature (T) and air relative humidity (RH) until eight groups were formed. Eggs were then transported to the local hatchery, where they were stored under controlled T and RH (20ºC and 60% respectively). T and air RH influences were evaluated with the period of one and two days of egg storage.
A total number of 41.280 ovos of the Gallus gallus species were distributed in eight incubators (CASP/ Mg 124) with a capacity of 5.160 eggs each, thereby characterizing eight experiments (lots). All eggs derived from the same 39-week-old Cobb 500 broiler breeder flock. Temperature sensors (four units) were distributed inside each incubator and hatcher, and were placed one meter above the eggs. The other sensors (one unit each) that measured relative humidity, and carbon dioxide and oxygen levels were placed at the central upper part of the incubators and hatchers. The specifications of the used sensors were: temperature (Pt100), relative humidity (Novus/RHT), monitor with infrared sensor for carbon dioxide level with de 0-5% detection range (Vulcain/90DM3A), and monitor with electrochemical sensor for oxygen, with a 0-30% detection range (ISC/AirWare). Data from the sensors were collected in a electronic data logger (Novus/ Fieldlogger), set up to collect parameter samples every two minutes. At the end of each day, data were transmitted and saved in a computer.
The multiple-stage incubators were planned to keep a dry-bulb temperature of 37.0 ±0.5ºC and air relative humidity of 50.0±5%. After 18 days of incubation, eggs were transferred to the hatchers, with controlled temperature and humidity of 36.5±0.5ºC and 60.0±5%, respectively, where they remained until the 21st
day (496 hours) for hatching.
Art if icial neural net w orks
In the field of artificial intelligence, artificial neural networks are non-linear parametric models that mimick human brain processing mechanism (Santos et al., 2005). ANNs are computational techniques, which model is inspired in the neural structure of intelligent beings, and that acquire knowledge by experience or learning.
i) McCulloch’s Boolean Neuron – ANNs present
knots or processing units. Each unit is connected to other units, which receive and send signals. Each unit has a local memory. These units simulate neurons, receiving and transmitting information. Inputs correspond to an input vector
[
]
Tn x x x
X = 1, 2,... of n dimension. Each xi input receives a synaptic weight corresponding to wi in neuron input. The sum ofxiinputs weighted by the corresponding wiweight is called linear output u, where u=
∑
wixi . The y output of the neuron, designated as activation output, is obtained by the application of a f function to ulinear output, indicated by
y
=
f
( )
u
. The ffunction is called the activation function, and may present different forms, which usually are non-linear (non-linear, step, sigmoid or hyperbolic tangent).
ii) Learning – As previously mentioned, ANNs are
characterized by learning through examples. For a certain data set, the learning algorithm must be responsible for adapting the network parameters to allow, in a finite number of algorithm interactions, convergence for a solution. The convergence criterion varies according to the algorithm and the learning paradigm.
A neural network typically consists of a set of processing units, which compose the input layer, one or more hidden layers, and the output layer. The input signal is propagated forward through the network, layer by layer. These neural networks are usually called multi-layer perceptrons (MLP) (Haykin, 2001).
The general architecture of the neural system used here consisted of a multi-layer perceptron network. The backpropagation learning algorithm was applied, and network neuron weight fit and learning rate depended only of the gradient signals of the error function. The objective of this algorithm is to find in the error surface values for the synaptic weights that minimize network errors (Haykin, 2001).
Neural m odel im plem ent at ion
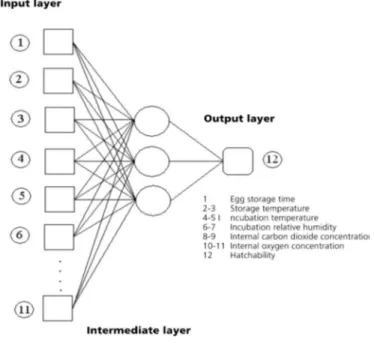
temperature, air relative humidity, and molar internal concentrations of carbon dioxide and oxygen, all with their respective standard deviations. The last layer is the output layer, where the solution for the problem is obtained.
Hatchability was determined according to Equation 1:
total n. hatched eggs
% Hatchability = * 100 (1)
total n. incubated fertile eggs
The parameters used in the input layer included the entire 496-h incubation period (incubation and hatcher data). Hatchability and data electronically recorded by the sensors inside the incubators and the hatchers were randomly divided in two sets – training and Validation. The training set consisted of data from six incubations out of the eight carried out, and included the mean and standard deviation of each parameter. Data were normalized in a 0-1 range, and submitted to ANN in the format of a matrix with eleven columns (process variables) and 496 lines (corresponding to the number of hours of the total incubation period). Data normalization is essential when unit values have different magnitudes (Yin et al., 2003). The remaining incubations were divided in two sets – Test and Validation. Figure 1 presents the architecture of the applied neural network.
Figure 1 - Neural architecture of the system used to predict hatchability.
The learning rate was adaptive in the 0-1 range as, according to Teixeira et al. (1998), a variable learning rate improves network performance – if the error is small, the rate must also be small, but as the error increases, the rate should also increase. The choice of the number of neurons in the hidden or intermediate layer was made by trial, always seeking networks with few hidden neurons and good generalization capacity. There is no general criterion to defined neuron number in the intermediate layer. ANNs with a few hidden neurons are preferred, as they tend to have higher generalization power, reducing overfitting problems. However, networks with few intermediate neurons may not have enough capacity to model and to learn data in complex problems, leading to underfitting, i.e., the ANN did not train enough to represent the data set (Pereira, 1999).
At first, a neural network with three neurons in the intermediate layer was designed, and it presented good generalization power. ANNs with four and five hidden neurons were also evaluated, but some become too specialized during training. Therefore, ANNs with only three neurons in the intermediate layer were considered. The sigmoidal activation function, expressed as f(u) = 1/(1 + e-u
), where for each intermediate neuron, was applied. In 200-time step intervals, training was interrupted and compared to the desired outputs, which were included in the network data, and an error signal was calculated for each. This error signal was transmitted back to the network (error backpropagation), thereby updating weights and connections, aiming at decreasing the error between input and output, which allowed the ANN to learn the information contained in the data. The training data set was presented 5000 times to the network, and the performance was assessed based on the Test and Validation sets. The ANN model was simulated in MATLAB®
software, version 6.3 (Matrix Laboratory) for Windows, which is a computational environment used for visualization and high-performance numerical computation. MATLAB integrates numerical analysis, signal processing, and graphs, and the problems and solutions are expressed as mathematically formulated, with no traditional programming (Veiga et al., 2005).
M ult iple regression linear m odel
mathematic technique that minimizes differences between actual and predicted values. Using the same data set applied for ANN training, a multiple linear regression model (MLR) was generated using the software STATISTICATM
, version 5.0, to predict fertile egg hatchability (Yi). The independent values considered were the same used in the input layer of the ANN, and were estimated by multiple linear regression. For the data set with eleven explanatory variables, the regression model is described as (Equation 2):
Yi = b0 + b1X1i + b2X2i + b3X3i + b4X4i + b5X5i + b6X6i +
b7X7i + b8X8i + b9X9i + b10X10i + b11X11i (2)
Co m p a r i so n o f t h e a r t i f i ci a l n e u r a l n e t w o r k w i t h t h e m u l t i p l e l i n e a r regression m odel
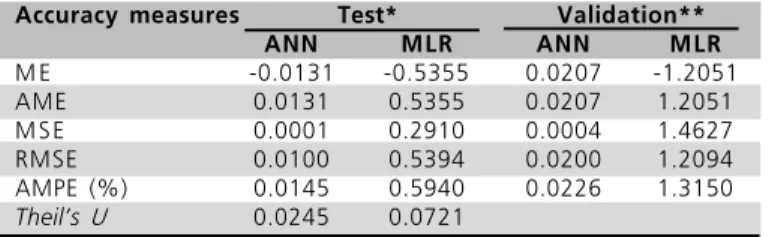
Hatchabilities estimated by ANN were compared with those estimated by the multiple linear regression model, based on performance measurements (Table 1). The measurement used to validate the estimation methods are mentioned below, where are the actual observations and the estimates, using the methods ANN or MLR, of egg hatchability.
The measure MAPE, according to Armstrong & Collopy (1992), places a heavier penalty on estimated values above the desired value than on those below the desired value. According to Taylor (1992), in order to validate different methods to estimate a single series, MSE can be used; however, when the same method is applied to a group of series, MSE may produce misleading results. A solution for the problem of choosing a proper error measurement is that proposed by Makridakis et al. (1998), which included in Validation most standard error measurements.
The ratio r (Equation 10) is known as Theil’s U or difference coefficient, and is used to measure the efficiency of a prediction model. For r values lower than 1, it indicates that the error obtained in ANN is lower than that obtained in MLR.
RESULTS AND DISCUSSION
The obtained results were compared with the actual hatchabilities of the incubations to validate the proposed models – Test and Validation, with hatchabilities of 90.13% and 91.64%, respectively. Based on the data obtained in the matrices used in ANN and in the MLR model, the errors were calculated. Table 2 shows the evaluation criteria used to determine
In order to determine which model obtained the best prediction, the measure of the r ratio, described in Equation 10, was used. According to Braga et al. (2002), prediction models with Theil’s U values equal or lower than 0.55 are considered reliable. The value presented by the ANN model (Table 2) indicates that it is highly reliable.
the quality of the hatchability estimation methodologies used in ANN and in the MLR model.
Table 1 – Evaluation criteria of estimate quality.
Mean error
∑
= − = å N í í í c F
Ev å N
jb (3)
Absolute mean error (AME)
∑
= − = å N í í í c F v E å N
j^b (4)
Mean Square Error (MSE)
∑
= − = å N í O í
í cF
v E å N
jpb (5)
Root of Mean Square Error (RMSE)
å F c v E ojpb å N í O í í
∑
= − = (6)Percentage Error (PE t
) v NMM
c v mb í í í í − = (7)
Mean Percentage Error (MPE)
∑
= = å N í í mb å N jmb (8) Absolute Mean
Percentage Error (AMPE)
∑
= = å N í í mb å N j^mb (9)
Difference Coefficient (Theil’s U)
(
)
(
)
∑
∑
−
−
=
á O á å á á O á é áv
v
v
v
ê
(10)Where Yp is the value estimated by NAA, Y is the desired value, and
Yn is the value estimated by MLR.
Table 2 - Prediction measures used in ANN and in the MLR model.
Accuracy measures Test* Validation**
ANN MLR ANN MLR
M E -0.0131 -0.5355 0.0207 -1.2051
AME 0.0131 0.5355 0.0207 1.2051
MSE 0.0001 0.2910 0.0004 1.4627
RMSE 0.0100 0.5394 0.0200 1.2094
AMPE (%) 0.0145 0.5940 0.0226 1.3150
Theil’s U 0.0245 0.0721
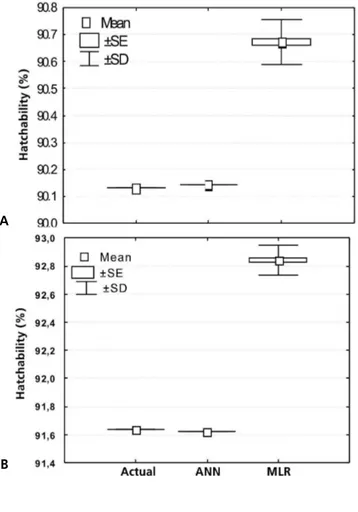
Data variations in each model are presented in Figure 2, and are represented as the central value (mean), as well as standard error and standard deviation ranges. Figure 2A shows the variation of hatchability predictions for the Test of the proposed models. In ANN, results presented virtually no variation, with predicted mean (90.14%) very close to actual hatchability 90.13%. The widest error range was found in the MLR method (90.6 and 90.74%), with a predicted mean of 90.67%. Yu et al. (2005) evaluated the use of ANNs
as an alternative to traditional regression statistics techniques to predict shrimp growth in commercial farms. The results indicated that ANN provided a more accurate prediction than conventional multiple regression models.
Figure 2B shows high variation of the results predicted by the MLR statistical method (92.72 and 92.92%) and a relatively high mean (92.82%); however, ANN mean was equivalent to the actual hatchability of 91.64%.
Mean air temperature and egg storage time were 20.50±0.90ºC and one day for the Test, and 21.1±0.30ºC and two days in Validation. Reis et al. (1997) studied the influence of short storage periods (one or two days) at 21.0ºC on the hatchability of fertile eggs. Hatchability of eggs stored for two days was higher as compared to one-day storage (92.10 vs. 90.6%, respectively). The fact that ANN was able to predict this behavior, i.e., that Validation eggs submitted to longer storage (two days) presented higher hatchability than the Test eggs, confirms that this method is able to produce more accurate predictions.
The best performance presented by ANN mainly derived from its capacity to capture non-linear dynamics (Hamed et al., 2004). ANN have greater advantage in complex situations, are variables are constantly compared to convergence data, opposite to regression analysis (Yu et al., 2005).
The application and the success of ANNs in prediction problems are not new in science. Researchers from different areas have applied ANNs with good results in problems aiming at abstracting patterns. As Brazil is a leader in the broiler market in South America, this industry needs to increased its competitiveness by researching technological innovations.
CONCLUSION
This study aimed at demonstrating the possibility of the use of artificial intelligence in agribusiness, specifically in broiler production. The representative and predictive capacity of ANN was compared to the multiple linear regression model. The results showed that the proposed ANN methodology was more efficient to predict hatchability, as compared to the MLR statistical model, as shown by its lower error measurements.
REFERENCES
Armstrong JS, Collopy F. Error measures for generalizing about forecasting methods: Empirical comparisons. International Journal of Forecasting 1992; 8(1):69-80.
Boleli IC. Fatores que afetam a eclodibilidade e qualidade dos pintos. In: Macari M, Gonzáles E. Manejo da incubação. 2.ed. Campinas (SP): Fundação APINCO de Ciência e Tecnologia Avícolas; 2003. p.394-434.
Braga AP, Lurdemir TB, Carvalho ACPL, Ludemir TB, Almeida MB,
Figure 2 - Hatchability prediction variations of the ANN and MLR models and Test and Validation hatchability values (A and B, respectively).
Lacerda E. Radial basis function networks in modelling and forecasting financial data: techniques of non-linear dynamics. Boston: Kluwer Academic Publishers; 2002.
Christensen VL, Wineland MJ, Fasenko GM. et al. Egg storage effects on plasma glucose and supply and demand tissue glycogen concentrations of broiler embryos. Poultry Science 2001; 80(12):1729-1735.
Decuypere K, Malheiros RD, Moraes VMB. et al. Fisiologia do embrião. In: Macari, Gonzáles E. Manejo da incubação. 2.ed. Campinas: Fundação APINCO de Ciência e Tecnologia Avícolas; 2003. p.65-94.
Denardin VF. De capital natural a capital natural crítico: a aplicação da Matriz de Deliberação na gestão participativa dos recursos hídricos no Oeste Catarinense [tese]. Rio de Janeiro (RJ): Universidade Federal Rural do Rio de Janeiro; 2004.
Furtado DA, Dantas RT, Nascimento JWB. et al. Effect of different environment conditioning systems on the productive performance of chickens.Revista Brasileira de Engenharia Agrícola and Ambiental 2006; 10(2):484-489.
Haykin S. Redes neurais: princípios e prática. 2.ed. Porto Alegre: Bookman; 2001.
Hamed MM, Khalafallah MG, Hassanien EA. Prediction of wastewater treatment plant performance using artificial neural networks. Environmental Modeling & Software 2004; 19(10):919-928.
Makridakis S, Wheelwright SC, Hyndman RJ. Forecasting: methods and applications. 3rd ed. New York (NY): Wiley & Sons; 1998.
Muraroli A, Mendes AA. Manejo da incubação, transferência e nascimento do pinto. In: Macari M, Gonzáles E. Manejo da incubação. 2. ed. Campinas: Fundação APINCO de Ciência and Tecnologia Avícolas; 2003. p.180-198.
Pereira BB. Introduction to neural networks in statistics [technical report]: center of multivariate analysis. Pennsylvania: Pennsylvania State University; 1999.
Reis LH, Gama LT, Soares MC. Effects of short storage conditions and broiler breeder age on hatchability, hatching time, and chick weights. Poultry Science 1997; 76:1459-1466.
Roush WB, Cravener TL, Kirby YK, Wideman Jr RF. Probabilistic neural network prediction of ascites in broiler based on minimally invasive physiological factors. Poultry Science 1997; 76(11):1513-1516.
Salle CTP, Guahyba AS, Wald VB, Silva AB, Salle FO, Fallavena LCB. Uso de redes neurais artificiais para estimar parâmetros de produção de galinhas reprodutoras pesadas em recria. Revista Brasileira de Ciência Avícola 2001; 3(3):257-264.
Santos MA, Seixas JM, Pereira BB, Medronho RA. Usando redes neurais artificiais e regressão logística na predição da hepatite A. Revista Brasileira de Epidemiologia 2005; 2(8):117-26.
Taylor SJ. Comparing forecasts in finance. In: A commentary on
error measures. International Journal of Forecasting 1992; 8(1): 99-111.
Teixeira RA, Braga AP, Menezes BR. Controle de Um Manipulador PUMA 560 Utilizando Redes Neurais Artificiais com Adaptação em Tempo Real. Anais do 5º Simpósio Brasileiro de Redes Neurais; 1998; Belo Horizonte. Minas Gerais. Brasil. p.146-151.
Veiga JLBC, Carvalho AA, Silva IC, Rebello JMA. The use of artificial network in the classification of pulse-echo and TOFD ultra-sonic signals. Journal of the Brazilian Society of Mechanical Sciences and Engineering 2005; 27(4):394-398.
Yin C, Rosendahl L, Luo Z. Methods to improve prediction performance of ANN models. Simulation Modelling Practice and Theory 2003; 11:211-222.