BGD
12, 17367–17392, 2015
Temperature-mediated changes in microbial carbon use
efficiency
C. A. Lehmeier et al.
Title Page
Abstract Introduction
Conclusions References
Tables Figures
◭ ◮
◭ ◮
Back Close
Full Screen / Esc
Printer-friendly Version
Interactive Discussion
Discussion
P
a
per
|
Discussion
P
a
per
|
Discussion
P
a
per
|
Discussion
P
a
per
|
Biogeosciences Discuss., 12, 17367–17392, 2015 www.biogeosciences-discuss.net/12/17367/2015/ doi:10.5194/bgd-12-17367-2015
© Author(s) 2015. CC Attribution 3.0 License.
This discussion paper is/has been under review for the journal Biogeosciences (BG). Please refer to the corresponding final paper in BG if available.
Temperature-mediated changes in
microbial carbon use e
ffi
ciency and
13
C discrimination
C. A. Lehmeier1, F. Ballantyne IV1,a, K. Min1, and S. A. Billings1
1
Department of Ecology and Evolutionary Biology, Kansas Biological Survey, University of Kansas, 2101 Constant Ave., Lawrence, KS 66047, USA
a
now at: Odum School of Ecology, University of Georgia, 140 E. Green St., Athens, GA 30602, USA
Received: 11 September 2015 – Accepted: 15 October 2015 – Published: 29 October 2015 Correspondence to: S. A. Billings ([email protected])
BGD
12, 17367–17392, 2015
Temperature-mediated changes in microbial carbon use
efficiency
C. A. Lehmeier et al.
Title Page
Abstract Introduction
Conclusions References
Tables Figures
◭ ◮
◭ ◮
Back Close
Full Screen / Esc
Printer-friendly Version
Interactive Discussion
Discussion
P
a
per
|
Discussion
P
a
per
|
Discussion
P
a
per
|
Discussion
P
a
per
|
Abstract
Understanding how carbon dioxide (CO2) flux from soils feeds back to climate warm-ing depends in part on our ability to quantify the efficiency with which microorganisms
convert soil organic carbon (C) into either biomass or CO2. Quantifying ecosystem-level respiratory CO2 losses often also requires assumptions about stable C isotope 5
fractionations associated with the microbial transformation of soil organic substrates. However, the diversity of organic substrates’ δ13C and the challenges of measuring microbial C use efficiency (CUE) in soils fundamentally limit our ability to project soil,
and thus ecosystem, C budgets in a warming climate. Here, we quantify the effect of
temperature on C fluxes during metabolic transformations of cellobiose, a common mi-10
crobial substrate, by a cosmopolitan soil microorganism growing at a constant rate. Specific respiration rate increased by 250 % between 13 and 26.5◦C, decreasing CUE from 77 to 56 %. Specific respiration rate was positively correlated with an increase in respiratory13C discrimination from 4.4 to 6.7 ‰ across the same temperature range. This first demonstration of a direct link between temperature, microbial CUE and as-15
sociated isotope fluxes provides a critical step towards understandingδ13C of respired CO2at multiple scales, and towards a framework for predicting future soil C fluxes.
1 Introduction
Because Earth’s C cycle is a key regulator of climate, a central goal of biogeochemistry is to understand terrestrial biosphere–atmosphere C exchange. Globally, almost all C 20
initially assimilated via photosynthesis is respired by plants and soil microorganisms
back to the atmosphere as CO2 (Schimel, 1995; Trumbore, 2006). Though we have
a reasonably comprehensive understanding of how environmental conditions influence photosynthetic CO2uptake by plants, our understanding of how respiratory CO2fluxes respond to environmental conditions significantly lags behind. This is especially true for 25
BGD
12, 17367–17392, 2015
Temperature-mediated changes in microbial carbon use
efficiency
C. A. Lehmeier et al.
Title Page
Abstract Introduction
Conclusions References
Tables Figures
◭ ◮
◭ ◮
Back Close
Full Screen / Esc
Printer-friendly Version
Interactive Discussion
Discussion
P
a
per
|
Discussion
P
a
per
|
Discussion
P
a
per
|
Discussion
P
a
per
|
which may account for∼65 % of the CO2loss from soils (Subke et al., 2006). Metabolic
rates of soil microbes are expected to increase with rising temperatures (Gillooly et al., 2001), which is of great concern given the large reservoir of C substrates in soil organic
matter (SOM) that may be mineralized to CO2 via metabolism (Kirschbaum, 2006).
The influence of temperature on the physiology of soil microbes must therefore be well 5
understood to project shifts in the terrestrial C balance in a warmer climate.
Existing knowledge of Earth’s terrestrial C balance has been bolstered by the use of stable isotopes. A milestone for progress was when photosynthetic responses to en-vironmental conditions were linked to differences between the stable C isotopic
com-position (δ13C) of atmospheric CO2and that of plant products (Farquhar et al., 1982). 10
These differences, caused by C isotope fractionation during CO
2diffusion into leaves
and subsequent carboxylation (Park and Epstein, 1961; O’Leary, 1981), impart an iso-topic fingerprint on ecosystem C pools and permit inference about C fluxes fromδ13C of ecosystem C pools at multiple spatio-temporal scales (Farquhar and Richards, 1984; Pataki et al., 2003; Dijkstra et al., 2004; Barbosa et al., 2010). Recent studies remind 15
us that respiratory C losses also leave an isotopic fingerprint onδ13C values of plant tissues via respiration of substrates with distinctδ13C (Bathellier et al., 2009; Brügge-mann et al., 2011; Ghashghaie and Badeck, 2014), and via C isotope fractionation during decarboxylation in respiratory pathways (Werner and Gessler, 2011; Werner et al., 2011; Tcherkez et al., 2012). Accounting for isotope effects in plant respiratory C
20
losses improves our ability to quantify the contributions of different pools to CO
2fluxes
and thus our predictions of terrestrial ecosystem C budgets under changing environ-mental conditions. Usingδ13C of heterotrophically respired CO2holds similar promise, but if and how changing environmental conditions influence any fractionation factors for the fluxes associated with the liberation of C from SOM is unknown.
25
Significant uncertainty about the direction and magnitude of C isotope fractionation during microbial C transformations (Bowling et al., 2008; Werth and Kuzyakov, 2010) renders quantifying microbial CO2 fluxes in terrestrial ecosystems difficult. Difficulties
BGD
12, 17367–17392, 2015
Temperature-mediated changes in microbial carbon use
efficiency
C. A. Lehmeier et al.
Title Page
Abstract Introduction
Conclusions References
Tables Figures
◭ ◮
◭ ◮
Back Close
Full Screen / Esc
Printer-friendly Version
Interactive Discussion
Discussion
P
a
per
|
Discussion
P
a
per
|
Discussion
P
a
per
|
Discussion
P
a
per
|
substrates with distinctδ13C signatures (Park and Epstein, 1961; Billings, 2006), the respiration of which influences δ13C of respired CO2. Though we know the growth rate of microbial populations influences C flux into and through biomass (Kayser et al., 2005), it is impossible to directly quantify microbial growth in situ. Furthermore, ab-sence of steady state conditions over a course of soil CO2 flux measurements makes 5
the interpretation of temperature effects on the magnitude and theδ13C of soil
respira-tion an even greater challenge (Gamnitzer et al., 2011; Nickerson et al., 2013). Thus, establishing a mechanistic understanding of the links between temperature, microbial respiration rates and C isotope fractionation during substrate transformations at a fun-damental level requires that we characterize these processes as temperature changes 10
in isolation from other factors that influence microbial C transformations.
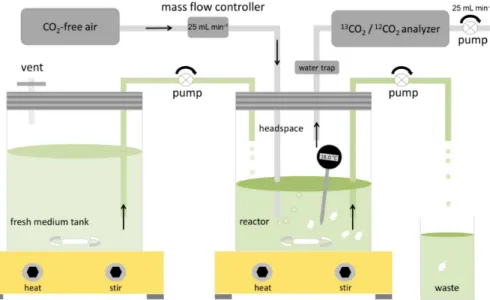
To assess the influence of temperature on microbial respiration rates, we grew a widely distributed Gram-negative, heterotrophic soil bacterium (Pseudomonas flu-orescens) in continuous culture bioreactors (chemostats; Ferenci, 2008; Bull, 2010) at seven temperatures ranging from 13 to 26◦C (Fig. 1). We measured microbial res-15
piration rates and δ13C of respired CO2 in this open flow through system at steady-state (Craig and Gordon, 1965; Fry, 2006). We computed the temperature
depen-dence of a widely applied metric of microbial C use efficiency (CUE), defined as
SGR/(SGR+SRR), where SGR and SRR are specific growth and specific respiration
rates respectively, with units of C per microbial biomass-C and time. Our simplified 20
system eliminates factors present in real soils that preclude accurate assessment of specific growth and respiration rates, and thus accurate estimates of CUE as defined above. Obtaining accurate estimates of microbial CUE is critical for projecting C fluxes into the future because the particular value of CUE significantly influences CO2 loss rates from soils in models of SOM decomposition (Allison et al., 2010; Wieder et al., 25
2013). Finally, simultaneously quantifying differences inδ13C of organic substrate,
BGD
12, 17367–17392, 2015
Temperature-mediated changes in microbial carbon use
efficiency
C. A. Lehmeier et al.
Title Page
Abstract Introduction
Conclusions References
Tables Figures
◭ ◮
◭ ◮
Back Close
Full Screen / Esc
Printer-friendly Version
Interactive Discussion
Discussion
P
a
per
|
Discussion
P
a
per
|
Discussion
P
a
per
|
Discussion
P
a
per
|
2 Materials and methods
2.1 Pre-cultivation of microorganisms for chemostat inoculation
We pre-cultivated Pseudomonas fluorescens (Carolina Biological Supply, USA) in
nutrient solution containing 10 mM NH4Cl, 1.6 mM KNO3, 2.6 mM K2HPO4, 1.0 mM KH2PO4, 0.8 mM MgSO4, 0.2 mM CaCl2, 0.1 mM CuCl2, 0.04 mM FeSO4, 0.03 mM 5
MnCl2and 0.02 mM ZnSO4, modified from Abraham et al. (1998). The sole C source in the nutrient medium was 10 mM cellobiose (C12H22O11; with a δ13C of −22.4 ‰); cellobiose is a disaccharide consisting of two glucose molecules and a basic module of cellulose. Thus, the C to N to P atomic ratio of the autoclaved, sterile nutrient solu-tion was 100 to 10 to 3.3; its pH was adjusted to 6.5. The bacteria grew for a few days 10
in batch culture in a flask fitted with a vent for air exchange covered by a 0.22 µm filter (Fisher Scientific, USA) to avoid contamination. Vessel contents were stirred continu-ously in an incubator maintained at 10◦C.
2.2 The laboratory mesocosm – the chemostat
The chemostat system was composed of two 1.9 L vessels, a medium reservoir tank 15
and a reactor, each maintained on separate heating/stirring plates (Fig. 1) in sepa-rate incubators. The reactor volume was on average 870 mL (Table S1 in the Sup-plement). The reservoir tank was connected via a flexible tube to the reactor (Tygon E-LFL pump tubing, Masterflex, USA), which in turn had an outlet tube (Fig. 1; both tubes had a 1.6 mm inner diameter). When the chemostat was operated in “contin-20
uous culture mode” a peristaltic pump transported fresh medium to the reactor and simultaneously removed medium from the reactor at the same rate. Thus, reactor vol-ume remained constant during all chemostat runs. The 0.22 µm filter in the reservoir tank lid allowed for pressure compensation during withdrawal of nutrient solution in the continuous flow mode. Experimental temperatures were continuously measured with 25
BGD
12, 17367–17392, 2015
Temperature-mediated changes in microbial carbon use
efficiency
C. A. Lehmeier et al.
Title Page
Abstract Introduction
Conclusions References
Tables Figures
◭ ◮
◭ ◮
Back Close
Full Screen / Esc
Printer-friendly Version
Interactive Discussion
Discussion
P
a
per
|
Discussion
P
a
per
|
Discussion
P
a
per
|
Discussion
P
a
per
|
was routinely compared against an internal laboratory standard mercury thermometer, before and at the end of each experiment. The reactor temperatures were adjusted with heating/stirring plate and incubator settings, and kept constant during all experimental runs.
The reactor lid had two ports for gas lines. The outlet port tube was connected to 5
a13CO2/12CO2analyzer (G2101-i, Picarro, USA) containing a pump that continuously removed air from the reactor headspace at an average rate of 0.025 L min−1. A
wa-ter trap (magnesium perchlorate, Costech, USA) was installed between outlet port of the reactor and the gas analyzer. The CO2 analyzer recorded the concentration and
the δ13C of the reactor headspace CO2 about once every two seconds. The
reac-10
tor’s inlet tube was connected to a mass flow controller (MC-50SCCM, Alicat Scientific, USA), which in turn, was connected to a gas cylinder containing CO2-free air (Fig. 1). The mass flow controller was programmed to maintain the reactor headspace at con-stant atmospheric pressure; thus, the 0.025 L min−1 headspace air removed by the
13
CO2/12CO2 analyzer pump was instantaneously replaced with CO2-free air flow-15
ing from the gas cylinder into the reactor medium. Considering (1) that 1 mol of O2 is consumed per 1 mol of CO2 produced in aerobic respiration, (2) a typical reactor
headspace CO2 concentration of around 2000 ppm at steady state (see Fig. 2a and
below), and (3) an O2concentration of 21 % in the air supply to the reactor, the air sup-ply permitted continuous aerobic metabolism. Routine tests with CO2-free air in sterile 20
chemostats were performed to ensure there were no leaks in the system.
2.3 The chemostat run – standardized protocol and description of events
We conducted seven independent chemostat runs, at temperatures of 13, 14.5, 16, 18, 21, 23.5 and 26.5◦C, in random temporal order. For each of the chemostat runs, we inoculated the reactor with a 10 mL aliquot of the P. fluorescens pre-culture and 25
BGD
12, 17367–17392, 2015
Temperature-mediated changes in microbial carbon use
efficiency
C. A. Lehmeier et al.
Title Page
Abstract Introduction
Conclusions References
Tables Figures
◭ ◮
◭ ◮
Back Close
Full Screen / Esc
Printer-friendly Version
Interactive Discussion
Discussion
P
a
per
|
Discussion
P
a
per
|
Discussion
P
a
per
|
Discussion
P
a
per
|
no flow of fresh nutrient medium from the reservoir tank to the reactor, and no removal of medium from the reactor (Fig. 1).
2.3.1 Respiration measurements at chemical and isotopic equilibrium in the continuous flow chemostat at steady-state
At the initial pH of 6.5, inorganic C in the fresh reactor medium was mainly in the form of 5
H2CO3(aq) and HCO−
3 (Stumm and Morgan, 1981). By continuously bubbling CO2-free
air into the reactor, we expelled these initial inorganic C pools from the reactor medium. This was evident by concentrations of reactor headspace CO2 of virtually zero in the early stages of batch culture after each run’s inoculation (Fig. 2a). During the phase of rising reactor headspace CO2 via respiratory activity of the exponentially growing 10
population (Fig. 2a), inorganic C in the reactor medium accrued with the increasing ad-dition of CO2from microbial respiration. That is, at any point in time during the phase of increasing reactor headspace CO2concentration, the nutrient medium acted as a sink for CO2.
Once the respiratory activity of the growing microbial population pushed the reactor 15
headspace CO2concentration above 500 ppm, we transferred the chemostat into the “continuous culture, open system” mode (Figs. 1 and 2; Ferenci, 2008; Bull, 2010). The peristaltic pump henceforth transported fresh nutrient medium from the reservoir tank to the reactor at a constant rate of, on average, 118 mL h−1 (Table S1), and simulta-neously removed medium from the reactor at the same rate so that the reactor vol-20
ume remained constant. Initial chemostat experiments indicated that when headspace CO2 concentrations reached 500 ppm, the bacterial population was sufficiently dense
to maintain itself without being washed out via medium flow. Depending on the reac-tor temperature, the onset of the continuous culture mode occurred between 40 h (at 26.5◦C) and 72 h (at 13◦C) after inoculation.
25
After the switch from batch to continuous culture, the rate of increase in reactor headspace CO2 concentration gradually slowed because cells were continuously
con-BGD
12, 17367–17392, 2015
Temperature-mediated changes in microbial carbon use
efficiency
C. A. Lehmeier et al.
Title Page
Abstract Introduction
Conclusions References
Tables Figures
◭ ◮
◭ ◮
Back Close
Full Screen / Esc
Printer-friendly Version
Interactive Discussion
Discussion
P
a
per
|
Discussion
P
a
per
|
Discussion
P
a
per
|
Discussion
P
a
per
|
centration became stable (Fig. 2a). At this point, bacteria grown in continuous culture had reached the phase of steady-state growth and physiology (see Ferenci, 2008; Bull, 2010). A key feature of the continuous culture chemostat relevant to our study is that at this steady-state, the constant dilution rate of the reactor (the medium flow rate divided by the reactor volume) is equivalent to the specific growth rate of the microbial culture 5
(Bull, 2010). That is, washout of cells with the nutrient medium flow is balanced by cell division so that the size of the population in the reactor can be expected to be reason-ably constant in the time frames employed here (see discussion in Ferenci, 2008; Bull, 2010).
Critically, when reactor headspace CO2concentrations approached the steady-state, 10
inorganic C pools came to their respective equilibria as well (Stumm and Morgan, 1981). At this point, pools of H2CO3(aq) and HCO−3 were no longer a net sink for respired CO2. As reactor headspace CO2 concentrations reached steady state, the system supported constant microbial CO2production reflective of steady-state growth under constant environmental conditions, and reflected chemical equilibrium (i.e., con-15
stant size) of the dissolved inorganic C pools. Thus, the rate of CO2 addition to the reactor headspace volume at steady-state accurately represented the CO2 released during microbial respiration.
We calculated the molar CO2 production rate of the microbial population
as the product of the average molar CO2 concentration measured by the
20
13
CO2/12CO2 analyzer for 5 h at steady state (Fig. 2a) multiplied by the
molar air flow rate through the reactor, which was calculated as air flow (mol min−1)=0.96 atm
·0.025 L min−1/(0.082 atm L mol−1K−1·296 K), with 0.96 atm and
296 K being the barometric pressure and the temperature in the lab where the ex-periments were performed, 0.025 L min−1the average volumetric headspace flow rate 25
through the reactor and 0.082 atm L mol−1K−1the gas constant.
BGD
12, 17367–17392, 2015
Temperature-mediated changes in microbial carbon use
efficiency
C. A. Lehmeier et al.
Title Page
Abstract Introduction
Conclusions References
Tables Figures
◭ ◮
◭ ◮
Back Close
Full Screen / Esc
Printer-friendly Version
Interactive Discussion
Discussion
P
a
per
|
Discussion
P
a
per
|
Discussion
P
a
per
|
Discussion
P
a
per
|
headspace CO2 became less negative as the CO2 concentration increased (Fig. 2b). During the “climbing” phase of the reactor headspace CO2, the δ13C of the CO2pool was influenced by isotopic fractionation among gaseous CO2, H2CO3(aq) and HCO−
3
(Vogel et al., 1970; Mook et al., 1974; Stumm and Morgan, 1981; Szaran, 1997), be-cause the dissolved inorganic C pools functioned as a net sink for respired CO2. At 5
steady-state, with constant headspace CO2 concentrations and constant size of the dissolved inorganic C pools (see above), isotopic equilibrium was achieved, evidenced by constantδ13C readings of reactor headspace CO2 (Fig. 2b). As such, in this open system at steady-state, the δ13C of the CO2 leaving the reactor (the CO2 measured by the analyzer) is identical to the δ13C of microbial respiration (Craig and Gordon, 10
1965; Fry, 2006). Importantly, this principle is valid irrespective of temperature, micro-bial growth rate or micromicro-bial biomass in the reactor. (See Supplement for an elaboration of the principle of chemical and isotopic equilibrium.)
We used the averageδ13C measurement of reactor headspace CO2over the same five hours in the stable phase employed for calculations of microbial respiration rates 15
(see above) as the isotopic signature of CO2respired by the microbial culture at each
temperature. Any measurements of headspace CO2 and δ13C during the climbing
phase before steady-state (Fig. 2) were not used in these calculations. For the example chemostat at 23.5◦C, the half-life of the reactor (t
1/2), i.e., the time
it took until 50 % of the reactor medium was exchanged with fresh tank medium, was 20
5.2 h (with t1/2=ln(2)/(medium flow rate/reactor volume); Table S1). In a
homoge-neous, well-mixed system such as that employed here, 95 % of the pool (i.e., the reac-tor) is exchanged with new medium within approximately five times the half-life. Thus, during the respiration measurements between time 70 and 74 h (in the example time course in Fig. 2), any “leftovers” from the batch culture mode were insignificant, and 25
the microbial culture could be considered homogeneous. This principle was applicable to all chemostat runs we performed.
BGD
12, 17367–17392, 2015
Temperature-mediated changes in microbial carbon use
efficiency
C. A. Lehmeier et al.
Title Page
Abstract Introduction
Conclusions References
Tables Figures
◭ ◮
◭ ◮
Back Close
Full Screen / Esc
Printer-friendly Version
Interactive Discussion
Discussion
P
a
per
|
Discussion
P
a
per
|
Discussion
P
a
per
|
Discussion
P
a
per
|
analyzer, and replaced the CO2-free air cylinder with a reference gas cylinder contain-ing 1015 ppm CO2 at a δ13C of −48.9 ‰ (Matheson, USA). This laboratory standard
gas was previously calibrated against secondary CO2 standards (Oztech, USA) and
served for any necessary corrections of theδ13C of the reactor headspace CO2 mea-surements. Across the seven standard measurement procedures after each individual 5
chemostat run, theδ13C measured for the laboratory standard gas showed only slight variation (1 SD=0.16 ‰). CO
2 concentration measurements needed no correction;
measurements of lab-internal gases with previously determined CO2 concentrations between chemostat runs showed very stable and accurate analyzer performance.
2.3.2 Measurements of extracellular enzyme activities at steady-state 10
Using principles detailed by Lehmeier et al. (2013) and Min et al. (2014), we tested reactor medium for activity of the extracellular enzymesβ-glucosidase andβ-N-acetyl glucosaminidase across all chemostat temperatures; we never detected extracellular activity of either enzyme. The lack of extracellularβ-glucosidase activity indicates that the C source of cellobiose was taken up by microbes and cleaved intracellularly into 15
glucose monomers for further metabolism. The lack of extracellular β-N-acetyl glu-cosaminidase activity suggests that the inorganic N provided in nutrient medium was the sole source of N taken up by P. fluorescens. These inferences strengthened our assumption that the sole resources used byP. fluorescenswere the cellobiose and the nutrient medium.
20
2.3.3 Harvest of microbial biomass at steady-state
Immediately after the 5 h respiration measurements, we filtered approximately 300 mL of reactor medium for steady-state microbial biomass using 0.2 µm filters (Pall, USA) and a vacuum pump. The filters had previously been oven-dried for 48 h at 75◦C and their dry weight determined. We then oven-dried the filters post filtration for 48 h at 75◦C 25
BGD
12, 17367–17392, 2015
Temperature-mediated changes in microbial carbon use
efficiency
C. A. Lehmeier et al.
Title Page
Abstract Introduction
Conclusions References
Tables Figures
◭ ◮
◭ ◮
Back Close
Full Screen / Esc
Printer-friendly Version
Interactive Discussion
Discussion
P
a
per
|
Discussion
P
a
per
|
Discussion
P
a
per
|
Discussion
P
a
per
|
an elemental analyzer (1110 CHN Combustion Analyzer, Carlo Erba Strumentazione, Italy) coupled to a ThermoFinnigan DeltaPlus mass spectrometer (Finnigan MAT, Ger-many) at the Keck Paleoenvironmental and Environmental Stable Isotope Laboratory (The University of Kansas, USA). We thus determined biomass C (and N) elemen-tal content, as well as the δ13C of the biomass. In this analysis, the samples were 5
compared against a laboratory standard CO2 previously calibrated against the same secondary CO2standards as used in calibration of the CO2standard used for respira-tion measurements (see above). Theδ13C of the substrate cellobiose was measured likewise. Dry weight of the sampled reactor aliquots and the C content obtained from elemental analysis served to calculate total microbial C content in the steady-state 10
reactor and to calculate specific respiration rates.
At all temperatures studied, C and N contents were virtually the same, on average 27 and 8 % of microbial dry mass, respectively (Table S1). From mass balance calcu-lations, we determined that only a small percentage of the C and N supplied via fresh medium from the tank was taken up to fuel microbial metabolism (1.8 and 4.3 % on av-15
erage for C and N, respectively). This suggests that the observed temperature effects
on specific respiration rates and CUE were not confounded by any differences in C and
N limitations at the different temperatures (Goldmann and Dennet, 2000; Cotner et al.,
2006; Chrzanowski and Grover, 2008).
3 Results and discussion 20
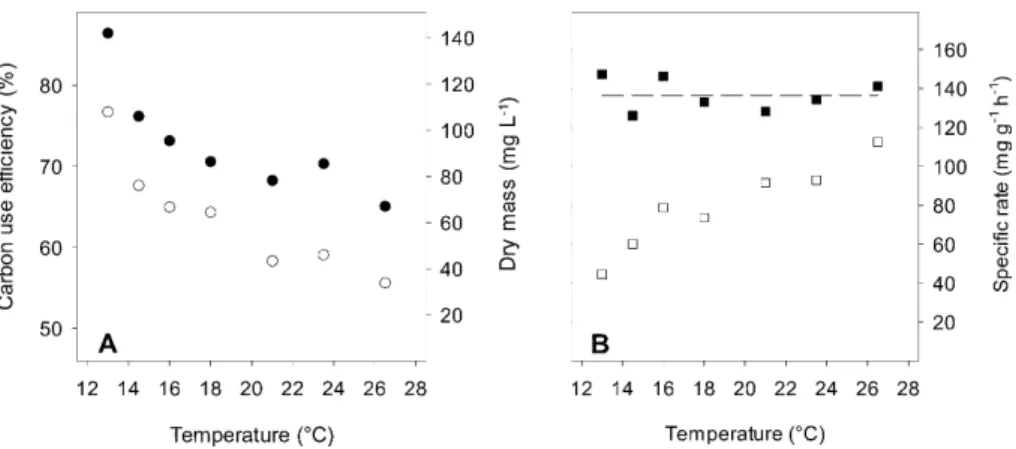
ForP. fluorescensgrown in continuous culture, CUE, defined as SGR/(SGR+SRR),
declined with increasing temperature, from 77 % at 13◦C to 56 % at 26.5◦C (Fig. 3a). Because specific growth rates were similar across the experimental temperatures (137 mg g−1h−1,
±8 (1 SD; Fig. 3b), the more than 50 % reduction in steady-state dry
microbial biomass with increasing temperature (Fig. 3a) was driven by the 2.5 fold 25
BGD
12, 17367–17392, 2015
Temperature-mediated changes in microbial carbon use
efficiency
C. A. Lehmeier et al.
Title Page
Abstract Introduction
Conclusions References
Tables Figures
◭ ◮
◭ ◮
Back Close
Full Screen / Esc
Printer-friendly Version
Interactive Discussion
Discussion
P
a
per
|
Discussion
P
a
per
|
Discussion
P
a
per
|
Discussion
P
a
per
|
secretion of organic acids or other compounds (El-Mansi and Holms, 1989; Nanchen et al., 2006), gross rates of cellobiose C uptake may have been slightly higher than what was calculated from the sum of SGR and SRR. However, the direct observation ofP. fluorescens’ CUE is consistent with the negative effect of increasing temperature
on microbial CUE widely reported in literature (del Giorgio and Cole, 1998; Gillooly 5
et al., 2001; Apple et al., 2006; Manzoni et al., 2012; Frey et al., 2013; Tucker et al., 2013).
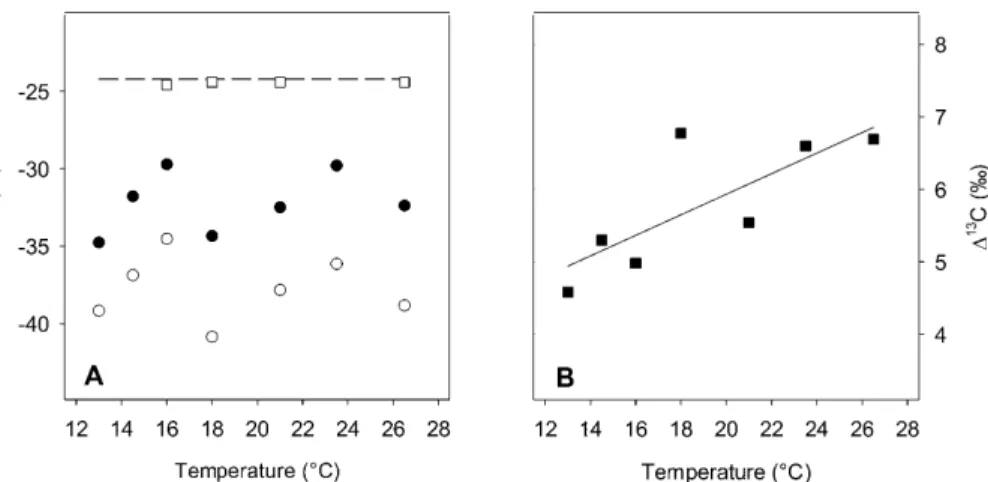
Across the chemostat runs, we observed strong C isotope fractionations, which cre-ated pronounced differences inδ13C between microbial biomass and the sole C
sub-strate, cellobiose, and between microbial biomass and respired CO2(Fig. 4). Microbial 10
biomass exhibited 5.5 to 10.5 ‰ more negative δ13C values than the cellobiose and
respired CO2 was even more 13C depleted, at least 4.4 ‰ more negative than the
biomass (Fig. 4a). Because each chemostat was at steady-state, isotopic mass bal-ance dictates that13C “missing” from cellobiose had to accumulate in another pool in the reactor. The only pool that could have been enriched with the “missing”13C was 15
reactor DOC, which we analyzed for δ13C in four out of the seven chemostat runs (Fig. 4a). Reactor DOC consisted of a large pool of cellobiose (because the rate of C consumption by the chemostat cultures was, on average, only 1.8 % of the rate of C supply) and presumably a pool of additional organic compounds such as acetate. Such compounds appear to be typically secreted from microbial cells at low rates in aerobic 20
chemostats operated at dilution rates similar to those of our runs (El-Mansi and Holms,
1989; Nanchen et al., 2006), and have been shown to be enriched in13C compared
to cellular biomass (Blair et al., 1985). However, because such a small fraction of the available cellobiose was taken up by P. fluorescens, the fraction of total DOC com-prised of secreted organic compounds was small. As a result,13C enrichment of any 25
microbial exudates was insufficient to enrich bulk DOC to an extent detectable by the
isotope-ratio mass spectrometer (Fig. 4a).
as-BGD
12, 17367–17392, 2015
Temperature-mediated changes in microbial carbon use
efficiency
C. A. Lehmeier et al.
Title Page
Abstract Introduction
Conclusions References
Tables Figures
◭ ◮
◭ ◮
Back Close
Full Screen / Esc
Printer-friendly Version
Interactive Discussion
Discussion
P
a
per
|
Discussion
P
a
per
|
Discussion
P
a
per
|
Discussion
P
a
per
|
sume that P. fluorescenssecreted organic compounds at a rate of 10 % of the sum
of SGR and SRR (El-Mansi and Holms, 1989) and that the bacteria did not discrimi-nate against13C-containing cellobiose during uptake (and thus assimilated cellobiose possessed aδ13C of−24.2 ‰), isotopic mass balance dictates that theδ13C of the C
secretion flux (Fig. 5) would have to be+70 ‰, at minimum, across all temperatures.
5
To our knowledge, such high metabolic discrimination against13C would be very un-usual for biological systems (O’Leary, 1981). An alternative and more likely scenario is therefore thatP. fluorescens took up less 13C-containing cellobiose than was sup-plied as substrate, and that discrimination during uptake contributed substantially to P. fluorescensbiomass and respired CO2being more13C depleted than the cellobiose 10
supplied. This conclusion holds for all temperatures studied. If we assume thatP. flu-orescensdid not discriminate against13C during secretion but only during uptake, the δ13C of the cellobiose taken up would have been, on average,−34.2 ‰, which is only
a 10 ‰ difference from the cellobiose provided, and therefore probably a more likely
scenario. 15
Substantial13C depletion of respired CO2 relative to microbial biomass has not, to our knowledge, been reported in other studies. With the microbial C consumption rate amounting to only 1.8 % of the rate of C supply, C availability was high compared to what soil microbes typically experience (Hobbie and Hobbie, 2013), potentially pro-moting enzymatic discrimination. Faster diffusion of isotopically lighter cellobiose may
20
have contributed to a lower probability of13C-containing cellobiose approaching bacte-rial membrane uptake sites, and hence, to the differences betweenδ13C of substrate
and biomass (Fig. 4a). However, isotope fractionation during diffusion – a physical
pro-cess dependent on compound mass – would likely exhibit a continuous temperature response. Thus, it seems unlikely that fractionation during diffusion was the primary
25
driver of the pronounced, discontinuous changes in the difference between substrate
and biomassδ13C, which ranged from 5.5 to 10.5 ‰ (Fig. 4a). Rather, this variation,
with one apparently linear part between 13 and 16◦C and another between 18 and
reorganiza-BGD
12, 17367–17392, 2015
Temperature-mediated changes in microbial carbon use
efficiency
C. A. Lehmeier et al.
Title Page
Abstract Introduction
Conclusions References
Tables Figures
◭ ◮
◭ ◮
Back Close
Full Screen / Esc
Printer-friendly Version
Interactive Discussion
Discussion
P
a
per
|
Discussion
P
a
per
|
Discussion
P
a
per
|
Discussion
P
a
per
|
tion of enzyme-mediated C fluxes into and out of bacterial cells (see Nanchen et al., 2006), induced by differences in temperature at whichP. fluorescenswas growing and
the related differences in substrate uptake rates.
The discontinuous pattern of δ13C of respired CO2 with temperature, similar to the pattern forδ13C of the biomass (Fig. 4a), presumably reflects the downstream conse-5
quence of an upstream change inδ13C of the metabolic substrate ultimately respired. However, the more negative δ13C of respired CO2 compared to that of biomass is, to our knowledge, the most direct evidence to date for13C discrimination during res-piration of a heterotrophic soil microbe. The observation of a substantial respiratory
13
C discrimination corroborates inferences drawn in earlier studies ( ˆSantrůčková et al.,
10
2000; Fernandez and Cadisch, 2003) and is also consistent with plant studies reporting C isotope discrimination during dark respiration in roots (Klumpp et al., 2005; Bathellier et al., 2009; Ghashghaie and Badeck, 2014). Our observations of respiratory discrim-ination against 13C highlight the similarity of heterotrophic, aerobic respiratory path-ways, and isotope effects within them, across life’s domains.
15
In contrast to the discontinuous relationship between biomass δ13C and tempera-ture, we observed a comparably continuous and linear increase in respiratory discrim-ination against13C with temperature (Fig. 4b). This increase generated a marginally positive significant (P =0.08) correlation with SRR (Fig. 6), and hence a marginally
significant (P =0.07) correlation with CUE. A physiological interpretation of this finding
20
is not straightforward, as multiple, possibly simultaneous enzymatic fractionations may have contributed to the observedδ13C of respired CO2(Dijkstra et al., 2011; Tcherkez et al., 2012). It could simply result from a proportionally increasing flux through res-piratory pathways, with associated stronger expression of 13C discrimination by the enzymes involved (Tcherkez et al., 2012), or could result from increasing temper-25
atures altering the relative fluxes through respiratory pathways (Chung et al., 1976; Wittmann et al., 2007; Dijkstra et al., 2011) such that the overall observed respiratory
13C discrimination increased with temperature. This may be possible given that
BGD
12, 17367–17392, 2015
Temperature-mediated changes in microbial carbon use
efficiency
C. A. Lehmeier et al.
Title Page
Abstract Introduction
Conclusions References
Tables Figures
◭ ◮
◭ ◮
Back Close
Full Screen / Esc
Printer-friendly Version
Interactive Discussion
Discussion
P
a
per
|
Discussion
P
a
per
|
Discussion
P
a
per
|
Discussion
P
a
per
|
references therein) and prompt different, specific C atoms to undergo decarboxylation
from the two glucose units of the substrate cellobiose, which contain non-randomly distributed13C atoms (Rossmann et al., 1991; Gleixner and Schmidt, 1997). If relative fluxes through different respiratory pathways changed with temperature, the continuous
nature of the relationship between temperature and respiratory13C discrimination sug-5
gests a smooth transition compared to the abrupt and discontinuous shifts in apparent uptake and/or secretion discrimination described above. Future metabolic flux analy-ses linked to isotopic approaches sensitive enough to quantify C isotopes in microbial exudation will be well-suited to explore how C allocation to distinct, aerobic respiratory pathways may vary with temperature and result in varyingδ13C of respired CO2. 10
4 Conclusions
Our observations clearly show a decline in microbial CUE with increasing temperature when C substrate is plentiful and demonstrate the mechanism driving it – an increase in SRR. The relationship between CUE and temperature underscores the importance of incorporating variable, temperature dependent SRR, which influences CUE, in ecosys-15
tem process models. The temperature-driven changes in SRR and respiratory discrim-ination against 13C were not independent of each other, suggesting that increasing SRR, to some degree, drives enhanced C isotopic discrimination. We demonstrate that C isotope discrimination associated with microbial decomposition of SOM can impart large and variable isotopic signatures on C pools typically characterized and interpreted 20
in biogeochemical studies at any scale. To date, efforts to partition flux components of
net ecosystem exchange have assumed little to no fractionation between respired sub-strates and the resultant CO2. Our results suggest that this assumption must be reeval-uated, and represent a first step towards an isotopically explicit, mechanistic framework for microbial C isotope fluxes in Earth system models.
BGD
12, 17367–17392, 2015
Temperature-mediated changes in microbial carbon use
efficiency
C. A. Lehmeier et al.
Title Page
Abstract Introduction
Conclusions References
Tables Figures
◭ ◮
◭ ◮
Back Close
Full Screen / Esc
Printer-friendly Version
Interactive Discussion
Discussion
P
a
per
|
Discussion
P
a
per
|
Discussion
P
a
per
|
Discussion
P
a
per
|
Data availability
The data presented in this study are available for collaborative use by anyone inter-ested; contact the corresponding author for access to the data.
The Supplement related to this article is available online at doi:10.5194/bgd-12-17367-2015-supplement.
5
Author contributions. C. A. Lehmeier and K. Min performed the experiments; all authors con-tributed to all other parts and stages of the manuscript.
Acknowledgements. We thank Susan Ziegler, Jarad Mellard and Chao Song for helpful dis-cussions during the design of the experiments, Greg Caine for expert stable isotope analysis and the provision of isotopic standards, Susan Ziegler, Mike Burrell, Karl Auerswald, Hans
10
Schnyder, Hanns-Ludwig Schmidt and John Kelly for comments on the manuscript, Gil Ortiz with assistance generating Fig. 5, and the National Science Foundation of the USA for funding (grant no. DEB-0950095).
References
Abraham, W.-R., Hesse, C., and Pelz, O.: Ratios of carbon isotopes in microbial lipids as an
15
indicator of substrate usage, App. Environ. Microbiol., 64, 4202–4209, 1998.
Allison, S. D., Wallenstein, M. D., and Bradford, M. A.: Soil-carbon response to warming depen-dent on microbial physiology, Nat. Geosci., 3, 336–340, 2010.
Apple, J. K., del Giorgio, P. A., and Kemp, W. M.: Temperature regulation of bacterial production, respiration, and growth efficiency in a temperate salt-marsh estuary, Aquat. Microb. Ecol., 43,
20
243–254, 2006.
Barbosa, Î. C. R., Köhler, I. H., Auerswald, K., Lüps, P., and Schnyder, H.: Last-century changes of alpine grassland water-use efficiency: a reconstruction through carbon isotope analysis of
BGD
12, 17367–17392, 2015
Temperature-mediated changes in microbial carbon use
efficiency
C. A. Lehmeier et al.
Title Page
Abstract Introduction
Conclusions References
Tables Figures
◭ ◮
◭ ◮
Back Close
Full Screen / Esc
Printer-friendly Version
Interactive Discussion
Discussion
P
a
per
|
Discussion
P
a
per
|
Discussion
P
a
per
|
Discussion
P
a
per
|
Bathellier, C., Tcherkez, G., Bligny, R., Gout, E., Cornic, G., and Ghashghaie, J.: Metabolic origin of theδ13C of respired CO2 in roots of Phaseolus vulgaris, New Phytol., 181, 387–
399, 2009.
Billings, S.: Soil organic matter dynamics and land use change at a grassland/forest ecotone, Soil Biol. Biochem., 38, 2934–2943, 2006.
5
Blair, N., Leu, A., Muñoz, E., Olsen, J., Kwong, E., and Des Marais, D.: Carbon isotopic fraction-ation in heterotrophic microbial metabolism, Appl. Environ. Microbiol., 50, 996–1001, 1985. Bowling, D. R., Pataki, D. E., and Randerson, J. T.: Carbon isotopes in terrestrial ecosystem
pools and CO2fluxes, New Phytol., 178, 24–40, 2008.
Brüggemann, N., Gessler, A., Kayler, Z., Keel, S. G., Badeck, F., Barthel, M., Boeckx, P.,
10
Buchmann, N., Brugnoli, E., Esperschütz, J., Gavrichkova, O., Ghashghaie, J., Gomez-Casanovas, N., Keitel, C., Knohl, A., Kuptz, D., Palacio, S., Salmon, Y., Uchida, Y., and Bahn, M.: Carbon allocation and carbon isotope fluxes in the plant-soil-atmosphere con-tinuum: a review, Biogeosciences, 8, 3457–3489, doi:10.5194/bg-8-3457-2011, 2011. Bull, A. T.: The renaissance of continuous culture in the post-genomics age, J. Ind. Microbiol.
15
Biot., 37, 993–1021, 2010.
Chrzanowski, T. H. and Grover, J. P.: Element content ofPseudomonas fluorescensvaries with growth rate and temperature: a replicated chemostat study addressing ecological stoichiom-etry, Limnol. Oceanogr., 53, 1242–1251, 2008.
Chung, B. H., Cannon, R. Y., and Smith, R. C.: Influence of growth temperature on glucose
20
metabolism of a psychrotrophic strain ofBacillus cereus, Appl. Environ. Microb., 31, 39–45, 1976.
Cotner, J. B., Makino, W., and Biddanda, B. A.: Temperature affects stoichiometry and
biochem-ical composition of Escherichia coli, Microb. Ecol., 52, 26–33, 2006.
Craig, H. and Gordon, L. I.: Deuterium and oxygen 18 variations in the ocean and the marine
25
atmosphere, in: Proceedings of a Conference on Stable Isotopes in Oceanographic Studies and Paleotemperatures, edited by: Tongiori, E., Lischi & Figli, Spoleto, Pisa, 9–130, 1965. del Giorgio, P. A. and Cole, J. J.: Bacterial growth efficiency in natural aquatic systems, Annu.
Rev. Ecol. Syst., 29, 503–541, 1998.
Dijkstra, F. A., Hobbie, S. E., Knops, J. M. H., and Reich, P. B.: Nitrogen stabilization and plant
30
species interact to influence soil carbon stabilization, Ecol. Lett., 7, 1192–1198, 2004. Dijkstra, P., Thomas, S. C., Heinrich, P. L., Koch, G. W., Schwartz, E., and Hungate, B. A.: Effect
BGD
12, 17367–17392, 2015
Temperature-mediated changes in microbial carbon use
efficiency
C. A. Lehmeier et al.
Title Page
Abstract Introduction
Conclusions References
Tables Figures
◭ ◮
◭ ◮
Back Close
Full Screen / Esc
Printer-friendly Version
Interactive Discussion
Discussion
P
a
per
|
Discussion
P
a
per
|
Discussion
P
a
per
|
Discussion
P
a
per
|
metabolic pathway activity but not for increased maintenance respiration and reduced carbon use efficiency, Soil Biol. Biochem., 43, 2023–2031, 2011.
El-Mansi, E. M. T., and Holms, W. H.: Control of carbon flux to acetate excretion during growth of
Escherichia coliin batch and continuous cultures, J. Gen. Microbiol., 135, 2875–883, 1989. Farquhar, G. D. and Richards, R. A.: Isotopic composition of plant carbon correlates with
water-5
use efficiency of wheat genotypes, Aust. J. Plant Physiol., 11, 539–552, 1984.
Farquhar, G. D., O’Leary, M. H., and Berry, J. A.: On the relationship between carbon isotope discrimination and the intercellular carbon dioxide concentration in leaves, Aust. J. Plant Physiol., 9, 121–137, 1982.
Ferenci, T.: Bacterial physiology, regulation and mutational adaptation in a chemostat
environ-10
ment, Adv. Microb. Physiol., 53, 169–230, 2008.
Fernandez, I. and Cadisch, G.: Discrimination against13C during degradation of simple and complex substrates by two white rot fungi, Rapid Commun. Mass Sp., 17, 2614–2620, 2003. Frey, S., Lee, J., Melillo, J. M., and Six, J.: The temperature response of soil microbial efficiency
and its feedback to climate, Nature Climate Change, 3, 395–398, 2013.
15
Fry, B.: Stable Isotope Ecology, Springer, New York, 2006.
Gamnitzer, U., Moyes, A. B., Bowling, D. R., and Schnyder, H.: Measuring and modelling the isotopic composition of soil respiration: insights from a grassland tracer experiment, Biogeo-sciences, 8, 1333–1350, doi:10.5194/bg-8-1333-2011, 2011.
Ghashghaie, J. and Badeck, F. W.: Opposite carbon isotope discrimination during dark
respira-20
tion in leaves versus roots – a review, New Phytol., 201, 751–769, 2014.
Gillooly, J. F., Brown, J. H., West, G. B., Savage, V. M., and Charnov, E. L.: Effects of size and
temperature on metabolic rate, Science, 293, 2248–2251, 2001.
Gleixner, G. and Schmidt, H.-L.: Carbon isotope effects on the fructose-1,6-bisphosphate
al-dolase reaction, origin for non-statistical13C distributions in carbohydrates, J. Biol. Chem.,
25
272, 5382–5387, 1997.
Goldman, J. C. and Dennet, M. R.: Growth of marine bacteria in batch and continuous culture under carbon and nitrogen limitation, Limnol. Oceanogr., 45, 789–800, 2000.
Hobbie, J. E. and Hobbie, E. A.: Microbes in nature are limited by carbon and energy: the starving-survival lifestyle in soil and consequences for estimating microbial rates, Front.
Mi-30
BGD
12, 17367–17392, 2015
Temperature-mediated changes in microbial carbon use
efficiency
C. A. Lehmeier et al.
Title Page
Abstract Introduction
Conclusions References
Tables Figures
◭ ◮
◭ ◮
Back Close
Full Screen / Esc
Printer-friendly Version
Interactive Discussion
Discussion
P
a
per
|
Discussion
P
a
per
|
Discussion
P
a
per
|
Discussion
P
a
per
|
Kayser, A., Weber, J., Hecht, V., and Rinas, U.: Metabolic flux analysis ofEscherichia coli in glucose-limited continuous culture. I. Growth-rate dependent metabolic efficiency at
steady-state, Microbiology, 151, 693–706, 2005.
Kirschbaum, M. U. F.: The temperature-dependence of organic-matter decomposition – still a topic of debate, Soil Biol. Biochem., 38, 2510–2518, 2006.
5
Klumpp, K., Schäufele, R., Lötscher, M., Lattanzi, F. A., Feneis, W., and Schnyder, H.: C-isotope composition of CO2respired by shoots and roots: fractionation during dark respiration?, Plant
Cell Environ., 28, 241–250, 2005.
Lehmeier, C. A., Min, K., Niehues, N. D., Ballantyne, F. I. V., and Billings, S. A.: Temperature-mediated changes of exoenzyme-substrate reaction rates and their consequences for the
10
carbon to nitrogen flow ration of liberated resources, Soil Biol. Biochem., 57, 374–382, 2013. Manzoni, S., Taylor, P., Richter, A., Porporato, A., and Ågren, G. I.: Environmental and
stoichio-metric controls on microbial carbon-use efficiency in soils, New Phytol., 196, 79–91, 2012.
Min, K., Lehmeier, C. A., Ballantyne, F., Tatarko, A., and Billings, S. A.: Differential effects of
pH on temperature sensitivity of organic carbon and nitrogen decay, Soil Biol. Biochem., 76,
15
193–200, 2014.
Mook, W. G., Bommerson, J. C., and Staverman, W. H.: Carbon isotope fractionation between dissolved bicarbonate and gaseous carbon dioxide, Earth Planet. Sc. Lett., 22, 169–176, 1974.
Nanchen, A., Schicker, A., and Sauer, U.: Nonlinear dependency of intracellular fluxes on
20
growth rate in miniaturized continuous cultures ofEscherichia coli, Appl. Environ. Microb., 73, 1164–1172, 2006.
Nickerson, N., Egan, J., and Risk, D.: Iso-FD: a novel method for measuring the isotopic signa-ture of surface flux, Soil Biol. Biochem., 62, 99–106, 2013.
O’Leary, M. H.: Carbon isotope fractionation in plants, Phytochemistry, 20, 553–567, 1981.
25
Park, R. and Epstein, S.: Metabolic fractionation of C13 & C12 in plants, Plant Physiol., 36, 133–138, 1961.
Pataki, D. E., Ehleringer, J. E., Flanagan, L. B., Yakir, D., Bowling, D. R., Still, C. J., Buchmann, N., Kaplan, J. O., and Berry, J. A.: The application and interpretation of Keeling plots in terrestrial carbon cycle research, Global Biogeochem. Cy., 17, 1022,
30
doi:10.1029/2001GB001850, 2003.
BGD
12, 17367–17392, 2015
Temperature-mediated changes in microbial carbon use
efficiency
C. A. Lehmeier et al.
Title Page
Abstract Introduction
Conclusions References
Tables Figures
◭ ◮
◭ ◮
Back Close
Full Screen / Esc
Printer-friendly Version
Interactive Discussion
Discussion
P
a
per
|
Discussion
P
a
per
|
Discussion
P
a
per
|
Discussion
P
a
per
|
ˆ
Santrůčková, H., Bird, M. I., and Lloyd, J.: Microbial processes and carbon-isotope fractionation
in tropical and temperate grassland soils, Funct. Ecol., 14, 108–114, 2000.
Schimel, D. S.: Terrestrial ecosystems and the carbon-cycle, Glob. Change Biol., 1, 77–91, 1995.
Stumm, W. and Morgan, J. J.: Aquatic Chemistry: An Introduction Emphasizing Chemical
Equi-5
libria in Natural Waters, John Wiley & Sons, New York, 1981.
Subke, J.-A., Inglima, I., and Cotrufo, M. F.: Trends and methodological impacts in soil CO2flux
partitioning: a metaanalytical review, Glob. Change Biol., 12, 921–943, 2006. Szaran, J.: Achievement of carbon isotope equilibrium in the system HCO−
3(solution)–CO2(gas),
Chem. Geol., 142, 79–86, 1997.
10
Tcherkez, G., Mahé, A., and Hodges, M.:12C/13C fractionations in plant primary metabolism, Trends Plant Sci., 16, 499–506, 2012.
Trumbore, S.: Carbon respired by terrestrial ecosystems – recent progress and challenges, Glob. Change Biol., 12, 141–153, 2006.
Tucker, C. L., Bell, J., Pendall, E., and Ogle, K.: Does declining carbon-use efficiency explain
15
thermal acclimation of soil respiration with warming?, Glob. Change Biol., 19, 252–263, 2013.
Vogel, J. C., Grootes, P. M., and Mook, W. G.: Isotopic fractionation between gaseous and dissolved carbon dioxide, Z. Phys., 230, 225–238, 1970.
Werner, C. and Gessler, A.: Diel variations in the carbon isotope composition of respired CO2
20
and associated carbon sources: a review of dynamics and mechanisms, Biogeosciences, 8, 2437–2459, doi:10.5194/bg-8-2437-2011, 2011.
Werner, R. A., Buchmann, N., Siegwolf, R. T. W., Kornexl, B. E., and Gessler, A.: Metabolic fluxes, carbon isotope fractionation and respiration – lessons to be learned from plant bio-chemistry, New Phytol., 191, 10–15, 2011.
25
Werth, M. and Kuzyakov, Y.:13C fractionation at the root-microorganisms–soil interface: a re-view and outlook for partitioning studies, Soil Biol. Biochem., 42, 1372–1384, 2010.
Wieder, W. R., Bonan, G. B., and Allison, S. D.: Global soil carbon projections are improved by modelling microbial processes, Nature Climate Change, 3, 909–912, 2013.
Wittmann, C., Weber, J., Betiku, E., Krömer, J., Böhm, D., and Rinas, U.: Response of fluxome
30
BGD
12, 17367–17392, 2015
Temperature-mediated changes in microbial carbon use
efficiency
C. A. Lehmeier et al.
Title Page
Abstract Introduction
Conclusions References
Tables Figures
◭ ◮
◭ ◮
Back Close
Full Screen / Esc
Printer-friendly Version
Interactive Discussion
Discussion
P
a
per
|
Discussion
P
a
per
|
Discussion
P
a
per
|
Discussion
P
a
per
|
Figure 1.Chemostat system comprised ofP. fluorescensgrowing on cellobiose. Seven inde-pendent experiments were conducted, with reactor temperatures of 13, 14.5, 16, 18, 21, 23.5 and 26.5◦C; all other conditions were identical. During continuous flow, dilution rate of the
reac-tor (mean=0.137±0.01 h−1 across all experiments) equals microbial growth rate. A peristaltic
pump supplied fresh nutrient medium from a reservoir tank to the reactor and removed reactor medium (including biomass) at a constant rate. Headspace volume was flushed with CO2-free
air, bubbling through reactor medium and supplying microorganisms with O2. A 13
CO2/ 12
CO2
BGD
12, 17367–17392, 2015
Temperature-mediated changes in microbial carbon use
efficiency
C. A. Lehmeier et al.
Title Page
Abstract Introduction
Conclusions References
Tables Figures
◭ ◮
◭ ◮
Back Close
Full Screen / Esc
Printer-friendly Version
Interactive Discussion
Discussion
P
a
per
|
Discussion
P
a
per
|
Discussion
P
a
per
|
Discussion
P
a
per
|
Figure 2.Example time course of the evolution of reactor headspace CO2concentration(a)and
δ13C of the CO2(b)of the chemostat run at 23.5◦C in hours since inoculation of the reactor with
pre-culturedP. fluorescens. Data points are hourly means. Error bars (where visible) denote
±1 SD. The reactor was shifted from batch to continuous culture mode 45 h after inoculation.
Microbial respiration rate and theδ13C of respired CO2were measured between 70 and 74 h
BGD
12, 17367–17392, 2015
Temperature-mediated changes in microbial carbon use
efficiency
C. A. Lehmeier et al.
Title Page
Abstract Introduction
Conclusions References
Tables Figures
◭ ◮
◭ ◮
Back Close
Full Screen / Esc
Printer-friendly Version
Interactive Discussion
Discussion
P
a
per
|
Discussion
P
a
per
|
Discussion
P
a
per
|
Discussion
P
a
per
|
Figure 3.Steady-state process variables ofP. fluorescensgrowing in chemostats at specified temperatures. Microbial carbon use efficiency (◦;a) dry microbial biomass (•;a), specific C
growth rate (;b), and specific C respiration rate (;b), expressed per unit of microbial
BGD
12, 17367–17392, 2015
Temperature-mediated changes in microbial carbon use
efficiency
C. A. Lehmeier et al.
Title Page
Abstract Introduction
Conclusions References
Tables Figures
◭ ◮
◭ ◮
Back Close
Full Screen / Esc
Printer-friendly Version
Interactive Discussion
Discussion
P
a
per
|
Discussion
P
a
per
|
Discussion
P
a
per
|
Discussion
P
a
per
|
Figure 4.Steady-state δ13C of microbial biomass (•; a) and of respired CO2 (◦;a), and
C isotope discrimination during respiration (∆13C; b) of P. fluorescens growing in
chemostats at specified temperatures. In(a), the dashed line denotes theδ13C of the substrate cellobiose (−24.2 ‰), andδ13C of reactor filtrate is shown as open squares.
∆13C is calculated as∆13C=(δ13C
biomass−δ13Crespired CO2)/(1+δ13Crespired CO2). The
solid line denotes linear regression of ∆13C vs. temperature (y =0.14x+3.1; R2=
BGD
12, 17367–17392, 2015
Temperature-mediated changes in microbial carbon use
efficiency
C. A. Lehmeier et al.
Title Page
Abstract Introduction
Conclusions References
Tables Figures
◭ ◮
◭ ◮
Back Close
Full Screen / Esc
Printer-friendly Version
Interactive Discussion
Discussion
P
a
per
|
Discussion
P
a
per
|
Discussion
P
a
per
|
Discussion
P
a
per
|
Figure 5. Schematic of an individual P. fluorescens cell, representing a population growing at steady-state, with measured (boxed) and unknown magnitudes of C and 13C fluxes into and out of the population. Designated fluxes include specific uptake rate of cellobiose (FSUR),
specific growth rate (FSGR), specific respiration rate (FSRR) and specific excretion rate (FSER),
in relation to steady-state biomass-C in the chemostat, where FSUR=FSGR+FSRR+FSER. In
BGD
12, 17367–17392, 2015
Temperature-mediated changes in microbial carbon use
efficiency
C. A. Lehmeier et al.
Title Page
Abstract Introduction
Conclusions References
Tables Figures
◭ ◮
◭ ◮
Back Close
Full Screen / Esc
Printer-friendly Version
Interactive Discussion
Discussion
P
a
per
|
Discussion
P
a
per
|
Discussion
P
a
per
|
Discussion
P
a
per
|
Figure 6.Correlation between the specific respiration rate of P. fluorescensgrowing in con-tinuous chemostat culture at temperatures ranging from 13 to 26.5◦C and the carbon
iso-tope discrimination during respiration. The dashed line denotes a linear regression of the form