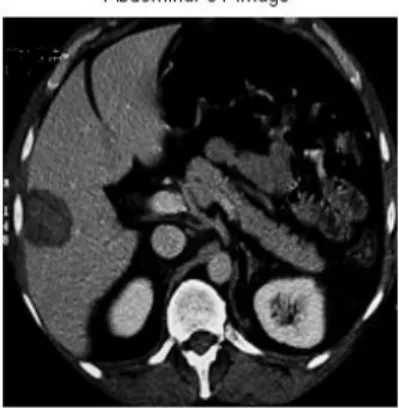
Diagnosis of Liver Tumor from CT Images using
Curvelet Transform
S. S. KUMAR
Assistant Professor,
Department of Electronics and Instrumentation Engg. Noorul Islam University, Kumaracoil
Thuckalay, India. kumar_s_s@hotmail.com
Dr. R. S. MONI
Professor,
Department of Electronics and Communication Engg. Noorul Islam University, Kumaracoil
Thuckalay, India
Abstract— In this paper, a computer-aided diagnostic (CAD) system for the diagnosis of benign and malignant liver tumors from computed tomography (CT) images is presented. Liver is segmented from abdominal CT images using adaptive threshold and morphological processing. Each suspicious tumor region is automatically extracted from the segmented liver using FCM technique and the textural information obtained using curvelet transform is used to train the classifier and classify the tumors. Two kinds of liver diseases are identified: hemangioma and hepatocellular carcinoma. Results obtained were evaluated with the help of radiologists. The system differentiates the tumor with relatively high accuracy and is therefore clinically useful.
Keywords-Liver Tumor, Texture analysis, Curvelet Transform,
I. INTRODUCTION
Liver diseases are considered seriously because of the liver's vital importance to human beings. Several distinct types of tumors can develop in the liver because the liver is made up of various cell types. These tumors can be benign or malignant (cancerous). The benign tumors of the liver seen most frequently include cavernous hemangioma, liver cell adenomas, and focal nodular hyperplasia (FNH).The malignant tumors of the liver seen most frequently are hepatocellular carcinoma, intrahepatic cholangiocarcinoma, Bile duct cystadenocarcinoma, and hepatoblastoma [1]. Computer-assisted liver tumor classification which is based on the image analysis techniques provides more useful information. The conventional methods for the liver tissue classification consist of three-step process. The first step involves the segmentation of liver and tumor from CT abdominal image. The second step is the feature extraction and the third step is classification using a classifier. The characterization of liver images based on texture analysis techniques have been developed over the years [3]-[7]. Wavelets are largely used in tumor detection. However, researchers [8]-[11] have shown that, although wavelets are very effective in representing objects with isolated point singularities these are not efficient to represent line
singularities. To alleviate the problem, ridgelet transform which deals with line singularities in 2-D was introduced [9]. But images often contain curves rather than straight lines, so Candes and Donoho [10] proposed another multiscale transform called curvelet transform, which handles curve discontinuities as well. In this paper, liver and tumor are automatically segmented from CT images, curvelet transform is applied to extract texture features of liver tumors and neural network classifier is used to classify the tumor as benign or malignant with high accuracy.
The paper is structured as follows: Section II describes in detail the automatic segmentation of liver and tumor from abdominal CT images. Section III describes the curvelet multiresolution texture analysis, Section IV describes the Classifier used for classification; Experimental results are presented in Section V and conclusion in Section VI.
II. LIVER AND TUMOR EXTRACTION
to it having intensity same as that of liver. The fragments of adjacent organs can be removed based on certain conditions like location and area of the liver using morphological processing [12]. After removing the fragments of other organs, the image obtained is complemented and multiplied with the original image to get the segmented liver.
From the segmented liver, tumor region is segmented using, FCM clustering technique [13]. FCM minimizes the object function through the iterative optimization of the membership function based on the similarity between the data and the center of a cluster. FCM varies the threshold between clusters through an iterative process. As a result, the threshold is determined appropriately for every slice and the tumor region can be successfully extracted. Jm (U, v) is
the object function and uik is the membership function, are
defined using the equations (1) and (2)
2
)
(
)
(
)
,
(
1 1 ik m n k c l ikm
U
v
u
d
J
(1)Where,
c j m jk ik ikd
d
u
1 ) 1 ( 2)
(
1
(2)d2ik is the distance between the kth data (pixel value) and the
center of the ith cluster and vi denotes the center value of the ith
cluster, which are defined by equations (3) and (4) as follows:
i k
ik
X
V
d
2
(3)
n k m ik k n k m ik iu
x
u
v
1 1)
(
)
(
(4)where xk is the intensity of the kth pixel, n is the number of
data (pixels), c is the number of clusters, and m is the exponent weight. The pixels of the input image are divided into three clusters. The pixels in the background (low intensity) are included in the first cluster. The second cluster includes pixels in the tumor region (medium intensity) and the pixels in the liver region other than tumor (high intensity) are included in the third cluster. The tumor region is output for further analysis.
III. CURVELET BASED TEXTURE FEATURE EXTRACTION
Candes and Donoho proposed a multiscale transform called curvelet transform to represent curve discontinuities as well [10]. Curvelet transform has a highly redundant dictionary which can provide sparse representation of signals that have edges along regular curve. Curvelet transform partitions the
curves into a collection of ridge fragments and then uses ridgelet transform to represent each fragment.
Implementation of the curvelet transform involves following steps [10], [11]:
Sub-band Decomposition: The image is first decomposed into log2M (M is the size of the image) wavelet sub-bands and then Curvelet Sub-bands are formed by performing partial reconstruction from these wavelet sub-bands at various levels.
Smooth Partitioning: Each subband is smoothly windowed in to ‘squares’ of an appropriate scale.
Renormalization: Each resulting square is renormalized to unit scale.
Ridgelet Analysis: Ridgelet transform [9] is performed on each square resulting from the previous stage.
In the proposed method the tumor images used are of size 256 x 256. We use discrete wavelet transform to initially decompose the image in to 3 levels which gives 8 wavelet subbands(j=0,1,2,3,4,5,6,7) . Curvelet subbands are formed by partial reconstruction from these wavelet subbands at levels jε{2s, 2s+1}. Thus the curvelet subband, s=1 corresponds to wavelet subbands j=0,1,2,3; curvelet subband, s =2 corresponds to wavelet subbands j=4,5 and curvelet subband, s=3 corresponds to wavelet subbands j=6,7. Curvelet subband s=1 is a lowpass band while s=2 and s=3 are high pass bands. The curvelet subbands are divided into blocks and renormalized to unit scale. The subbands, s=2 is subdivided in to an eight-by-eight array of squares, while subband, s=3 is subdivided in to a sixteen-by-sixteen array of squares. Ridgelet transform is applied on each square from the previous stages of s=2 and s=3, which gives an array of size 256x256x2 containing coefficients for each bands. Now to the coefficients present in s=1,2,3 curvelet subbands, features like mean, standard deviation, energy and entropy are calculated and stored as a feature vector. This feature vectors obtained for all the images are fed to the classifier for classification.
IV. CLASSIFICATION
V. EXPERIMENTAL RESULTS
In this paper, the liver tumors are classified as benign (hemangioma) and malignant (hepatocellular carcinoma). “Fig. 1”, shows an abdominal CT scan image of a patient with liver tumor. The liver is located along the left half of the image. Plot of the image with liver intensity marked is shown in “Fig 2”. With the help of adaptive threshold decision and morphological operations the liver is segmented from CT image. The segmented liver is shown in “Fig. 3” and “Fig. 4”. The tumor is extracted from the segmented liver by applying Fuzzy C Means Clustering Technique. The extracted tumor is shown in “Fig. 5”.
Figure 1. The abdominal CT image
Figure 2. Plot showing liver intensity
Figure 3. Outlined Liver
Figure 4. Segmented Liver
Figure 5. Segmented Tumor
as benign and malignant. The input dataset of 70 images are grouped in to two groups of training set and testing set with 35 datasets each. A set of 20 hemangioma and 15 hepatocellular carcinoma were used for training the network, and another set of 20 hemangioma and 15 hepatocellular carcinoma where used for testing the classifier. The confusion matrix and ROC curves for curvelet based classification are shown in “Fig. 6” and “Fig. 7”.
In “Fig. 6” class 1 represents hepatocellular carcinoma and class 2 represents hemangioma. The diagonal cells in each table show the number of cases that were correctly classified, and the off-diagonal cells show the misclassified cases. The cell in the bottom right shows the total percent of correctly classified cases (top) and it is 94.3% and the total percent of misclassified cases (bottom) which is 5.7%. 13 of the 15 hepatocellular carcinoma cases have been correctly classified. 20 of the 20 hemangioma cases were classified correctly. But 2 cases of hepatocellular carcinoma were wrongly classified as hemangioma. But there was no misclassification in hemangioma cases. The results show very good recognition.
Figure 6. Confusion Matrix of Curvelelt Based Method
Figure 7. ROC curve of Curvelet Based method
In order to evaluate the performance of the proposed method, its performance measures were compared with the measures derived from wavelet based method. For this the feature vectors were derived from the tumor images using wavelet transform with three levels of decomposition and classified using the same neural classifier. For the wavelet based method the confusion matrix and ROC curve are shown in “Fig. 8” and “Fig. 9”.
In “Fig. 8” class 1 represents hepatocellular carcinoma and class 2 represents hemangioma. The diagonal cells in each table show the number of cases that were correctly classified, and the off-diagonal cells show the misclassified cases. The cell in the bottom right shows the total percent of correctly classified cases (top) and it is 88.6% and the total percent of misclassified cases (bottom) which is 11.4%. 12 of the 15 hepatocellular carcinoma cases have been correctly classified. 19 of the 20 hemangioma cases were classified correctly. 3 cases of hepatocellular carcinoma were wrongly classified as hemangioma and 1 hemangioma was wrongly classified as hepatocellular carcinoma.
Figure 8. Confusion Matrix of Wavelet Based Method
Figure 9. ROC curve of Wavelet based method
TABLE I. PERFORMANCE MEASURES
Type
Measures
Accuracy Specificity Sensitivity Precision
Curvelet 94.3% 100% 87% 100%
Wavelet 88.6% 95% 80% 92%
Table 1 gives the various performance measures calculated from the confusion matrix of both curvelet and wavelet based methods. The results shows that the curvelet-based texture features outperform wavelet-based descriptors in classifying liver tumors from CT images. The accuracy of classification of tumors using curvelet based texture features extraction is 94.3% while it is only 88.6% using wavelet based method. The graphical comparisons of accuracies of both methods are shown in “Fig. 10”. It is clear that the curvelet-based tumor classification have significantly higher performance measures, with accuracy rates 5.7% higher than wavelet based method. This was expected due to the fact of sparse representation of images using curvelet transform. Ridgelet transform a step in the implementation of curvelet transform handles the coefficients with all possible directions. So images containing curves can be handled with curvelet transform. As a result the features obtained from the curvelet subbands will have powerful information compared to the features from wavelet subbands, which are effectively used for tumor diagnosis.
Wavelet, 88.6 Curvelet,
94.3
85 86 87 88 89 90 91 92 93 94 95
Type
A
ccu
racy
Figure 10. Classification Performance
VI. CONCLUSION
In this paper we proposed a computer-aided diagnostic system for the diagnosis of benign and malignant liver tumors from computed tomography (CT) images using curvelet transform based multi-resolution texture feature extraction and neural network. Two kinds of liver diseases were identified including hepatocellular carcinoma and cavernous hemangioma. The experiment results show that the classification accuracy of curvelet based diagnosis is higher than the wavelet based method. The performance can be increased more by increasing the number of samples. The proposed system can be extended for diagnosis of other types of liver diseases.
REFERENCES
[2] Pavlopoulos, S. Kyriacou, E. Koutsouris, D. Blekas, K. Stafylopatis, A. Zoumpoulis, P., ‘Fuzzy Neural Network-based Texture Analysis of Ultrosonic Images”, IEEE Engineering in Medicine and Biology, pp.39-47, 2000.
[3] E-Liang Chen, Pau-CHoo Chung, Ching-Liang Chen, Hong-Ming Tsai and Chein I Chang, “An Automatic Diagnostic system for CT Liver Image Classification”, IEEE Transactions Biomedical Engineering, vol 45, no. 6, pp. 783-794, June 1998.
[4] Jae-Sung Hong, Toyohisa Kaneko, Ryuzo Sekiguchi and Kil-Houmpark, “Automatic Liver Tumor Detection from CT”, IEICE Trans. Inf.& Syst.,Vol. E84-D, No. 6, pp 741-748, June 2001.
[5] Gletsos Miltiades, Stavroula G Mougiakakou, George K. Matsopoulos, Konstantina S Nikita, Alexandra S Nikita, Dimitrios Kelekis, “A Computer-Aided Diagnostic System to Characterize CT Focal Liver Lesions: Design and Optimization of a Neural Network Classifier,” IEEE Transactions on Information Technology in BioMedicine, Vol 7, Issue 3, pp 153 – 162, Sep. 2003.
[6] Chien Cheng Lee, Pau-Choo Chung, Hong-Ming Tsai, “Identifying Abdominal organs from CT image series using a Multimodule Contextual Neural network and Spatial Fuzzy rules”, IEEE Transactions on Information Technology in Biomedicine, vol 7, no. 3, pp. 208-217, Sep. 2003.
[7] Yu-Len Huang, Jeon-Hor Chen, Wu-Chung Shen “Computer-Aided Diagnosis of Liver Tumors in Non-enhanced CT Images” Department of Computer Science and Information Engineering, Tunghai University, Mid Taiwan, Journal of Medical Physics, Vol. 9, pp. 141-150, 2004.
[8] Minh N. Do and Martin Vetterli, “The finite Ridgelet transform for image reprsentation,” IEEE Transactions on Image Processing,” vol. 12, no.1, pp. , Jan. 2003.
[9] Candes J., “Ridgelets: theory and applications,” Ph.D. thesis, Department of Statitics, Stanford University, 1998.
[10] Candes, E. J. & Donoho, D. L., Curvelets, “Multi-resolution Representation, and Scaling Laws”, Wavelet Applications in Signal and Image Processing VIII, SPIE 4119, (2000).
[11] J. L. Starck, E. Candes, D. L. Donoho, “The curvlet transfrom for image denoising,” IEEE Transactions on Image Processing, vol.11, no.6 pp. 670-684, June 2002.
[12] Robert M Haralick, Stanely R Sternberg and Xinhua Zhuang, “Image analysis using Mathematical Morphology”, IEEE Transactions on Pattern Analysis and Machine Intelligence, vol. PAMI-9, no. 4, pp.532-549, July, 1987.
[13] Weijie Chen, Maryellen L. Giger, and Ulrich Bick,“A fuzzy c-means (FCM)-based approach for computerized segmentation of breast lesions in dynamic contrast-enhanced MR images.” Academic Radiology, Vol 13, No 1, January 2006.
[14] H. Sujana, S. Swarnamani, and S. Suresh, “Application of artificial neural networks for the classification of liver lesions by image texture parameters,” Ultrasound in Medicine and Biology, vol. 22, no. 9, pp. pp. 1177–1181, Sept. 1996.