ACPD
4, 1203–1246, 2004Real-time measurements of inorganic gases and
aerosol species
I. Trebs et al.
Title Page
Abstract Introduction
Conclusions References
Tables Figures
◭ ◮
◭ ◮
Back Close
Full Screen / Esc
Print Version Interactive Discussion
©EGU 2004
Atmos. Chem. Phys. Discuss., 4, 1203–1246, 2004 www.atmos-chem-phys.org/acpd/4/1203/
SRef-ID: 1680-7375/acpd/2004-4-1203 © European Geosciences Union 2004
Atmospheric Chemistry and Physics Discussions
Real-time measurements of ammonia,
acidic trace gases and water-soluble
inorganic aerosol species at a rural site in
the Amazon Basin
I. Trebs1, F. X. Meixner1, J. Slanina2, R. Otjes2, P. Jongejan2, and M. O. Andreae1
1
Max Planck Institute for Chemistry, Biogeochemistry Department, P. O. Box 3060, 55020 Mainz, Germany
2
Energy Research Center of the Netherlands, Department of Air Quality, 1755 ZG Petten, The Netherlands
ACPD
4, 1203–1246, 2004Real-time measurements of inorganic gases and
aerosol species
I. Trebs et al.
Title Page
Abstract Introduction
Conclusions References
Tables Figures
◭ ◮
◭ ◮
Back Close
Full Screen / Esc
Print Version Interactive Discussion
©EGU 2004
Abstract
We measured the mixing ratios of ammonia (NH3), nitric acid (HNO3), nitrous acid
(HONO), hydrochloric acid (HCl), sulfur dioxide (SO2) and the corresponding
water-soluble inorganic aerosol species, ammonium (NH+4), nitrate (NO−3), nitrite (NO−2),
chlo-ride (Cl−) and sulfate (SO24−), and their diel and seasonal variations at a pasture site in
5
the Amazon Basin (Rond ˆonia, Brazil). This study was conducted within the framework of LBA-SMOCC (Large Scale Biosphere Atmosphere Experiment in Amazonia Smoke Aerosols, Clouds, Rainfall and Climate). Sampling was performed from 12 Septem-ber to 14 NovemSeptem-ber 2002, extending from the dry season (extensive biomass burning activity), through the transition period to the wet season (background conditions).
Mea-10
surements were made continuously using a wet-annular denuder in combination with a Steam-Jet Aerosol Collector (SJAC) followed by suitable on-line analysis. A detailed description and verification of the inlet system for simultaneous sampling of soluble gases and aerosol compounds is presented. Overall measurement uncertainties of the ambient mixing ratios usually remained below 15%. The limit of detection (LOD)
15
was determined for each single data point measured during the field experiment.
Me-dian LOD values (3σ-definition) were ≤0.015 ppb for acidic trace gases and aerosol
anions and≤0.118 ppb for NH3 and aerosol NH+4. Mixing ratios of acidic trace gases
remained below 1 ppb throughout the measurement period, while NH3 levels were an
order of magnitude higher. Accordingly, mixing ratios of NH+4 exceeded those of other
20
inorganic aerosol contributors by a factor of 4 to 10. During the wet season, mixing ratios decreased by nearly a factor of 3 for all compounds compared to those observed when intensive biomass burning took place. Additionally, N-containing gas and aerosol species featured pronounced diel variations. This is attributed to strong relative hu-midity and temperature variations between day and night as well as to changing
pho-25
ACPD
4, 1203–1246, 2004Real-time measurements of inorganic gases and
aerosol species
I. Trebs et al.
Title Page
Abstract Introduction
Conclusions References
Tables Figures
◭ ◮
◭ ◮
Back Close
Full Screen / Esc
Print Version Interactive Discussion
©EGU 2004
1. Introduction
Every year, large emissions of aerosols and trace gases occur during the dry sea-son (May through September) in the Amazon Basin from widespread biomass burning activity. Smoke from biomass burning leads to a significant increase in cloud con-densation nuclei (CCN) concentration causing alteration of cloud properties. This is
5
likely to have considerable impact on the large-scale dynamics of the atmosphere (An-dreae et al., 2002; Roberts et al., 2001). During the wet season, however, background conditions resemble CCN concentrations more typical of marine locations than most continental sites (Roberts et al., 2001). Both, water-soluble inorganic aerosol species and soluble gases are expected to play a major role in the nucleation and growth of
10
cloud droplets under polluted as well as under clean conditions.
Ammonia (NH3), in the tropics mostly emitted by combustion processes,
volatiliza-tion from manure and fertilizer applicavolatiliza-tion, plays a key role in neutralizing acidic atmo-spheric compounds (Asman et al., 1998). Due to heterogeneous reactions involving
gaseous NH3 as well as sulfur dioxide (SO2), non-volatile aerosol constituents like
15
(NH4)2SO4and NH4HSO4can be formed.
Moreover, the abundance of semi-volatile aerosol species such as NH4NO3 and
NH4Cl is strongly dependent on the gas phase precursors, NH3, HNO3 and HCl.
HNO3and NH3 exist in equilibrium with solid ammonium nitrate (NH4NO3) at relative
humidities below its deliquescence (61.8% at 25◦C) (Stelson and Seinfeld, 1982) while
20
at relative humidities above deliquescence, NH4NO3will be found in the aqueous state
(Seinfeld and Pandis, 1998). Comparably, gaseous NH3 and HCl are precursors for
the reversible formation of NH4Cl (Pio and Harrison, 1987). These thermodynamic
equilibria are strongly dependent on relative humidity and temperature, such that low temperature and high relative humidity will shift the equilibrium to the aerosol phase.
25
Nitrous acid (HONO) is of atmospheric importance due to its expected significant contribution to the production of OH radicals. Rapid HONO photolysis can lead to an
ACPD
4, 1203–1246, 2004Real-time measurements of inorganic gases and
aerosol species
I. Trebs et al.
Title Page
Abstract Introduction
Conclusions References
Tables Figures
◭ ◮
◭ ◮
Back Close
Full Screen / Esc
Print Version Interactive Discussion
©EGU 2004
therein). The observation of persistent daytime HONO (up to 150 ppt) was found by several investigators and it is expected to be formed due to heterogeneous reaction of
NO2with surface water (Harrison and Kitto, 1994; Zhou et al., 2002; Alicke et al., 2003;
Aumont et al., 2003; Genfa et al., 2003; Kleffmann et al., 2003).
Since the 1970’s, adequate sampling of gaseous compounds and related
semi-5
volatile aerosol species was recognized as a significant problem, especially with
re-spect to the collection of HNO3, nitrate (NO−3), but also NH3, ammonium (NH+4),
chlo-ride (Cl−) and sulfate (SO24−) (Appel and Tokiwa, 1981; Appel et al., 1984; Slanina et
al., 1992; Appel, 1993; Cheng and Tsai, 1997). In particular, HNO3 measurements
without interferences are very difficult, since this molecule can readily absorb on
sur-10
faces of inlets (Appel et al., 1988; Neuman et al., 1999) and sampling substrates (e.g. filter materials) (Appel et al., 1984). Furthermore, desorption and re-evaporation of
HNO3 from inlet surfaces or sampling substrates may considerably bias sampling
re-sults. The collection of aerosol species on filter materials without pre or after-stages to trap gaseous compounds leads to significant artifacts (Slanina et al., 2001). Long
sam-15
pling times (hours to days) to collect sufficient aerosol on the filter material may result
either in evaporation of semi-volatile aerosol species (negative artifact) or to collection
of gaseous compounds (such as NH3, HNO3, HCl and SO2) which may be retained by
filter media (positive artifact).
To date there are no reliable measurements of NH3 and acidic trace gases (HNO3,
20
HONO, HCl, and SO2) from the Amazon Basin, and in the past inorganic aerosol
species were usually sampled by filter methods without accounting for possible arti-facts. High temperatures and relative humidities (close to 100% at nighttime) are typ-ical for this troptyp-ical region, which may significantly influence gas-aerosol partitioning processes. During the wet season, conditions usually remain very clean (low aerosol
25
ACPD
4, 1203–1246, 2004Real-time measurements of inorganic gases and
aerosol species
I. Trebs et al.
Title Page
Abstract Introduction
Conclusions References
Tables Figures
◭ ◮
◭ ◮
Back Close
Full Screen / Esc
Print Version Interactive Discussion
©EGU 2004
Therefore, we applied the combination of a wet-annular denuder (WAD) and a Steam-Jet aerosol collector (SJAC) (Wyers et al., 1993; Slanina et al., 2001) followed by on-line analysis using ion chromatography (IC) and ammonium flow injection analysis (FIA). Here, we report the application of a sophisticated inlet system for simultaneous sampling of gas and aerosol species verified for potential sampling losses (particularly
5
HNO3). Furthermore, an evaluation of the measurement performance of the instrument
(with particular emphasis on measurement uncertainty and limit of detection) and first results of seasonal and diel variations of the measured species are presented.
2. Available measurement methods
Table 1 gives an overview of the most common sampling methods for the collection of
10
inorganic gas and aerosol species with selected references.
The filter-pack method, usually with Teflon, Nylon or impregnated filters in series, is the least accurate, but simplest and most commonly used sampling procedure (Appel,
1993). This technique is laborious, and suffers from long sampling times as well as
possible interference due to oxidation of nitrites collected on nylon filters, which may
15
positively bias HNO3collection (Perrino et al., 1988). Also, evaporation of aerosol NO−3
from Teflon filters has been reported (Appel et al., 1981).
The most substantial approach for sampling a gas in the presence of corresponding
aerosol particles is the denuder technique. Dry-coated diffusion denuders are reliable,
but laborious and provide only long time-average concentration measurements
(Das-20
gupta, 1993). These drawbacks were overcome by various other developments.
Si-mon et al. (1991) have proposed four different designs for wet effluent diffusion
denud-ers coupled to ion chromatography systems with continuously renewed collection
sur-faces. Efficient retention of trace gases and a higher time resolution may be achieved
by parallel-plate denuders coupled to on-line analysis. Keuken et al. (1989) developed
25
an automated thermodenuder system for the determination of NH3 in ambient air. A
ACPD
4, 1203–1246, 2004Real-time measurements of inorganic gases and
aerosol species
I. Trebs et al.
Title Page
Abstract Introduction
Conclusions References
Tables Figures
◭ ◮
◭ ◮
Back Close
Full Screen / Esc
Print Version Interactive Discussion
©EGU 2004
to maintain near-quantitative collection efficiencies at high sampling rates within a
com-pact design (Dasgupta, 1993). The first WAD operating in batch mode was reported by Keuken et al. (1988) and a continuously rotating annular denuder was first described
by Wyers et al. (1993). Diffusion scrubber and mist chamber techniques also provide
measurements with higher time resolution and are little sensitive to artifacts.
5
Although the replacement of filter-based methods by continuous denuder devices and optical measurement techniques (also listed in Table 1) was a positive development in the last decade, usually these methods are only capable of measuring either one single compound or species of the same physical state (i.e. either gas or aerosol). The combination of new aqueous phase aerosol collectors with the denuder technique is up
10
to date the only approach for the simultaneous collection of gas and aerosol species. Usually, these methods are continuous, followed by on-line analysis of the resulting aqueous solution. On-line IC has become the major analytical tool for these sampling systems, being able to measure ambient concentrations continuously in the low two-digit ppt range.
15
3. Experimental
3.1. Site description
Sampling was performed at a pasture site in the state of Rond ˆonia, Brazil (Fazenda
Nossa Senhora Aparecida, FNS, 10◦45’44” S, 62◦21’27” W, 315 m asl). Clearing of rain
forest by fire in Rond ˆonia has taken place since 1968, creating a typical “fishbone”-like
20
pattern of plantations, pastures, degraded land and forest patches (see Andreae et al.,
2002). The vegetation at FNS is dominated by grass (Brachiaria brizantha) with small
patches ofBrachiaria humidicolaand very few isolated palms and bushes, and the site
is used as a cattle ranch (∼200 “Blanco” cattle,Bos indicus hybrid). Nearby the site,
flat hills (300 to 440 m) are located in distances of 3 to 4 km. The pasture is a rural,
25
ACPD
4, 1203–1246, 2004Real-time measurements of inorganic gases and
aerosol species
I. Trebs et al.
Title Page
Abstract Introduction
Conclusions References
Tables Figures
◭ ◮
◭ ◮
Back Close
Full Screen / Esc
Print Version Interactive Discussion
©EGU 2004
towns Ouro Preto d’Oeste (∼40 800 inhabitants) and Ji-Paran ´a (∼110 000 inhabitants)
are situated approximately 13 km and 40 km to the WSW of the site, respectively. The site is characterized by small seasonal temperature variations, ranging from
23–24◦C at the end of the wet season (June/July) to 25–26◦C during the dry season
(September/October). Annual relative humidity values are high, with averages of about
5
70% in the dry season and 80% during the wet season. Prevailing wind speeds are
relatively low (daily average∼1.5 m s−1) with a minimum during nighttime. Precipitation
in this region shows a seasonal cycle with lowest values in July and is highest from
November to April (up to ∼300 mm per month) (Andreae et al., 2002). A detailed
description of the history of the site can be found in Kirkman et al. (2002).
10
Instrumentation for sampling and on-line analysis was arranged in a wooden house with several air conditioned laboratories. The house was surrounded by a fence
(dis-tance to the house∼10 m) to prevent cattle from approaching the sampling and
mea-surement location.
3.2. Inlet system
15
3.2.1. Design
The sampling performance of the wet-annular denuder/steam-jet aerosol collector (WAD/SJAC) and the quality of the on-line analysis are strongly dependent on envi-ronmental parameters (i.e. air temperature and relative humidity). In order to provide controlled conditions for sampling and particularly for IC and FIA (i.e. minimal
fluctua-20
tions of temperature and relative humidity), it was necessary to place the instrumenta-tion in an air condiinstrumenta-tioned laboratory. An inlet system mounted to the wall outside of the air conditioned laboratory was used to bring sample air to the instruments (Fig. 1). For the design of this inlet system, three major requirements had to be considered: (a)
Min-imizing gas phase wall losses (particularly HNO3), (b) Minimizing aerosol losses due to
25
ACPD
4, 1203–1246, 2004Real-time measurements of inorganic gases and
aerosol species
I. Trebs et al.
Title Page
Abstract Introduction
Conclusions References
Tables Figures
◭ ◮
◭ ◮
Back Close
Full Screen / Esc
Print Version Interactive Discussion
©EGU 2004
the house) through a vertical polyethylene conduit with an inner diameter of 7 cm. The conduit was wrapped on the outside with aluminum tape to reduce daytime heating of the material. The air flow in the conduit was generated by a suction fan assembled in the conduit bottom. A sub-sample of the air was aspirated from the center of the
conduit’s cross section area at a flow rate of∼17 l min−1(STP: 298.15 K and 1000 hPa)
5
through a steel elbow (90◦ angle of steel tubing, d=0.8 cm, inner surface PFA Teflon
coated) mounted inside the conduit (Fig. 1). The sampled air was then drawn through
a PFA Teflon tubing connection (d=0.8 cm, l=70 cm) to the sampling system in the
air conditioned laboratory. The PFA Teflon tubing inside the laboratory had a length of only 5 cm before entering the instrument and was insulated thoroughly to prevent
con-10
densation. During the field experiment, the steel elbow was replaced periodically with a pre-impactor (PM 2.5 size cut; type 413, University Research Glassware, aluminum cy-clone, PFA Teflon coated). Velocity, relative humidity and temperature of the air stream in the polyethylene conduit were continuously monitored (time resolution 1 min) using a thermo-anemometer sensor (Velocicalc Plus 8386, TSI Instruments).
15
Neuman et al. (1999) tested different inlet materials for sampling HNO3 and found
highest transmission efficiencies (≥95%) for plastic materials at 22◦C (e.g. PFA, TFE,
FEP and PVDF), whereas HNO3loss on aluminum, steel or nylon materials was∼85%.
On the basis of these results, the polyethylene inlet conduit was considered to be
ap-propriate for sampling of HNO3 and other soluble gases. A similar inlet construction
20
for sampling HNO3 and HONO was used during the EPA Atlanta Supersite
Experi-ment (1999) and proved to be satisfactory (Genfa et al., 2003). Also, using Teflon coated aluminum cyclones as inlet under atmospheric conditions, Appel et al. (1988)
observed transmission efficiencies for HNO3not significantly different from 100%.
Nev-ertheless, to ensure the quality of our measurements, we present a theoretical
verifi-25
ACPD
4, 1203–1246, 2004Real-time measurements of inorganic gases and
aerosol species
I. Trebs et al.
Title Page
Abstract Introduction
Conclusions References
Tables Figures
◭ ◮
◭ ◮
Back Close
Full Screen / Esc
Print Version Interactive Discussion
©EGU 2004
3.2.2. Sampling efficiency of the inlet system
To minimize gas phase losses (particularly HNO3), laminar conditions in the conduit are
necessary to avoid turbulence and to minimize the contact of the sampled air with the inlet walls. However, since simultaneous sampling of gases and aerosol species was intended, it was crucial to account for possible inlet losses of both, gases and aerosols.
5
The required flow rate for the pre-impactor (d =0.8 cm) was ∼17 l min−1 (STP). The
mean air velocity in the polyethylene conduit generated by the suction fan was adjusted
to∼1 m s−1(Reynolds number Remean∼4500) indicating the transition between laminar
conditions and turbulence. This, in turn, led to slightly superisokinetic sampling at the entrance of the steel elbow and/or pre-impactor, since the mean air velocity at its
10
entrance was around 8 m s−1. Aerosol losses due to non-isokinetic sampling were
calculated using the equation of Belyaev and Levin (1974) (Hinds, 1999):
∆c c0 =
1−
1+
v
0
v −1
×
1−
1
1+2+0.62×vv
0
×Stk
(1)
where∆c/c0is the relative aerosol loss between conduit and steel elbow and/or
pre-impactor, v0 is the air velocity in the conduit (m s
−1
) (STP),v is the air velocity in the
15
steel elbow and/or pre-impactor (m s−1) (STP) and Stk is the corresponding Stokes
number. Aerosol losses (DP≤2.5µm) were≤3% for during the entire experiment, and
are subsequently neglected.
To verify the performance of the inlet regarding the transmission of gaseous
com-pounds, “worst case” wall losses were calculated for HNO3. Therefore, a hypothetical
20
complete coating of the inner conduit surface with water droplets and aerosols, and a
HNO3uptake coefficient ofγHNO3=1 (any molecule diffusing to the wall surface would
be absorbed=“worst case scenario”) was assumed. The conduit was considered as a
circular denuder tube with laminar flow conditions and hypothetical wall losses of HNO3
were calculated by application of the following equation (Gormley and Kennedy, 1949;
ACPD
4, 1203–1246, 2004Real-time measurements of inorganic gases and
aerosol species
I. Trebs et al.
Title Page
Abstract Introduction
Conclusions References
Tables Figures
◭ ◮
◭ ◮
Back Close
Full Screen / Esc
Print Version Interactive Discussion
©EGU 2004
equation modified):
∆c c0 =
1−
0.8191×e−3.6568×∆+0.0975×e−22.3×∆+0.0325×e−57×∆+...
(2)
with
∆ = π×DG×LC
QC
, (3)
where∆c/c0 denotes the relative gas phase loss, DG the HNO3 diffusion coefficient
5
(cm2 s−1), LC the length of the conduit (cm) and QC the air flow in the conduit (cm3
s−1) (STP). The HNO3 diffusion coefficient in air was experimentally determined by
several investigators ranging from 0.04 cm2 s−1 to 0.121 cm2 s−1 (STP) (Braman et
al., 1982; Eatough et al., 1985; Durham and Stockburger, 1986 and Deandrade et al.,
1992). In this study, we used the highest value (0.121 cm2 s−1). Mean hypothetical
10
“worst case” gas phase losses (γHNO3 =1) of ≤30% were derived for the conditions
observed during the entire measurement period. However, Kirchner et al. (1990), van
Doren et al. (1990) and Ponche et al. (1993) reported from laboratory studiesγHNO
3≪1
for the heterogeneous uptake of HNO3 by pure aqueous droplets (typicallyγHNO3 was
<0.2 for T>260 K). Taking into account atmospheric conditions and possible coating of
15
the inner conduit walls with strong electrolytic aerosol mixtures, we consider a HNO3
uptake coefficient of γHNO3=0.5 as a conservative estimate, appropriate for our study.
Hence, replacing the “worst case scenario” by rather realistic conditions, theoretical
mean gas phase HNO3losses for the entire experiment were estimated to≤15%.
To verify the performance of the inlet system from a practical point of view, we
re-20
moved the complete inlet system (conduit and steel elbow and/or pimpactor), re-sulting in sampling straight through the 70 cm long PFA Teflon tubing. During this
procedure, we observed no significant differences to the typical HNO3 diel variation
ACPD
4, 1203–1246, 2004Real-time measurements of inorganic gases and
aerosol species
I. Trebs et al.
Title Page
Abstract Introduction
Conclusions References
Tables Figures
◭ ◮
◭ ◮
Back Close
Full Screen / Esc
Print Version Interactive Discussion
©EGU 2004
3.3. Sampling and analysis
A detailed description of the WAD/SJAC and the analytical procedures is given else-where (Slanina et al., 2001; Wyers et al., 1993). A simplified sketch of the sampling
system is shown in Fig. 2. The air flow through the instrument (∼17 l min−1, STP) was
generated by a scroll pump outside the wooden house and could be adjusted with a
5
needle valve. The flow was measured continuously (1 min time resolution) with a mass flow meter (Bronkhorst, F-112AC-HA-55-V). After the sample air passed the steel el-bow and/or pre-impactor and the PFA Teflon tubing, it entered a horizontally aligned
WAD that scavenges soluble gaseous species. Trace gases (such as NH3, HNO3,
HNO2, HCl and SO2) were collected in a 10
−4
M NaHCO3 absorption solution. The
10
liquid input was controlled automatically by an infrared sensor and a switching valve and the liquid was continuously pumped out of the denuder at a flow rate of 0.5–0.6 ml
min−1 by a peristaltic pump. The liquid effluent was collected in a sample reservoir
(“gas sample”, see Fig. 2).
After the WAD, the air entered a reservoir where it was mixed with steam of highly
15
purified water. The supersaturation causes aerosol particles to grow rapidly (within
0.1 s) into droplets of at least 2µm diameter. These droplets, containing the dissolved
aerosol species were then collected in a cyclone (Khlystov et al., 1995). The cyclone
effluent (“aerosol sample”) was transferred into the sample reservoir by a peristaltic
pump at a flow rate of 0.5–0.6 ml min−1.
20
Collection of liquid samples in the sample reservoir and the following analytical cy-cles were performed successively for gas and aerosol sample. On-line analyses were carried out using a mobile IC with suppressed conductivity detection. The system was operated with an HPLC separation column (Dionex, IonPac AS12A, 4 mm) preceded
by a guard column (Dionex, IonPac AG12A, 4×50 mm). Samples were injected via
25
a 199µl loop into 2.7 mM Na2CO3–0.3 mM NaHCO3 eluent. Internal Br
−
standard addition using a peristaltic pump was performed continuously to calibrate the IC. The
ACPD
4, 1203–1246, 2004Real-time measurements of inorganic gases and
aerosol species
I. Trebs et al.
Title Page
Abstract Introduction
Conclusions References
Tables Figures
◭ ◮
◭ ◮
Back Close
Full Screen / Esc
Print Version Interactive Discussion
©EGU 2004
measurements were independent from room temperature.
Ammonium (NH+4) was determined by FIA (Wyers et al., 1993). The general
princi-ple is the addition of OH− ions, converting NH+4 to NH3, which will then pass through a
Teflon membrane and is taken up by highly purified water. Subsequent NH+4-detection
is based on conductometry. The conductivity cell of the FIA was not temperature
con-5
trolled; therefore, conductivity measurements were dependent on temperature. Despite
operating an air conditioner, diel temperature variations from 22◦C at night to 30◦C at
daytime were observed in the laboratory. Fluctuations of the conductivity due to tem-perature changes in the air conditioned laboratory were corrected using:
Cond corr=Cond ×e(0.024×(20−T)) (4)
10
whereCondcorr denotes the corrected conductivity value (mV), Cond is the original
measured conductivity (mV) and T is the observed temperature (◦C) in the
labora-tory. The FIA was calibrated once every week using standard solutions of 50 ppb and
250 ppb NH+4.
IC and FIA analyses were performed simultaneously for each sample. The analytical
15
sample cycle was purged with ambient air after every run to avoid memory effects of
the previous sample solution. The sampling system is fully automated and its software controls the sequence of sample injections and integrates detected peak areas. Cy-cle times for the successive analysis of “aerosol and gas sample” were set to 20 min (biomass burning season), 40 min (transition period) and 60 min (wet season).
20
Ambient mixing ratios for gas and aerosol species after IC analyses were determined using the following equation:
m= mliq
×mBr(std)×QBr×QBr×Mair
mBr×Qair×Mi
, (5)
wherem is the ambient mixing ratio (ppb), mliq is the mixing ratio of the compounds
found in “aerosol or gas sample” (ppb),mBr(std)is the mixing ratio of the Br
−
standard
25
solution (ppb), QBr is the flow of the Br
−
ACPD
4, 1203–1246, 2004Real-time measurements of inorganic gases and
aerosol species
I. Trebs et al.
Title Page
Abstract Introduction
Conclusions References
Tables Figures
◭ ◮
◭ ◮
Back Close
Full Screen / Esc
Print Version Interactive Discussion
©EGU 2004
liquid sample (kg s−1),G is the factor to convert the molar weight of ionic compounds
analyzed into the molecular weight of the corresponding trace gas (the factor is 1 for
aerosol species). Mair is the molar mass of air at 298.15 K and 1000 hPa (24.774 kg
kmol−1),mBris the analyzed Br
−
mixing ratio (ppb),Qairis the air mass flow through the
system (kg s−1) andMi is the molar weight of compound i (kg kmol−1). This equation
5
is also valid for calculating ambient mixing ratios of NH3 and aerosol NH+4, except for
parameters related to the Br− standard addition and replacingQBrbyQS, which is the
liquid flow of “gas sample” (NH3) or “aerosol sample” (NH+4) (kg s−1).
4. Results and discussion
The sampling period was chosen from 12 September to 14 November 2002, covering
10
extensive biomass burning activity during the dry season (12 to 23 September), an intermediate phase (transition period, 7 to 31 October) and clean conditions during the wet season (1 to 14 November). Due to an instrument failure no samples were collected from 24 September to 7 October.
All results of our measurements of gas and aerosol species are presented as mixing
15
ratios (ppb or nmol mol−1). All quantities were calculated for standard conditions of
298.15 K, 1000 hPa and dry air, following the recommendations from Schwartz and Warneck (1995) and Mills et al. (1993).
4.1. Estimation of measurement uncertainty
The uncertainty of the measurements was estimated applying “Gaussian Error
Propa-20
gation” to the relationship (5) which resulted in the following equation:
σm =m× 2
v u u t
σm
liq
mliq
2 +
σm
Br(std)
mBr(std)
2 +
σ
QBr QBr
2 +
σ
mBr mBr
2 +
σ
Qair Qair
2
ACPD
4, 1203–1246, 2004Real-time measurements of inorganic gases and
aerosol species
I. Trebs et al.
Title Page
Abstract Introduction
Conclusions References
Tables Figures
◭ ◮
◭ ◮
Back Close
Full Screen / Esc
Print Version Interactive Discussion
©EGU 2004
whereσmis the estimated relative uncertainty of the ambient mixing ratio (ppb) andσx
are the standard deviations of the corresponding parameters (see Eq. 5). Equation (6)
was also used to estimate uncertainties for ambient mixing ratios of NH3 and aerosol
NH+4, omitting the factors regarding Br− standard addition and replacingQBrbyQSand
σQBr byσQs.
5
Calculated total uncertainties σm for all measurements and compounds usually
ranged from 10–15%, indicating a reliable and stable performance of the instrument.
The standard deviations σx contributing to the total measurement uncertainty σm
in-cluding their sources are listed in Table 2. For IC analyses, the contribution ofσQBrwas
highest (57% of the total error, see Table 2) indicating that Br− addition to the sample
10
by the peristaltic pump is the largest source of measurement error. For FIA analyses,
the value ofσmliq had the highest contribution to σm (84% and 57% for NH3 and NH+4
analyses, respectively). Reasons for that may be an incomplete removal of the tem-perature dependence by Eq. (6), and also the temtem-perature influence on the equilibrium
constant of NH4OH and the permeation of NH3through the membrane.
15
4.2. Limit of detection (LOD)
The accurate characterization and determination of the limit of detection is crucial for measurements in regions like the Amazon Basin since concentration levels can be
extremely low during the wet season. The limit of detection (LOD = 3σ; σ =
stan-dard deviation of the background signal) was determined for actual field conditions for
20
every individual data point and each compound. For anionic species analyzed with
IC, the background noise (3σ) was calculated from the variation of the baseline at
the beginning and the end of each chromatogram comprising 11% (n = 542) of the
total chromatogram data points. The limit of detection (LOD=3σ) for the FIA
analy-ses was determined analogously by background noise calculation before and after the
25
NH+4-peak, also comprising 11% (n=111) of the total measurements for each run.
ACPD
4, 1203–1246, 2004Real-time measurements of inorganic gases and
aerosol species
I. Trebs et al.
Title Page
Abstract Introduction
Conclusions References
Tables Figures
◭ ◮
◭ ◮
Back Close
Full Screen / Esc
Print Version Interactive Discussion
©EGU 2004
are shown in histograms (Fig. 3). The determined median LOD values were 0.102 ppb
for NH3, 0.011 ppb for HNO3, 0.012 ppb for HONO, 0.008 ppb for HCl, 0.004 ppb for
SO2, 0.118 ppb for aerosol NH+4, 0.015 ppb for NO
−
3, 0.009 ppb for NO
−
2, 0.008 ppb for
Cl− and 0.004 ppb for SO24−. Higher LOD values (see Fig. 3), were a result of unstable
and noisy baselines caused by insufficient purity of the water, which was used as matrix
5
for the solutions applied during analyses. The LOD values obtained for FIA were about an order of magnitude higher than for IC, because of the influence of temperature on detection procedures.
4.3. Seasonal variation of mixing ratios
Measurements of 10 different compounds were performed during the field experiment
10
which resulted in∼7000 data points of ambient mixing ratios. The proportion of rejected
data points below the LOD was≤20% for all compounds, except for NH3 and HNO3
(25%) and for aerosol NO−2 (40%).
Statistical illustrations of the seasonal pattern of mixing ratios are shown in Fig. 4 for gaseous compounds and in Fig. 5 for aerosol species. A substantial decline of mixing
15
ratio levels from dry season, through transition period to wet season was observed for
all measured compounds. Gaseous NH3 was abundant at mixing ratios an order of
magnitude higher than acidic trace gases, and maxima reached 8 ppb under burning
conditions. Correspondingly, aerosol NH+4 was also found to be at least 4 to 10 times
higher than anionic aerosol species. Values of NH3and aerosol NH+4 declined by a
fac-20
tor of 2–3 from dry to wet season, suggesting that biomass burning is a strong source
of these species. Also, NH3 emissions from cattle waste contributed to the observed
levels. The amount of NH3present during the wet season (∼0.5 ppb, see Fig. 4), when
biomass burning activity was nearly zero, is expected to be entirely attributed to emis-sions from cattle manure.
25
All acidic trace gases showed mixing ratios within the same order of magnitude
ACPD
4, 1203–1246, 2004Real-time measurements of inorganic gases and
aerosol species
I. Trebs et al.
Title Page
Abstract Introduction
Conclusions References
Tables Figures
◭ ◮
◭ ◮
Back Close
Full Screen / Esc
Print Version Interactive Discussion
©EGU 2004
showed the lowest values (median <0.1 ppb) and the least seasonal variation,
sug-gesting that biomass burning is not a major source of this compound in this region. Mixing ratios of aerosol anions were highest during the biomass burning season.
Un-expectedly, aerosol NO−3 (max ∼1.25 ppb) was most abundant, followed by aerosol
SO24−(max∼0.6 ppb). Aerosol NO−3 dominated over SO24− under biomass burning
con-5
ditions and showed the strongest decrease to the wet season (factor∼4). Cl−and NO−2
contributed only very little to the aerosol inorganic composition and seasonal variations were smaller.
When widespread biomass burning occurred, NH3mixing ratios at this Brazilian rural
pasture site were similar to values observed with the WAD/SJAC at an urban location
10
(EPA Atlanta Supersite, 1999; Zhang et al., 2002 and references therein).
Neverthe-less, HNO3 and HONO mixing ratios under burning conditions in the Amazon Basin
were about five times lower than measured at the Atlanta Supersite (see Genfa et al.,
2003). Aerosol NO−3 measured with the SJAC system in Atlanta compared relatively
well to the values observed in our study (see Weber et al., 2003). However, NH+4 was
15
about five times and SO24− an order of magnitude larger at the urban site (Solomon et
al., 2003; Weber et al., 2003). These results show that pollution in urban areas can be more severe than during biomass burning in the Amazon Basin.
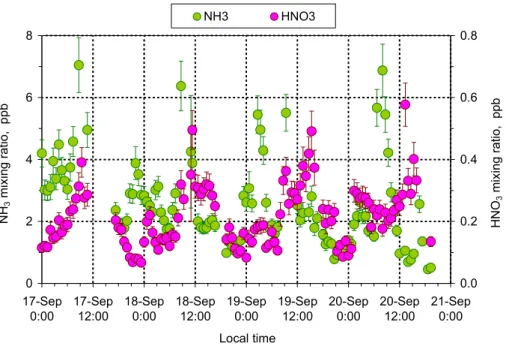
4.4. Diel variations of trace gases
4.4.1. NH3and HNO3
20
Figure 6 shows diel cycles for NH3and HNO3from 17 to 20 September 2002 (burning
season), exhibiting a pronounced diel variation. NH3 was relatively low from 14:00 to
05:00 (1 to 3 ppb), with one exception in the night from the 18 to 19 September. Usually, between 05:00 and 13:00 sharp peaks occurred with distinctive maxima between 08:00
and 09:00. This is most likely due to the evaporation of NH3from wet surfaces (grass
25
ACPD
4, 1203–1246, 2004Real-time measurements of inorganic gases and
aerosol species
I. Trebs et al.
Title Page
Abstract Introduction
Conclusions References
Tables Figures
◭ ◮
◭ ◮
Back Close
Full Screen / Esc
Print Version Interactive Discussion
©EGU 2004
The diel variation observed for HNO3 usually featured low values during the night
from 18:00 to 06:00 (<0.2 ppb) and high values at daytime reaching maxima around
midday (0.4 to 0.6 ppb). Such diel cycles are typical for this compound and resemble those found in several other studies (e.g. Tanner et al., 1989; Meixner, 1994; Mehlmann and Warneck, 1995; ; Fehsenfeld et al., 1998; Lefer et al., 1999; Furutani and Akimoto,
5
2002; Huang et al., 2002; Genfa et al., 2003). The main reasons for this behavior are: (a) intensive turbulent mixing from the free troposphere into the boundary layer during daytime, (b) deposition processes at night promoted by a stable thermal stratification
of the nocturnal surface layer (limiting HNO3 supply from residual layer), (c) higher
temperature and lower relative humidity during daytime which enables evaporation of
10
HNO3 from the aerosol phase, and (d) daytime photochemistry (reaction of NO2 with
OH radical). A detailed investigation of the diel behavior of NH3 and HNO3 will be
presented in a following paper.
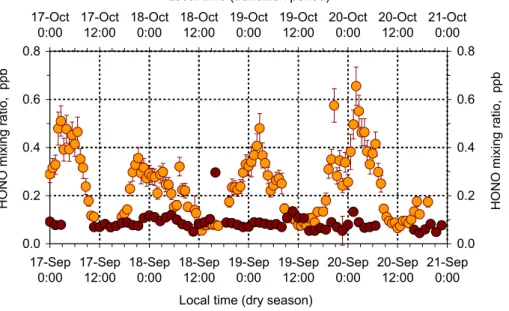
4.4.2. HONO
Figure 7 shows diel patterns of HONO measured from 17 to 20 September 2002
15
(biomass burning season) and from 17 to 20 October 2002 (transition period). In the burning season, HONO featured a pronounced diel cycle with higher values at night,
reaching maxima just after 00:00 (0.4 to 0.6 ppb). Heterogeneous reaction of NO2
with surface water as reported recently by Kleffmann et al. (2003) may be regarded
as a HONO source, especially for nighttime HONO accumulation at high relative
hu-20
midities at the site. During the day, HONO levels were low, varying between 0.05 and 0.1 ppb. Similar HONO diel characteristics were observed in other studies (e.g. Perner and Platt, 1979; Appel et al., 1990; Harrison et al., 1996; Huang et al., 2002; Stutz et al., 2002; Alicke et al., 2003). Rapid photolysis during sunshine leads to a decline in HONO mixing ratios (Harrison et al., 1996). Moreover, our measurements in the
Ama-25
zon Basin may be additional evidence for a continuous HONO source since a complete depletion at daytime did not occur.
distinc-ACPD
4, 1203–1246, 2004Real-time measurements of inorganic gases and
aerosol species
I. Trebs et al.
Title Page
Abstract Introduction
Conclusions References
Tables Figures
◭ ◮
◭ ◮
Back Close
Full Screen / Esc
Print Version Interactive Discussion
©EGU 2004
tive differences to those observed during the biomass burning season. HONO levels
were identical in daylight and during nighttime resembling those measured in daylight
under biomass burning conditions. Since NO2 is considered as the main reactant for
heterogeneous HONO formation, obviously a declining NO2abundance under cleaner
conditions will diminish HONO accumulation at night (for details see following paper).
5
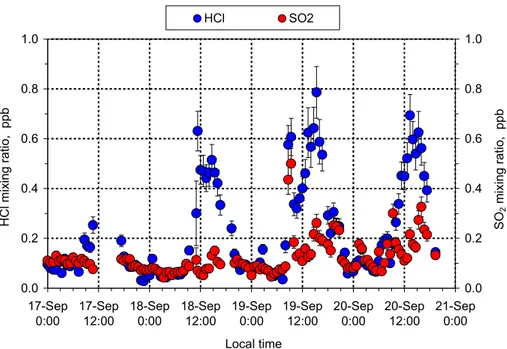
4.4.3. HCl and SO2
Nighttime values of HCl and SO2(Fig. 8) were very low in the burning season (∼0.05
to 0.1 ppb) while during daytime higher mixing ratios were found, with HCl exceeding
SO2levels by a factor of two or three. The marked diel pattern of HCl has a maximum
in the early to mid afternoon, which is generally coincident with the period of maximum
10
concentration of HNO3, in agreement with several previous investigations (Graedel and
Keene, 1995 and references therein). HCl is known to be emitted directly by biomass fires, accounting for a large fraction of the total emitted chlorine (Andreae et al., 1996). Apparently, turbulent mixing during daytime and a stable thermal stratification at night (deposition of acidic gases on wet surfaces) have caused diel fluctuations as shown in
15
Fig. 8. Discussion of this matter will also be presented in the following paper.
4.5. Diel variations of aerosol species
4.5.1. Aerosol NH+4, NO−3 and SO24−
Observed diel variations for aerosol NH+4, NO−3 and SO24− (fine fraction,<2.5µm) from
17 to 20 September 2002 are plotted in Fig. 9a. As for corresponding gaseous species,
20
pronounced diel patterns were found for NH+4 and NO−3. Obviously, NH+4 was strongly
influenced by its gas phase precursor NH3, peaking between 08:00 and 09:00 in the
morning and revealing much higher mixing ratios than the anionic aerosol species.
Possible evaporation of NH3 from wet surfaces at sunrise, when relative humidities
were still high (see Fig. 9b and Sect. 4.4.1) might have caused a significant fraction
ACPD
4, 1203–1246, 2004Real-time measurements of inorganic gases and
aerosol species
I. Trebs et al.
Title Page
Abstract Introduction
Conclusions References
Tables Figures
◭ ◮
◭ ◮
Back Close
Full Screen / Esc
Print Version Interactive Discussion
©EGU 2004
of gaseous NH3 to dissolve in still deliquescent aerosols, therefore enhancing aerosol
NH+4. Generally, NH+4 and NO−3 began to increase at∼22:00 and remained high during
the night, while values found during daytime were usually two or three times lower
(see Fig. 9a). Consequently, aerosol NO−3 showed a strong anti-correlation to HNO3.
The equilibrium assumption between NH4NO3and its gas phase precursors, strongly
5
affected by relative humidity and temperature, is expected to influence the measured
gas and aerosol mixing ratios. High relative humidities and lower temperatures at
night (Fig. 9b) should shift the equilibrium to the aerosol phase, causing the NH4NO3
content to increase and resulting in a simultaneous decrease of atmospheric gas phase constituents. At daytime, semi-volatile species can evaporate from the aerosol phase,
10
induced by lower relative humidities and higher temperatures (Fig. 9b), consequently raising the gas phase mixing ratios.
Time series of SO24− did not show the same behavior. Mixing ratios were relatively
stable throughout day and night, resembling those found for NO−3 during daytime.
Con-sidering the non-volatility of SO24−, relative humidity and temperature should not
influ-15
ence the amount of SO24− present in aerosols.
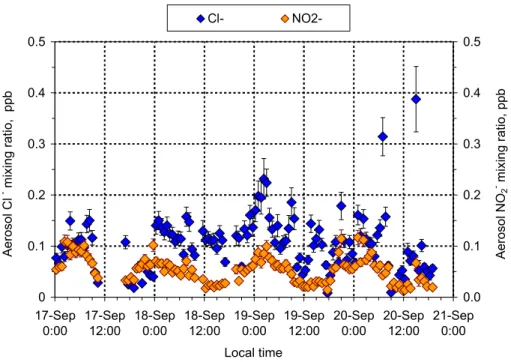
4.5.2. Aerosol Cl− and NO−2
The diel cycles for aerosol Cl− and NO−2 (Fig. 10, fine fraction, <2.5µm) during the
burning season were less pronounced than for the other aerosol species. NO−2 is
higher at night, which may be an indication of heterogeneous HONO formation on
20
aerosol surfaces. This matter will also be discussed in a following paper. Cl− mixing
ratios showed less distinctive differences between day and night, suggesting that it may
ACPD
4, 1203–1246, 2004Real-time measurements of inorganic gases and
aerosol species
I. Trebs et al.
Title Page
Abstract Introduction
Conclusions References
Tables Figures
◭ ◮
◭ ◮
Back Close
Full Screen / Esc
Print Version Interactive Discussion
©EGU 2004
5. Conclusions
We employed a WAD/SJAC coupled with IC and ammonium FIA for the continuous
measurement of NH3, acidic trace gases (HNO3, HONO, HCl and SO2) and
corre-sponding aerosol species (NH+4, NO−3, NO−2, Cl− and SO24−) at a rural site in the
Ama-zon Basin. A specially designed inlet system was applied for simultaneous sampling
5
of gases and aerosols. Calculated inlet losses of aerosol species due to non-isokinetic
sampling were below 3% (DP≤2.5µm). HNO3is known as a problematic compound
re-garding absorption on inlet surfaces. Theoretical wall losses for HNO3were calculated
to be≤15%, assuming an uptake coefficient ofγHNO
3=0.5 for the inlet surface.
Total measurement uncertainties of the mixing ratios in ambient air were usually
10
below 15%. The use of a peristaltic pump for the Br− standard addition to calibrate the
IC was found to have the greatest contribution (57%) to the total measurement error. In order to reduce the influence of this factor, peristaltic pumps should be replaced by other devices (e.g. syringe pumps), which are capable to supply more constant flows on a long-term scale.
15
The limit of detection (LOD=3σ) was determined for each individual data point under
actual field conditions. LOD median values remained below 0.015 ppb for all acidic
trace gases and aerosol anions (IC analyses) but were higher (≤0.118 ppb) for NH3
and aerosol NH+4 (FIA analyses). Higher background noises during NH3 and aerosol
NH+4 detection procedures were apparently caused by the temperature dependence of
20
the FIA analyses, which should therefore be carried out under temperature controlled conditions in the future.
Widespread biomass burning in the Amazon Basin was found to be a strong source
of NH3, present at mixing ratios about 3 times higher (max ∼8 ppb) than under clean
conditions during the wet season. Also, levels of HNO3, HONO and HCl were
con-25
siderably higher than during the wet season (at least two times) but were an order of
magnitude lower (<1 ppb) than the NH3 mixing ratios. The enhancement of gaseous
water-ACPD
4, 1203–1246, 2004Real-time measurements of inorganic gases and
aerosol species
I. Trebs et al.
Title Page
Abstract Introduction
Conclusions References
Tables Figures
◭ ◮
◭ ◮
Back Close
Full Screen / Esc
Print Version Interactive Discussion
©EGU 2004
soluble inorganic aerosol constituents. NO−3 and SO24− were most abundant reaching
maxima of 1.25 ppb and 0.6 ppb, respectively. Aerosol NO−3 was the dominating
inor-ganic anion during the biomass burning season and showed the strongest decrease
to the wet season (∼70%). Additionally, N-containing gas and aerosol species
exhib-ited pronounced diel variations, and both HCl and SO2varied distinctively with maxima
5
at daytime and minima during the night. Turbulent mixing at daytime is considered to have a major influence on the observed diel patterns, contributing to an increase of gaseous compounds at ground level. Deposition processes at night combined with a stable thermal stratification of the nocturnal surface layer may cause a decline of
gaseous compounds (NH3, HNO3, HCl and SO2) at nighttime. Moreover, our
mea-10
surements indicate that the interaction between N-containing gas and corresponding aerosol constituents was dependent on relative humidity and air temperature, resulting
in an enhancement of aerosol NO−3 and NH+4 at nighttime. Non-volatile aerosol SO24−
did not show strong diel fluctuations and remained stable throughout day and night. HONO showed a typical diel pattern when biomass burning occurred, exhibiting higher
15
mixing ratios at night and lower values during daylight. Besides heterogeneous
forma-tion from NO2and surface water, our observations suggest a continuous HONO source
since a complete depletion at daytime did not occur.
Acknowledgements. The authors gratefully acknowledge financial support by the European
Commission (contract N◦
EVK2-CT-2001-00110 SMOCC) and by the Max Planck Society. We
20
are grateful to P. Artaxo for the organization of the field experiment and his help in logistical issues. Also, the authors wish to thank P. Guyon, J. von Jouanne, and G. Helas for their support. Special thanks go to O. L. Mayol-Bracero, S. Gonzalez, L. Soto, A. Camargo, M. A. L. Moura and R. S. da Silva, Jr. for their help during the field measurements.
References 25
ACPD
4, 1203–1246, 2004Real-time measurements of inorganic gases and
aerosol species
I. Trebs et al.
Title Page
Abstract Introduction
Conclusions References
Tables Figures
◭ ◮
◭ ◮
Back Close
Full Screen / Esc
Print Version Interactive Discussion
©EGU 2004
Alicke, B., Geyer, A., Hofzumahaus, A., Holland, F., Konrad, S., Patz, H. W., Schafer, J., Stutz, J., Volz-Thomas, A., and Platt, U.: OH formation by HONO photolysis during the BERLIOZ experiment, J. Geophys. Res.-Atmos., 108, D4, 8247, doi:10.1029/2001JD000579, 2003. Allegrini, I., Febo, A., Perrino, C., and Masia, P.: Measurement of Atmospheric Nitric-Acid in
Gas-Phase and Nitrate in Particulate Matter by Means of Annular Denuders, Int. J. Environ.
5
Anal. Chem., 54, 183–201, 1994.
Andreae, M. O., Artaxo, P., Brandao, C., Carswell, F. E., Ciccioli, P., da Costa, A. L., Culf, A. D., Esteves, J. L., Gash, J. H. C., Grace, J., Kabat, P., Lelieveld, J., Malhi, Y., Manzi, A. O., Meixner, F. X., Nobre, A. D., Nobre, C., Ruivo, M., Silva-Dias, M. A., Stefani, P., Valentini, R., von Jouanne, J., and Waterloo, M. J.: Biogeochemical cycling of carbon, water, energy,
10
trace gases, and aerosols in Amazonia: The LBA-EUSTACH experiments, J. Geophys. Res.-Atmos., 107, D20, 8066, doi:10.1029/2001JD000524, 2002.
Andreae, M. O., Atlas, E., Harris, G. W., Helas, G., deKock, A., Koppmann, R., Maenhaut, W., Mano, S., Pollock, W. H., Rudolph, J., Scharffe, D., Schebeske, G., and Welling, M.: Methyl halide emissions from savanna fires in southern Africa, J. Geophys. Res.-Atmos.,
15
101, 23 603–23 613, 1996.
Appel, B. R.: Sampling of Selected Labile Atmospheric Pollutants, Adv. Chem. Ser., 1–40, 1993.
Appel, B. R., Povard, V., and Kothny, E. L.: Loss of Nitric-Acid within Inlet Devices Intended to Exclude Coarse Particles During Atmospheric Sampling, Atmos. Environ., 22, 2535–2540,
20
1988.
Appel, B. R. and Tokiwa, Y.: Atmospheric Particulate Nitrate Sampling Errors Due to Reactions with Particulate and Gaseous Strong Acids, Atmos. Environ., 15, 1087–1089, 1981.
Appel, B. R., Tokiwa, Y., and Haik, M.: Sampling of Nitrates in Ambient Air, Atmos. Environ., 15, 283–289, 1981.
25
Appel, B. R., Tokiwa, Y., Haik, M., and Kothny, E. L.: Artifact Particulate Sulfate and Nitrate Formation on Filter Media, Atmos. Environ., 18, 409–416, 1984.
Appel, B. R., Tokiwa, Y., Povard, V., and Kothny, E. L.: The Measurement of Atmospheric Hydrochloric-Acid in Southern California, Atmospheric Environment Part a-General Topics, 25, 525–527, 1991.
30
Appel, B. R., Wall, S. M., Tokiwa, Y., and Haik, M.: Simultaneous Nitric-Acid, Particulate Nitrate and Acidity Measurements in Ambient Air, Atmos. Environ., 14, 549–554, 1980.
ACPD
4, 1203–1246, 2004Real-time measurements of inorganic gases and
aerosol species
I. Trebs et al.
Title Page
Abstract Introduction
Conclusions References
Tables Figures
◭ ◮
◭ ◮
Back Close
Full Screen / Esc
Print Version Interactive Discussion
©EGU 2004
Nitrous-Acid Measurements by Annular Denuder and Differential Optical-Absorption Sys-tems, Atmospheric Environment Part a-General Topics, 24, 611–616, 1990.
Asman, W. A. H., Sutton, M. A., and Schjorring, J. K.: Ammonia: emission, atmospheric trans-port and deposition, New Phytol., 139, 27–48, 1998.
Aumont, B., Chervier, F., and Laval, S.: Contribution of HONO sources to the NOx/HOx/O3
5
chemistry in the polluted boundary layer, Atmos. Environ., 37, 487–498, 2003.
Boring, C. B., Poruthoor, S. K., and Dasgupta, P. K.: Wet effluent parallel plate diffusion denuder coupled capillary ion chromatograph for the determination of atmospheric trace gases, Ta-lanta, 48, 675–684, 1999.
Braman, R. S., Shelley, T. J., and McClenny, W. A.: Tungstic Acid for Pre-Concentration and
10
Determination of Gaseous and Particulate Ammonia and Nitric-Acid in Ambient Air, Anal. Chem., 54, 358–364, 1982.
Buhr, S. M., Buhr, M. P., Fehsenfeld, F. C., Holloway, J. S., Karst, U., Norton, R. B., Parrish, D. D., and Sievers, R. E.: Development of a Semicontinuous Method for the Measurement of Nitric-Acid Vapor and Particulate Nitrate and Sulfate, Atmos. Environ., 29, 2609–2624, 1995.
15
Cadle, S. H., Countess, R. J., and Kelly, N. A.: Nitric-Acid and Ammonia in Urban and Rural Locations, Atmos. Environ., 16, 2501–2506, 1982.
Cheng, Y. H., and Tsai, C. J.: Evaporation loss of ammonium nitrate particles during filter sampling, J. Aerosol. Sci., 28, 1553–1567, 1997.
Cofer, W. R., Collins, V. G., and Talbot, R. W.: Improved Aqueous Scrubber for Collection of
20
Soluble Atmospheric Trace Gases, Environ. Sci. Technol., 19, 557–560, 1985.
Danalatos, D. and Glavas, S.: Gas phase nitric acid, ammonia and related particulate matter at a Mediterranean coastal site, Patras, Greece, Atmos. Environ., 33, 3417–3425, 1999. Dasgupta, P. K.: Automated Measurement of Atmospheric Trace Gases – Diffusion – Based
Collection and Analysis, Adv. Chem. Ser., 41–90, 1993.
25
Deandrade, J. B., Dearagao, N. M., and Araujo, F. R. J.: Nitric-Acid Air-Diffusion Coefficient -Experimental-Determination Using a Diffusion Cell, Int. J. Environ. Anal. Chem., 49, 103– 109, 1992.
Doyle, G. J., Tuazon, E. C., Graham, R. A., Mischke, T. M., Winer, A. M., and Pitts, J. N.: Simultaneous Concentrations of Ammonia and Nitric-Acid in a Polluted Atmosphere and
30
Their Equilibrium Relationship to Particulate Ammonium-Nitrate, Environ. Sci. Technol., 13, 1416–1419, 1979.
ACPD
4, 1203–1246, 2004Real-time measurements of inorganic gases and
aerosol species
I. Trebs et al.
Title Page
Abstract Introduction
Conclusions References
Tables Figures
◭ ◮
◭ ◮
Back Close
Full Screen / Esc
Print Version Interactive Discussion
©EGU 2004
Diffusion Denuder – a Performance Evaluation, Atmos. Environ., 21, 589–598, 1987. Durham, J. L. and Stockburger, L.: Nitric-Acid Air Diffusion-Coefficient-Experimental
Determi-nation, Atmos. Environ., 20, 559–563, 1986.
Eatough, D. J., White, V. F., Hansen, L. D., Eatough, N. L., and Ellis, E. C.: Hydration of Nitric-Acid and Its Collection in the Atmosphere by Diffusion Denuders, Anal. Chem., 57, 743–748,
5
1985.
Febo, A., Perrino, C., and Allegrini, I.: Measurement of nitrous acid in Milan, Italy, by DOAS and diffusion denuders, Atmos. Environ., 30, 3599–3609, 1996.
Fehsenfeld, F. C., Huey, L. G., Sueper, D. T., Norton, R. B., Williams, E. J., Eisele, F. L., Mauldin, R. L., and Tanner, D. J.: Ground-based intercomparison of nitric acid measurement
10
techniques, J. Geophys. Res.-Atmos., 103, 3343–3353, 1998.
Furutani, H. and Akimoto, H.: Development and characterization of a fast measurement sys-tem for gas-phase nitric acid with a chemical ionization mass spectrometer in the marine boundary layer, J. Geophys. Res.-Atmos., 107, D1–D2, doi:10.1029/2000JD000269, 2002. Galasyn, J. F., Tschudy, K. L., and Huebert, B. J.: Seasonal and Diurnal Variability of Nitric-Acid
15
Vapor and Ionic Aerosol Species in the Remote Free Troposphere at Mauna-Loa, Hawaii, J. Geophys. Res.-Atmos., 92, 3105–3113, 1987.
Gard, E., Mayer, J. E., Morrical, B. D., Dienes, T., Fergenson, D. P., and Prather, K. A.: Real-time analysis of individual atmospheric aerosol particles: Design and performance of a portable ATOFMS, Anal. Chem., 69, 4083–4091, 1997.
20
Genfa, Z. F., Slanina, S., Boring, C. B., Jongejan, P. A. C., and Dasgupta, P. K.: Continuous wet denuder measurements of atmospheric nitric and nitrous acids during the 1999 Atlanta Supersite, Atmos. Environ., 37, 1351–1364, 2003.
Gormley, P. G., and Kennedy, M.: Diffusion from a stream flowing trough a cylindrical tube, Proceedings of the Royal Irish Academy, 52A, 163–169, 1949.
25
Graedel, T. E., and Keene, W. C.: Tropospheric Budget of Reactive Chlorine, Glob. Bio-geochem. Cycle, 9, 47–77, 1995.
Hanke, M., Umann, B., Uecker, J., Arnold, F., and Bunz, H.: Atmospheric measurements of gas-phase HNO3 and SO2using chemical ionization mass spectrometry during the MINATROC field campaign 2000 on Monte Cimone, Atmospheric Chemistry and Physics, 3, 417–436,
30
2003.
ACPD
4, 1203–1246, 2004Real-time measurements of inorganic gases and
aerosol species
I. Trebs et al.
Title Page
Abstract Introduction
Conclusions References
Tables Figures
◭ ◮
◭ ◮
Back Close
Full Screen / Esc
Print Version Interactive Discussion
©EGU 2004
Harrison, R. M., Peak, J. D., and Collins, G. M.: Tropospheric cycle of nitrous acid, J. Geophys. Res.-Atmos., 101, 14 429–14 439, 1996.
Heland, J., Kleffmann, J., Kurtenbach, R., and Wiesen, P.: A new instrument to measure gaseous nitrous acid (HONO) in the atmosphere, Environ. Sci. Technol., 35, 3207–3212, 2001.
5
Hinds, W. C.: Aerosol Technology, Properties, Behavior and Measurement of Airborne Parti-cles, New York, John Wiley and Sons, 1999.
Huang, G., Zhou, X. L., Deng, G. H., Qiao, H. C., and Civerolo, K.: Measurements of atmo-spheric nitrous acid and nitric acid, Atmos. Environ., 36, 2225–2235, 2002.
Huey, L. G., Dunlea, E. J., Lovejoy, E. R., Hanson, D. R., Norton, R. B., Fehsenfeld, F. C., and
10
Howard, C. J.: Fast time response measurements of HNO3in air with a chemical ionization mass spectrometer, J. Geophys. Res.-Atmos., 103, 3355–3360, 1998.
Jayne, J. T., Leard, D. C., Zhang, X. F., Davidovits, P., Smith, K. A., Kolb, C. E., and Worsnop, D. R.: Development of an aerosol mass spectrometer for size and composition analysis of submicron particles, Aerosol Sci. Technol., 33, 49–70, 2000.
15
Jimenez, J. L., Jayne, J. T., Shi, Q., Kolb, C. E., Worsnop, D. R., Yourshaw, I., Seinfeld, J. H., Flagan, R. C., Zhang, X. F., Smith, K. A., Morris, J. W., and Davidovits, P.: Ambient aerosol sampling using the Aerodyne Aerosol Mass Spectrometer, J. Geophys. Res.-Atmos., 108, D7, 8425, doi:10.1029/2001JD00121, 2003.
Jongejan, P. A. C., Bai, Y., Veltkamp, A. C., Wyers, G. P., and Slanina, J.: An automated field
20
instrument for the determination of acidic gases in air, Int. J. Environ. Anal. Chem., 66, 241– 251, 1997.
Keuken, M. P., Schoonebeek, C. A. M., Wensveen-Louter, A., and Slanina, J.: Simultaneous Sampling of NH3, HNO3, HCl, SO2 and H)2O2 in Ambient Air by a Wet Annular Denuder System, Atmos. Environ., 22, 2541–2548, 1988.
25
Keuken, M. P., Waijers-Ijpelaan, A., Mols, J. J., Otjes, R. P., and Slanina, J.: The Determination of Ammonia in Ambient Air by an Automated Thermodenuder System, Atmos. Environ., 23, 2177–2185, 1989.
Khlystov, A., Wyers, G. P., and Slanina, J.: The Steam-Jet Aerosol Collector, Atmos. Environ., 29, 2229–2234, 1995.
30
ACPD
4, 1203–1246, 2004Real-time measurements of inorganic gases and
aerosol species
I. Trebs et al.
Title Page
Abstract Introduction
Conclusions References
Tables Figures
◭ ◮
◭ ◮
Back Close
Full Screen / Esc
Print Version Interactive Discussion
©EGU 2004
Kirkman, G. A., Gut, A., Ammann, C., Gatti, L. V., Cordova, A. M., Moura, M. A. L., An-dreae, M. O., and Meixner, F. X.: Surface exchange of nitric oxide, nitrogen dioxide, and ozone at a cattle pasture in Rondonia, Brazil, J. Geophys. Res.-Atmos., 107, D20, 8083, doi:10.1029/2001JD000523, 2002.
Kitto, A. M. N. and Harrison, R. M.: Nitrous and Nitric-Acid Measurements at Sites in
South-5
East England, Atmospheric Environment Part a-General Topics, 26, 235–241, 1992.
Kleffmann, J., Kurtenbach, R., L ¨orzer, J., Wiesen, P., Kalthoff, N., Vogel, B., and Vogel, H.: Measured and simulated vertical profiles of nitrous acid, Part I: Field measurements, Atmos. Environ., 37, 2949–2955, 2003.
Klockow, D., Niessner, R., Malejczyk, M., Kiendl, H., Vomberg, B., Keuken, M. P.,
Waijers-10
Ijpelaan, A., and Slanina, J.: Determination of Nitric-Acid and Ammonium-Nitrate by Means of a Computer-Controlled Thermodenuder System, Atmos. Environ., 23, 1131–1138, 1989. Lee, S. H., Murphy, D. M., Thomson, D. S., and Middlebrook, A. M.: Chemical components of
single particles measured with Particle Analysis by Laser Mass Spectrometry (PALMS) dur-ing the Atlanta SuperSite Project: Focus on organic/sulfate, lead, soot, and mineral particles,
15
J. Geophys. Res.-Atmos., 107, D1–D2, doi:10.1029/2000JD000011, 2002.
Lefer, B. L., Talbot, R. W., and Munger, J. W.: Nitric acid and ammonia at a rural northeastern US site, J. Geophys. Res.-Atmos., 104, 1645–1661, 1999.
Lindgren, P. F.: Diffusion Scrubber-Ion Chromatography for the Measurement of Trace Levels of Atmospheric HCl, Atmospheric Environment Part a-General Topics, 26, 43–49, 1992.
20
Mallina, R. V., Wexler, A. S., Rhoads, K. P., and Johnston, M. V.: High speed particle beam generation: A dynamic focusing mechanism for selecting ultrafine particles, Aerosol Sci. Technol., 33, 87–104, 2000.
Marshall, G. B. and Dimmock, N. A.: Determination of Nitric-Acid in Ambient Air Using Diffusion Denuder Tubes, Talanta, 39, 1463–1469, 1992.
25
Matusca, P., Schwarz, B., and B ¨achmann, K.: Measurements of Diurnal Concentration Varia-tions of Gaseous HCl in Air in the Subnanogram Range, Atmos. Environ., 18, 1667–1675, 1984.
Mauldin, R. L., Tanner, D. J., and Eisele, F. L.: A new chemical ionization mass spectrometer technique for the fast measurement of gas phase nitric acid in the atmosphere, J. Geophys.
30
Res.-Atmos., 103, 3361–3367, 1998.
Envi-ACPD
4, 1203–1246, 2004Real-time measurements of inorganic gases and
aerosol species
I. Trebs et al.
Title Page
Abstract Introduction
Conclusions References
Tables Figures
◭ ◮
◭ ◮
Back Close
Full Screen / Esc
Print Version Interactive Discussion
©EGU 2004
ron., 29, 2359–2373, 1995.
Meixner, F. X.: Surface exchange of odd nitrogen oxides, Nova Acta Leopoldina, 70, 299–348, 1994.
Middlebrook, A. M., Murphy, D. M., Lee, S. H., Thomson, D. S., Prather, K. A., Wenzel, R. J., Liu, D. Y., Phares, D. J., Rhoads, K. P., Wexler, A. S., Johnston, M. V., Jimenez, J. L., Jayne, J.
5
T., Worsnop, D. R., Yourshaw, I., Seinfeld, J. H., and Flagan, R. C.: A comparison of particle mass spectrometers during the 1999 Atlanta Supersite Project, J. Geophys. Res.-Atmos., 108, D7, 8424, doi:10.1029/2001JD000660, 2003.
Mills, I., Cvitas, T., Homann, K., and Kuchitsu, K.: Quantities, Units and Symbols in Physical Chemistry, Oxford, Blackwell Scientific Publications, 1993.
10
Neuman, J. A., Huey, L. G., Ryerson, T. B., and Fahey, D. W.: Study of Inlet Materials for Sampling Atmospheric Nitric Acid, Environ. Sci. Technol., 33, 1133–1136, 1999.
Oms, M. T., Jongejan, P. A. C., Veltkamp, A. C., Wyers, G. P., and Slanina, J.: Continuous monitoring of atmospheric HCl, HNO2, HNO3, and SO2, by wet-annular denuder air sampling with on-line chromatographic analysis, Int. J. Environ. Anal. Chem., 62, 207–218, 1996.
15
Orsini, D. A., Ma, Y. L., Sullivan, A., Sierau, B., Baumann, K., and Weber, R. J.: Refinements to the particle-into-liquid sampler (PILS) for ground and airborne measurements of water soluble aerosol composition, Atmos. Environ., 37, 1243–1259, 2003.
Papenbrock, T., and Stuhl, F.: A Laser-Photolysis Fragment-Fluorescence (LPFF) Method for the Detection of Gaseous Nitric-Acid in Ambient Air, J. Atmos. Chem., 10, 451–469, 1990.
20
Papenbrock, T. and Stuhl, F.: Measurement of Gaseous Nitric-Acid by a Laser-Photolysis Fragment-Fluorescence (LPFF) Method in the Black-Forest and at the North-Sea Coast, Atmospheric Environment Part a-General Topics, 25, 2223–2228, 1991.
Parrish, D. D., Norton, R. B., Bollinger, M. J., Liu, S. C., Murphy, P. C., Albritton, D. L., Fehsen-feld, F. C., and Huebert, B. J.: Measurements of HNO3and NH3-Particulates at a Rural Site
25
in the Colorado Mountains, J. Geophys. Res.-Atmos., 91, 5379–5393, 1986.
Perner, D. and Platt, U.: Detection of Nitrous-Acid in the Atmosphere by Differential Optical-Absorption, Geophys. Res. Lett., 6, 917–920, 1979.
Perrino, C., Desantis, F., and Febo, A.: Uptake of Nitrous-Acid and Nitrogen-Oxides by Nylon Surfaces – Implications for Nitric-Acid Measurement, Atmos. Environ., 22, 1925–1930, 1988.
30
Philips, D. A. and Dasgupta, P. K.: A Diffusion Scrubber for the Collection of Gaseous Nitric-Acid, Sep. Sci. Technol., 22, 1255–1267, 1987.