ACPD
4, 2301–2331, 2004Nitrogen oxides measurements in an
Amazon site
A. M. Cordova et al.
Title Page
Abstract Introduction
Conclusions References
Tables Figures
◭ ◮
◭ ◮
Back Close
Full Screen / Esc
Print Version
Interactive Discussion
©EGU 2004
Atmos. Chem. Phys. Discuss., 4, 2301–2331, 2004 www.atmos-chem-phys.org/acpd/4/2301/
SRef-ID: 1680-7375/acpd/2004-4-2301 © European Geosciences Union 2004
Atmospheric Chemistry and Physics Discussions
Nitrogen oxides measurements in an
Amazon site and enhancements
associated with a cold front
A. M. Cordova1, 2, 3, K. Longo4, S. Freitas4, L. V. Gatti1, P. Artaxo5, A. Proc ´opio2, 5, M. A. F. Silva Dias2, 4, and E. D. Freitas2
1
Instituto de Pesquisas Energ ´eticas e Nucleares (IPEN), S ˜ao Paulo, Brazil
2
Instituto de Astronomia, Geof´ısica e Ci ˆencias Atmosf ´ericas, Universidade de S ˜ao Paulo, Brazil
3
Centro de Estudios Avanzados en Zonas ´Aridas (CEAZA), Unidad Regional de Desarrollo Cient´ıfico & Tecnol ´ogico, La Serena, Chile
4
Centro de Previs ˜ao de Tempo e Estudos Clim ´aticos, INPE, Cachoeira Paulista, Brazil
5
Instituto de F´ısica, Universidade de S ˜ao Paulo, S ˜ao Paulo, Brazil
ACPD
4, 2301–2331, 2004Nitrogen oxides measurements in an
Amazon site
A. M. Cordova et al.
Title Page
Abstract Introduction
Conclusions References
Tables Figures
◭ ◮
◭ ◮
Back Close
Full Screen / Esc
Print Version
Interactive Discussion
©EGU 2004
Abstract
An intensive atmospheric chemistry study was carried out in a pristine Amazonian for-est site (Balbina), Amazonas state, Brazil during the 2001 wet season, as part of the LBA/CLAIRE 2001 (The Large Scale Biosphere Atmosphere Experiment in Amazo-nia/Cooperative LBA Airborne Regional Experiment) field campaign. Measurements
5
of nitrogen oxide (NO), nitrogen dioxide (NO2) and ozone (O3) were performed simul-taneously with aerosol particles and black carbon concentrations and meteorological parameters observations. Very low trace gases and aerosol concentrations are typi-cally observed at this pristine tropical site. During the measurement period, there was a three-day episode of enhancement of NO2and black carbon concentration. NO2
con-10
centration reached a maximum value of 4 ppbv, which corresponds to three times the background concentration observed for this site. Black carbon concentration increased from the approximated 100 ng/m3 average value to a 200 ng/m3 maximum during the same period. Biomass burning spots were detected southward, between latitudes 15 to 10◦S, 5–6 days before this episode from GOES-8 WF ABBA (Wildfire Automated
15
Biomass Burning Algorithm). An atmospheric numerical simulation of the whole mea-surement period was carried out using the RAMS model coupled to a biomass burning emission and transport model. The simulation results pictured a smoke transport event from Central Brazil associated to an approach of a mid-latitude cold front, reinforc-ing the hypothesis of biomass burnreinforc-ing products bereinforc-ing long-range transported from the
20
South by the cold front and crossing the Equator. This transport event shows how the pristine atmosphere pattern in Amazonia is impacted by biomass burning emissions from sites very far away.
1. Introduction
The study of NO, NO2 and O3 trace gas over tropical forests is fundamental to our
25
ACPD
4, 2301–2331, 2004Nitrogen oxides measurements in an
Amazon site
A. M. Cordova et al.
Title Page
Abstract Introduction
Conclusions References
Tables Figures
◭ ◮
◭ ◮
Back Close
Full Screen / Esc
Print Version
Interactive Discussion
©EGU 2004
and Andreae, 1990). The ratio NO/NO2is a critical ingredient in the mechanisms reg-ulating ozone and hydroxyl radical (OH) levels. The study of NOx (NOx=NO+NO2) provides information about microbiological activity in the soil and the nitrogen cycling in undisturbed forest ecosystems. The predominant natural source of NO is the mi-crobial soil activity through nitrification process, and this emission depends on a
com-5
bination of factors such as soil temperature, water, nutrients, pH and vegetation and atmospheric conditions (Davidson et al., 1992, 2000; Cardenas et al., 1993). The life-time of odd nitrogen in the atmosphere is short, and background levels of atmospheric odd nitrogen are believed to be low in most of the tropical atmosphere (Kaplan et al., 1988). Additionally, NO is also formed in situ in the troposphere from lightning
activ-10
ities (Atkinson, 2000). Measurements of NOx in the atmospheric boundary layer and lower free troposphere in remote maritime sites have generally yielded mixing ratios of 0.02 to 0.04 ppb. Mixing ratios in remote tropical forests appears to range from 0.02 to 0.08 ppb; the somewhat higher NOx concentrations found in the tropical forest, as compared with those observed in remote marine locations, could result from biogenic
15
NOxemissions from soil (Seinfeld and Pandis, 1998).
Ozone in the tropical troposphere plays a key role in determining the oxidizing power of the global atmosphere. Ozone is produced in the troposphere by oxidation of volatile organic compounds (VOCs) and CO in the presence of nitrogen oxides and solar ra-diation (Atkinson, 2000; Thompson et al., 2001). High UV and humidity in the tropics
20
promote the formation of OH radicals from the O3photolysis (Thompson et al., 1994, 1997; Jacob et al., 1996; Crutzen et al., 2000). Typical mid-day ozone concentrations in pristine areas are around 10–20 parts per billion by volume (ppbv)(Kirchhoffet al., 1988, 1996) over the Amazon Basin. The net production of ozone could occur with NO mixing ratio as low as 5 parts per trillion by volume (pptv) (Seinfeld and Padis, 1998).
25
In the Amazon, the oxidation of NO to NO2 by organic peroxy radicals would likely contribute significantly to the ozone production.
ACPD
4, 2301–2331, 2004Nitrogen oxides measurements in an
Amazon site
A. M. Cordova et al.
Title Page
Abstract Introduction
Conclusions References
Tables Figures
◭ ◮
◭ ◮
Back Close
Full Screen / Esc
Print Version
Interactive Discussion
©EGU 2004
et al., 2002). Biomass burning emits water vapor, carbon dioxide (CO2), carbon monox-ide (CO), reactive odd nitrogen (NOy=NO+NO2+products of oxidation of NOx), hydro-carbons and many other important species (Ferek et al., 1998; Andreae and Merlet, 2001). The aerosol particles emitted by biomass burning activities are very efficient in absorbing and scattering solar radiation, and act as cloud condensation nuclei, playing
5
an important role in the atmospheric radiation balance (Roberts et al., 2002; Proc ´opio et al., 2004).
As part of the LBA/CLAIRE 2001 experiment, measurements of NO, NO2 and O3 were performed in an Amazonian forest site from 11 June to 28 July 2001. The goals of the experiment included understanding the role played by the changes of the trace
10
gases concentrations in remote areas due to long range transport of pollutants. A complementary study of the pollutant transport mechanism was performed using a tracer transport model coupled to the Regional Atmospheric Modeling System – RAMS (Walko et al., 2000). The tracer transport simulation is made simultaneously, on-line with the atmospheric state evolution. This model approach was designed to study the
15
transport of biomass burning emissions in the South American and African continents and a complete model description can be found in Freitas et al. (2004).
2. Experiments and analytical methods
The measurement site was at the Limnology Laboratory (1◦55.20′S, 59◦28.07′W),
lo-cated at the Hydroelectric Power Plant of Balbina, 150 km North of Manaus, in the
20
State of Amazon, Brazil (Fig. 1). The climate of this region is tropical, rainy and warm during summer. The dry season occurs from June to November and the wet season from December to May. The red-yellow podzolicos soil predominates in nearly the whole region and is nutrient-poor, with elevated acidity and reduced natural fertility, not suitable for agricultural use. The predominant vegetation is tropical rainforest with
25
ACPD
4, 2301–2331, 2004Nitrogen oxides measurements in an
Amazon site
A. M. Cordova et al.
Title Page
Abstract Introduction
Conclusions References
Tables Figures
◭ ◮
◭ ◮
Back Close
Full Screen / Esc
Print Version
Interactive Discussion
©EGU 2004
the height of the forest canopy is about 30 m from surface.
Concentrations of NO, NO2 and O3 were measured using a Teflon tube (2 cm dia.) of total length of 14 m, continuously purging air by an auxiliary pump. A rain protected sampling head was mounted at 14 m above the surface. Air was drawn through 47 mm PTFE-filters (0.5µm pore size) and 14′′ PTFE-tubing mounted on the sample intake
5
ports of NO/NOx and O3 analyzers. Commercial gas-phase-chemiluminescence and spectrometric analyzer (model Thermo Environmental Instruments Inc.) were used to measure the trace gases. Calibration was conducted with the use of a Thermo Envi-ronmental Instruments Inc., Model 146C Gas Phase Titration & Ozone Generator. The O3and NOxmeasurements were performed at every five and one minute, respectively.
10
Stacked filter units (SFU) fitted with a PM10 inlet was used for aerosol sampling (Hopke et al., 1998; Artaxo et al., 1998, 2002). The trace elements concentrations for the SFU samples were determined by Particle-induced X-Ray Emission (PIXE) analy-sis (Johansson and Campbell, 1995; Artaxo et al., 2002). It was possible to determine the concentrations of up to 16 elements (Al, Si, P, S, Cl, K, Ca, Ti, Cr, Mn, Fe, Ni,
15
Cu, Zn, Br, and Pb). Mass concentration was obtained through gravimetric analysis and black carbon concentration of the fine fraction of the SFU filters was obtained by a light reflectance technique (Reid et al., 1998; Martins et al., 1998). A black carbon monitor, the aethalometer, manufactured by Magee Scientific Co, measured the black carbon concentration. The aethalometer was operated with 5 min time resolution, and
20
an absorption cross section of 10 m2/g was used to convert optical absorption to black carbon equivalent concentration (Martins et al., 1998; Artaxo et al., 1998).
Several balloons (Blimpworks, Statesville, NC, USA) were used during the CLAIRE 2001 in order to measure the aerosol profile (Greenberg et al., 2004). The number of particle concentration (#/cm3) was measured with Particle Measuring System Abacus
25
301 instruments in four-size interval (<0.3, 0.3–0.5, 0.5–1 and 1–5µm).
ACPD
4, 2301–2331, 2004Nitrogen oxides measurements in an
Amazon site
A. M. Cordova et al.
Title Page
Abstract Introduction
Conclusions References
Tables Figures
◭ ◮
◭ ◮
Back Close
Full Screen / Esc
Print Version
Interactive Discussion
©EGU 2004
approximately 1200 m were measured with a doppler SOnic Detection And Ranging system (SODAR) of the Remtech Inc.
3. Results and discussions
3.1. Meteorological conditions
The months of June and July typically correspond to the transition from the wet to the
5
dry season in northern Brazil. During June 2001, the Intertropical Convergence Zone (ITCZ) contributed to the rain in the northern coast of Brazil with positive anomalies of precipitation extending from the coast to about 200–400 km inland. Conversely, in the Southwest and Northeast of the Amazon basin the precipitation was lower than average. In July, the amount of rain was lower, compared to the June values, and
10
below average on the northern part of the Amazon Basin extending to the northern coast of Brazil. During the field campaign, the total accumulated precipitation was of 250 mm at the experimental site.
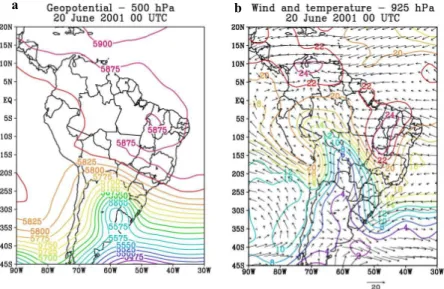
In June, the approach of a mid-latitude cold front caused a climatological phe-nomenon called friagem (Marengo et al., 1997a, b). A continental air mass that
15
reached southern Brazil on 16 June, moved through the central region of Brazil and reached the Amazon Basin after three days (Fig. 1a). Figure 2a shows the geopoten-tial height at 500 hPa and Fig. 2b the temperature and wind fields NCEP reanalysis at 925 hPa for 20 June 2001 at 00:00 UTC. The southerly flow extends over most of western Brazil with the leading edge reaching the equator. The frontal boundary in
20
the subtropics is associated with a well defined upper level geopotential trough with a cut offlow over Uruguay. Low level cold air advection is located ahead of the 500 hPa trough.
The cold air mass approach caused a strong decrease of temperature in the Amazon basin and was maintained up to 22 June. Thisfriagemcaused frost in southern and
25
ACPD
4, 2301–2331, 2004Nitrogen oxides measurements in an
Amazon site
A. M. Cordova et al.
Title Page
Abstract Introduction
Conclusions References
Tables Figures
◭ ◮
◭ ◮
Back Close
Full Screen / Esc
Print Version
Interactive Discussion
©EGU 2004
and humidity values were observed in Balbina. Figure 3 shows the difference between average values of equivalent potential temperature (θE) for the CLAIRE 2001 period, excluding the days influenced by the cold front and the average for the days during the cold front. It is possible to observe a decrease ofθE of 9 K at night and 14 K during daytime. The cold front also caused a decrease in the amount of solar radiation
reach-5
ing the surface at this site during this period, from 345 to 113 W/m2 due cloudiness associated with it (Fig. 4). The vertical profile of the meridional winds from the SODAR shows an enhancement of the wind speed reaching 6 to 8 m/s, above 100 m altitude, during the cold front (Fig. 5a), also with an increase in the wind shear (Fig. 5b). These changes were observed only for this episode during the whole period of the campaign.
10
The change in the direction of the air mass origin was also correctly captured by the atmospheric numerical simulation of the period using the RAMS model. Backward tra-jectories from Balbina, for the previous day of the cold front arrival show the air mass originating from the Atlantic Ocean, as can be seen in Fig. 6a. During the cold front approach period, the backward trajectories show different origins of the air parcels,
15
coming from South and Southeast Brazil (Fig. 6b). 3.2. Trace gases
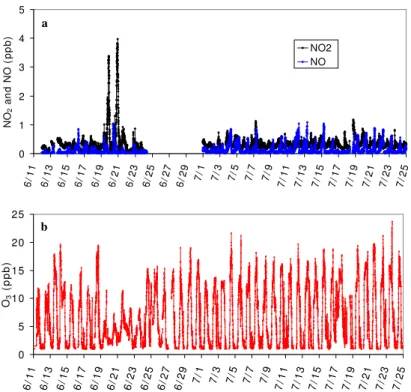
Figure 7a shows the time series for NO and NO2mixing ratio from 11 June to 25 July 2001. NO2 concentrations were higher than NO concentrations during all the study period, with NO concentration below 1.0 ppb. During the cold front period, an increase
20
of NO2concentration was observed, with the maximum concentration of 4 ppb, during the night of 19 and 20 July. On the other hand, no significant change of NO was observed in association to the NO2enhancement. The O3concentrations were always below 25 ppb, which is characteristic of pristine areas (Kirchhoff et al., 1988; Betts et al., 2002). A decrease of the O3 concentration was observed during the cold front
25
episode, probably due the decrease in the incident solar radiation (Fig. 7b).
ACPD
4, 2301–2331, 2004Nitrogen oxides measurements in an
Amazon site
A. M. Cordova et al.
Title Page
Abstract Introduction
Conclusions References
Tables Figures
◭ ◮
◭ ◮
Back Close
Full Screen / Esc
Print Version
Interactive Discussion
©EGU 2004
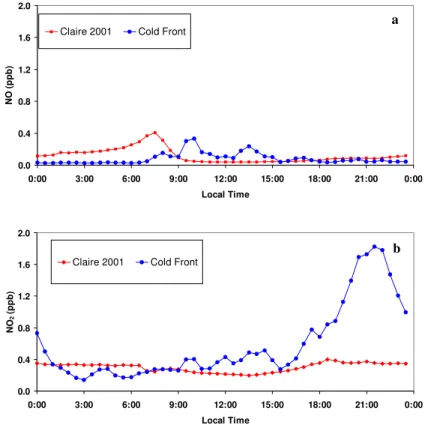
CLAIRE 2001 considers all days of campaign, excluding the days influenced by the cold front, and conversely, the called cold front episode includes the days from 19 to 22 June. Figures 8 and 9 show the average diurnal variation of NO, NO2and O3obtained for these two periods. Figure 8a shows the average NO concentration during CLAIRE 2001 presenting an increase during the first hours of the day, which could be a result
5
of the accumulation of NO emitted at night (De Serve et al., 1996) and the photolysis of the accumulated nocturnal NO2 produced by the reaction of NO and O3after sun-set. After sunrise, the turbulent mixing in the convective boundary layer causes the dispersion of gases, reducing their concentrations. During the cold front episode, the average NO concentration was similar to CLAIRE 2001, but the diurnal cycle shows
10
no night accumulation of NO; this could indicate a lower emission from the soil due to the lower surface temperature observed in this period (Fig. 3). On the other hand, during the cold front the NO concentration sunlight time was slightly higher than it was for CLAIRE 2001, which could be a response to the NO2 photolysis inhibition due to the lower solar radiation availability in this period (Fig. 4).
15
The diurnal cycle of NO2 concentration during CLAIRE 2001 period presented an average of 0.35 ppb at night, reaching the minimum concentration of 0.2 ppb at 13:00– 14:00 LT (Fig. 8b), due to the maximum solar radiation availability. A decrease in NO2 concentrations during the first hours of the day was observed, because of the photoly-sis of NO2 that also caused an increase of the NO concentration (Fig. 8a). During the
20
day, NO2concentration decreased due to photolysis, reactions with OH radical to form HNO3(Fuglestvedt et al., 1994) and dispersion caused by turbulent processes. Aver-age NO2 concentrations during the cold front episode were similar to CLAIRE 2001, but at 18:00 LT an increase of up to 1.8 ppb was observed, with maximum instant con-centration of 4 ppb. This increased concon-centration can be a result of regional transport
25
associated with the frontal system that also caused changes in the wind directions and increased the wind speed and wind shear (Fig. 5).
ACPD
4, 2301–2331, 2004Nitrogen oxides measurements in an
Amazon site
A. M. Cordova et al.
Title Page
Abstract Introduction
Conclusions References
Tables Figures
◭ ◮
◭ ◮
Back Close
Full Screen / Esc
Print Version
Interactive Discussion
©EGU 2004
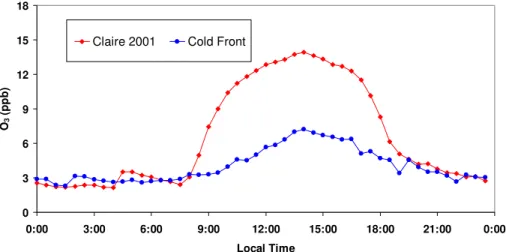
period, the average day maximum of 14.5 ppb was reached around 12:00–15:00 LT, while the average ozone concentration at night was around 3.2 ppb. During the cold front, average ozone concentration was two times lower than daytime average value for the CLAIRE 2001, although at night the O3 concentrations were comparable for both periods. The low photochemical production of ozone during the cold front can
5
be related to the high cloud cover, which inhibits solar radiation reaching the surface (Fig. 4). The lower ozone concentration can also be due to the lower volatile organic compounds (VOCs) concentrations. The VOCs react with NOx to form O3, but the emission of VOCs also depends on temperature and radiation availability (Guenther et al., 1995). During the cold front, the decrease of temperature and radiation can
10
be responsible for the low emission of VOCs, which in turn causes a decrease in the photochemical production of O3.
3.3. Aerosol
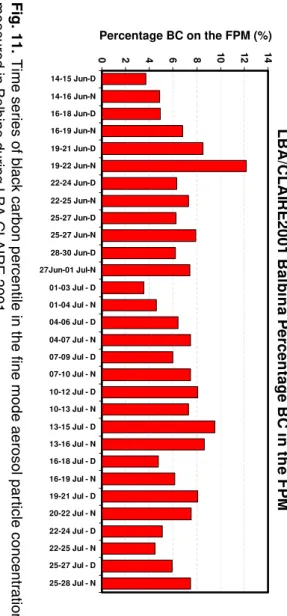
Figure 10 shows black carbon concentration for CLAIRE 2001 and cold front periods. Black carbon presented a similar behavior of the NO2. The average black carbon
15
concentration during CLAIRE 2001 was 92 ng/m3, with no clear diurnal cycle. During the cold front episode, black carbon concentration showed an increase after sunset reaching the maximum concentration of 224 ng/m3. The filters sampled between 19 and 21 June at nighttime presented about 12.3% of black carbon in the fine mode particulate material (Fig. 11). This ratio was the highest for the all campaign. This
20
increase in black carbon reinforces the suspicion of a transport of biomass burning products from the South advected by the frontal system. An increase in the particulate matter coarse mode of the aerosol particle concentration was also observed during the cold front episode. The analysis of the sampled filters shows an increase of soil dust in the coarse mode (Fig. 12); consistent with the observed wind speed increase.
25
parti-ACPD
4, 2301–2331, 2004Nitrogen oxides measurements in an
Amazon site
A. M. Cordova et al.
Title Page
Abstract Introduction
Conclusions References
Tables Figures
◭ ◮
◭ ◮
Back Close
Full Screen / Esc
Print Version
Interactive Discussion
©EGU 2004
cle number concentration decreases with the increase of the particle size for all days. The profile of concentration of aerosol particles with diameter smaller than 0.5µm in-creased with altitude, while the concentration for larger particles (0.5<dp<1µm and
1<dp<5µm) was constant with altitude. Differences in the aerosol concentration were
observed between the days before and during the cold front. The aerosol profiles
5
of particles with diameter less than 0.5µm showed concentrations three times higher during the cold front than during the previous days, while larger particle profiles did not show a significant difference between the two periods.
The increase of NO2and black carbon suggested products of biomass burning. Al-though burning activities were not detected nearby the study area in June, the fire
prod-10
uct from the GOES-8 WF ABBA (Prins et al., 1998) indicated hot spots from biomass burning in the southern portion of the study area (Fig. 14), which could be the possible source of the high NO2and aerosols concentrations measured at Balbina during a cold front approach.
3.4. Model results
15
This section describes the role of a mid-latitude cold front approaching the Amazon basin on 20 and 21 June, on the polluted air mass transport to pristine areas in the Amazon using a numerical simulation with RAMS and the on-line biomass burning emission and transport model (Freitas et al., 2004). Although June and July is a tran-sition period between wet to dry season, the biomass burning fires in the cerrado and
20
pasture areas in Central Brazil start earlier in the biomass burning season. Particularly on 15 June many fires were detected in this area by the GOES-8 WF ABBA fire product (Fig. 14). Figure 15a presents the model results for particulate material (dp<2.5µm, PM2.5) vertically integrated (mg/m2) on 16 June and Fig. 15b a vertical cross section of PM2.5 concentration (µg/m3) at longitude 59.5 W, depicting the atmospheric
pollu-25
ACPD
4, 2301–2331, 2004Nitrogen oxides measurements in an
Amazon site
A. M. Cordova et al.
Title Page
Abstract Introduction
Conclusions References
Tables Figures
◭ ◮
◭ ◮
Back Close
Full Screen / Esc
Print Version
Interactive Discussion
©EGU 2004
most evident effect of the cold front approaching Central Brazil and the Amazon is the northward transport of biomass burning pollutants. Following the cold front approach, the polluted air in Central South America is replaced by a clean and cold air behind it, and the smoke is then pushed into the Amazon basin changing the pristine air pat-tern. During this event smoke transport was also observed at the Northwest Amazon,
5
an area much more cloudy than Central Brazil. Less obvious is the effect of the as-sociated convective systems on the smoke particulate and gaseous distribution, as it involves an enhancement of the vertical transport and precipitation and consequent smoke scavenging, including NOxdeposition (via soluble nitric acid). High troposphere smoke input has been already observed associated with Northwest Amazon convective
10
systems (Freitas et al., 2000).
4. Conclusions
The increase of the observed NO2, fine particles and black carbon concentrations at pristine areas of Amazon basin, reinforce the hypothesis of biomass burning products being transported from the South by the cold front. Modeling results using backward
15
trajectories calculation and a Eulerian tracer transport model have confirmed this hy-pothesis, linking enhancements of pollution signals at remote area of Amazon basin with fires activities at Central of Brazil.
Acknowledgements. This study was carried out as part of the Large-Scale
Biosphere-Atmosphere Experiment in Amaz ˆonia (LBA). The authors are thankful to FAPESP “Fundac¸ ˜ao
20
de Amparo `a Pesquisa do Estado de S ˜ao Paulo” for financial support through the scholarship of A. M. Cordova, projects 01/05296-8 (K. Longo), 01/05025-4 (S. Freitas), and 97/11358-9 (L. V. Gatti and P. Artaxo). P. Artaxo also thanks to CNPq (Projeto Milnio) for financial support. Acknowledgments for A. Yamasaki, A. Pretto, W. C. Martins, A. C. Ribero, A. L. Ribeiro and T. Germano assistance during the field campaign.
ACPD
4, 2301–2331, 2004Nitrogen oxides measurements in an
Amazon site
A. M. Cordova et al.
Title Page
Abstract Introduction
Conclusions References
Tables Figures
◭ ◮
◭ ◮
Back Close
Full Screen / Esc
Print Version
Interactive Discussion
©EGU 2004
References
Andreae, M. O., Artaxo, P., Fischer, H., Freitas, S. R., Gr ´egoire, J.-M., Hansel, A., Hoor, P., Kormann, R., Krejci, R., Lange, L., Lelieveveld, J., Lindinger, W., Longo, K., Peters, W., de Reus, M., Scheeren, B., Silva-Dias, M. A. F., Strom, J., van Velthoven, P. F. J., and Williams, J.: Transport of biomass burning smoke to the upper troposphere by deep convection in the
5
equatorial region, Geophys. Res. Lett., 28, 6, 951–954, 2001.
Andreae, M. O. and Merlet., P.: Emission of trace gases and aerosols from biomass burning, Global Biogeochemical Cycles, 15, 955–966, 2001.
Andreae, M. O., Artaxo, P., Brand ˜ao, C., Carswell, F. E., Ciccioli, P., da Costa, A. L., Culf, A. D., Esteves, J. L., Gash, J. H. C., Grace, J., Kabat, P., Lelieveld, J., Malhi, Y., Manzi, A.
10
O., Meixner, F. X., Nobre, A. D., Nobre, C., Ruivo, M. d. L. P., Silva-Dias, M. A., Stefani, P., Valentini, R., von Jouanne, J., and Waterloo, M. J.: Biogeochemical cycling of carbon, water, energy, trace gases, and aerosols in Amazonia: The LBA-EUSTACH experiments, J. Geophys. Res., 107, (D20), 8066–8091, doi:10.1029/2001JD000524, 2002.
Artaxo, P., Martins, J. V., Yamasoe, M. A., Proc ´opio, A. S., Pauliquevis T. M., Andreae, M. O.,
15
Guyon, P., Gatti, L. V., and Cordova, A. M.: Physical and chemical properties of aerosols in the wet and dry season in Rondonia, Amazonia, J. Geophys. Res., 107, (D20), 8081, doi:10.1029/2001JD000666, 2002.
Artaxo, P., Fernandes, E. T., Martins, J. V., Yamasoe, M. A., Hobbs, P. V., Maenhaut, W., Longo, K. M., and Castanho, A.: Large-scale aerosol source apportionment in Amazonia, J.
20
Geophys. Res, 103, (D24), 31 837–31 847, 1998.
Atkinson, R.: Atmospheric chemistry of VOCs and NOX, Atmos. Environ., 34, 2063–2101, 2000.
Betts, A., Gatti, L. V., Cordova, A. M., Silva-Dias, M. A. F., and Fuentes, M.: Transport of ozone to the surface by convective downdrafts at night, J. Geophys. Res., 107, (D20),
25
doi:10,029/2000JD00158, 2002.
Browell, E. V. and Fenn, M. A.: Ozone and aerosol distributions and air mass characteristic over the south Atalantic basin during the burning season, J. Geophys. Res., 101, (D1), 24 043– 24 068, 1996.
Cardenas, L., Randon, A., Johanson, C., and Sanhueza, E.: Effects of soil moisture,
tempera-30
ACPD
4, 2301–2331, 2004Nitrogen oxides measurements in an
Amazon site
A. M. Cordova et al.
Title Page
Abstract Introduction
Conclusions References
Tables Figures
◭ ◮
◭ ◮
Back Close
Full Screen / Esc
Print Version
Interactive Discussion
©EGU 2004
Crutzen, P. J. and Andreae, M. O.: Biomass Burning in the Tropics: Impact on Atmospheric Chemistry et Biogeochemical Cycles, Science, 250, 1669–1678, 1990.
Crutzen, P. J., Williams, J., Hoor, P., Fischer, H., Warneke, R., Holzinger, R., Hansel, A., Lindinger, W., Scheeren, B., and Lelieveld, J.: High spatial and temporal resolution mea-surement of primary organics and their oxidant products over the tropical forest of Surinam,
5
Atmos. Environ., 34, 1161–1165, 2000.
Davidson, E. A., Keller, M., Erickson, H. E., Verchot, L. V., and Veldkamp, E.: Testing a concep-tual model of soil emissions of nitrous and nitric oxides, BioScience, 50, 667–680, 2000. Davison, E. A.: Sources of nitric oxide and nitrous oxide following welling of dry soil, Soil SC.
Soc. Of Am. J., 56, 95–102, 1992.
10
De Serve, C., Rondon, A., and Oyola, P.: Photochemical studies in the savanna boundary layer during wet season, Atm. Environ., 30, 1419–1427, 1996.
Ferek, R. J., Reid, J. S., Hobbs, P. V., Blake, D. R., and Liousse, C.: Emission factors of hydrocarbons, halocarbons, trace gases and particles from burning in Brazil, J. Geophys. Res., 103, D24, 32 107–32 118, 1998.
15
Freitas, S. R., Silva-Dias, M. A. F., Silva-Dias, P. L., Longo, K. M., Artaxo, P., Andreae, M. O., and Fischer, H. A.: Convective kinematic trajectory technique for low-resolution atmospheric models, J. Geophys. Res., 105, (D19), 24 375–24 386, 2000.
Freitas, S. R., Longo, K. M., Silva-Dias, M. A. F., Silva-Dias, P. L., Chatfield, R., Prins, E., Artaxo, P., and Recuero, F. S.: Monitoring the Transport of Biomass Burning Emissions in
20
South America, Environmental Fluid Mechanics, 5th RAMS Users Workshop Specia Issue, in press, 2004.
Fuglestvedt, J. S., Jonson, J. E., and Isaksen, I. S. A.: Effects of reduction in stratospheric ozone on tropospheric chemistry through changes in photolysis rates, Tellus, 46B, 172–192, 1994.
25
Greenberg, J. P., Guenther, A. B., P ´etron, G., Wiedinmyer, C., Vega, O., and Gatti, L. V.: Biogenic VOC emissions from forest and cleared Amazonian landscapes, Global Change Biology, in press, 2004.
Guenther, A., Hewitt, C. N., Erickson, D., Fall, R., Geron, C., Graedel, T., Harley, P., Klinger, L., Lerdau, M., McKay, W. A., Pierce, T., Scholes, B., Steinbrecher, R., Tallamraju, R., Taylor,
30
J., and Zimmerman, P. A.: Global model of natural volatile organic compound emissions, J. Geophys. Res., 100, 8873–8892, 1995.
ACPD
4, 2301–2331, 2004Nitrogen oxides measurements in an
Amazon site
A. M. Cordova et al.
Title Page
Abstract Introduction
Conclusions References
Tables Figures
◭ ◮
◭ ◮
Back Close
Full Screen / Esc
Print Version
Interactive Discussion
©EGU 2004
particle composition data, J. Aerosol Sci., 29, 515–516, 1998.
Jacob, D. J. Heikes, B. G., Fan, S.-M., Logan, J. A., Mauzerall, D. L., Bradshaw, J. D., Singh, G. L., Gregory, G. L., Talbot, R. W., Balke, D. R., and Sachse, G. W.: The origin of ozone and NOx in the tropical troposphere: A photochemical analysis of aircraft observation over the South Atlantic basin, J. Geophys. Res., 101, (D2), 24 235–24 250, 1996.
5
Johansson, S. A. E., Campbell, J. L., and Malmqvist, K. G. (Eds.): Particle-Induced X-Ray Emission Spectrometry (PIXE), John Wiley, New York, 1995.
Kaplan, W. A., Wofsy, S. C., Keller, M., and da Costa, J. M.: Emission of NO and deposition of O3 in tropical forest system, J. Geophys. Res., 93, 1389–1395, 1998.
Kirchhoff, V. W. J. H.: Surface ozone measurements in Amazonia, J. Geophys. Res., 93, (D2),
10
1469–1476, 1988.
Kirchhoff, V. W. J. H. and Alval ´a, P. C.: Overview of an aircraft expedition into the Brazilian cer-rado for the observation of atmospheric trace gases, J. Geophys. Res., 101, (D19), 23 957– 23 982, 1996.
Marengo, J. A., Cornejo, A., Satyamurty, P., Nobre, C. A., and Sea, W.: Cold waves in the
15
South American continent: The strong event of June 1994, Mon. Wea. Rev., 125, 2759– 2786, 1997a.
Marengo, J. A., Nobre, C. A., and Culf, A. D.: Climatic impacts of the “friagens” in the Amazon region, J. Appl. Meteorol., 36, 1553–1566, 1997b.
Martins, J. V., Artaxo, P. Liousse, C., Reid, J. S., Hobbs, P. V., and Kaufman, Y.: Effects of
20
black carbon content, particle size, and mixing on light absorption by aerosols from biomass burning in Brazil, J. Geophys. Res , 103, (D4), 32 041–32 050, 1998.
Prins, E. M., Feltz, J. M., Menzel, W. P., and Ward, D. E.: An overview of GOES-8 Diurnal Fire and Smoke Results for SCAR-B and 1995 Fire Season in South America, J. Geophys. Res., 103, D24, 31 821–31 835, 1998.
25
Proc ´opio, A. S., Artaxo, P., Kaufman, Y. J., Remer, L. A., Schafer, J. S., and Hollben, B. N.: Mul-tiyear Analysis of Amazonian Biomass Burning Smoke Radiative Forcing of Climate, Geo-phys. Res. Lett., 31, L03108, doi:10.1029/2003GL018646, 2004.
Reid, J. S., Hobbs, P. V., Liousse, C., Martins. J. V., Weiss, E., and Eck, T. F.: Comparisons of techniques for measuring shortwave absorption and black carbon content of aerosols from
30
biomass burning in Brazil, J. Geophys. Res., 103, (D24), 32 031–32 040, 1998.
ACPD
4, 2301–2331, 2004Nitrogen oxides measurements in an
Amazon site
A. M. Cordova et al.
Title Page
Abstract Introduction
Conclusions References
Tables Figures
◭ ◮
◭ ◮
Back Close
Full Screen / Esc
Print Version
Interactive Discussion
©EGU 2004
Geophys. Res., 107, doi:10.1029/2001JD000583, 2002.
Seinfeld, J. H. and Pandis, S. N.: Atmospheric composition, global cycles, and lifetime, In: “Atmospheric chemistry and physics: from air pollution to climate change”, edited by John Wiley & Sons Inc., USA, 49–124, 1998.
Thompson, A. M.: Oxidants in the unpolluted marine atmosphere, Environmental Oxidants,
5
edited by Nriagu, J. O. and Simmons, M. S., pp. 31–61, John Wiley, New York, 1994. Thompson, A. M., Tao, W.-K., Pickering, K. E., Scala, J. R., and Simpson, J.: Tropical deep
convection and ozone formation, Bull. Amer. Meteor. Soc., 78, 1043–1054, 1997.
Thompson, A. M., Witte, J. C., Hudson, R. D., Guo, H., Herman, J. R., and Fujiwara, M.: Tropical tropospheric ozone and biomass burning, Science, 291, 2128–2132, 2001.
10
ACPD
4, 2301–2331, 2004Nitrogen oxides measurements in an
Amazon site
A. M. Cordova et al.
Title Page
Abstract Introduction
Conclusions References
Tables Figures
◭ ◮
◭ ◮
Back Close
Full Screen / Esc
Print Version
Interactive Discussion
©EGU 2004
ACPD
4, 2301–2331, 2004Nitrogen oxides measurements in an
Amazon site
A. M. Cordova et al.
Title Page
Abstract Introduction
Conclusions References
Tables Figures
◭ ◮
◭ ◮
Back Close
Full Screen / Esc
Print Version
Interactive Discussion
©EGU 2004
(a) (b)
(a) (b)
a b
ACPD
4, 2301–2331, 2004Nitrogen oxides measurements in an
Amazon site
A. M. Cordova et al.
Title Page
Abstract Introduction
Conclusions References
Tables Figures
◭ ◮
◭ ◮
Back Close
Full Screen / Esc
Print Version
Interactive Discussion
©EGU 2004
330 335 340 345 350 355 360
0:00 3:00 6:00 9:00 12:00 15:00 18:00 21:00 0:00
Local Time
θ
E
(K)
Claire 2001 Cold Front
ACPD
4, 2301–2331, 2004Nitrogen oxides measurements in an
Amazon site
A. M. Cordova et al.
Title Page
Abstract Introduction
Conclusions References
Tables Figures
◭ ◮
◭ ◮
Back Close
Full Screen / Esc
Print Version
Interactive Discussion
©EGU 2004
0 100 200 300 400 500 600 700
0:00 3:00 6:00 9:00 12:00 15:00 18:00 21:00 0:00
Local Time
R
a
di
a
ti
on (
W
/m
2)
Claire 2001 Cold Front
ACPD
4, 2301–2331, 2004Nitrogen oxides measurements in an
Amazon site
A. M. Cordova et al.
Title Page
Abstract Introduction
Conclusions References
Tables Figures
◭ ◮
◭ ◮
Back Close
Full Screen / Esc
Print Version
Interactive Discussion
©EGU 2004
ACPD
4, 2301–2331, 2004Nitrogen oxides measurements in an
Amazon site
A. M. Cordova et al.
Title Page
Abstract Introduction
Conclusions References
Tables Figures
◭ ◮
◭ ◮
Back Close
Full Screen / Esc
Print Version
Interactive Discussion
©EGU 2004
ACPD
4, 2301–2331, 2004Nitrogen oxides measurements in an
Amazon site
A. M. Cordova et al.
Title Page Abstract Introduction Conclusions References Tables Figures ◭ ◮ ◭ ◮ Back Close
Full Screen / Esc
Print Version
Interactive Discussion
©EGU 2004
0 1 2 3 4 5 6/1 1 6/1 3 6/1 5 6/1 7 6/1 9 6/2 1 6/2 3 6/2 5 6/2 7 6/2 9
7/1 7/3 7/5 7/7 7/9
7/1 1 7/1 3 7/1 5 7/1 7 7/1 9 7/2 1 7/2 3 7/2 5 N O2 a n d N O ( p p b ) NO2 NO 0 5 10 15 20 25 6/1 1 6/1 3 6/1 5 6/1 7 6/1 9 6/2 1 6/2 3 6/2 5 6/2 7 6/2 9
7/1 7/3 7/5 7/7 7/9
7/1 1 7/1 3 7/1 5 7/1 7 7/1 9 7/2 1 7/2 3 7/2 5 O3 ( p p b ) a b
ACPD
4, 2301–2331, 2004Nitrogen oxides measurements in an
Amazon site
A. M. Cordova et al.
Title Page
Abstract Introduction
Conclusions References
Tables Figures
◭ ◮
◭ ◮
Back Close
Full Screen / Esc
Print Version
Interactive Discussion
©EGU 2004
0.0 0.4 0.8 1.2 1.6 2.0
0:00 3:00 6:00 9:00 12:00 15:00 18:00 21:00 0:00
Local Time
NO
(pp
b)
Claire 2001 Cold Front
0.0 0.4 0.8 1.2 1.6 2.0
0:00 3:00 6:00 9:00 12:00 15:00 18:00 21:00 0:00
Local Time
NO
2
(
ppb)
Claire 2001 Cold Front
a
b
ACPD
4, 2301–2331, 2004Nitrogen oxides measurements in an
Amazon site
A. M. Cordova et al.
Title Page
Abstract Introduction
Conclusions References
Tables Figures
◭ ◮
◭ ◮
Back Close
Full Screen / Esc
Print Version
Interactive Discussion
©EGU 2004
0 3 6 9 12 15 18
0:00 3:00 6:00 9:00 12:00 15:00 18:00 21:00 0:00
Local Time
O3
(p
pb
)
Claire 2001 Cold Front
ACPD
4, 2301–2331, 2004Nitrogen oxides measurements in an
Amazon site
A. M. Cordova et al.
Title Page
Abstract Introduction
Conclusions References
Tables Figures
◭ ◮
◭ ◮
Back Close
Full Screen / Esc
Print Version
Interactive Discussion
©EGU 2004
0 50 100 150 200 250
0:00 3:00 6:00 9:00 12:00 15:00 18:00 21:00 0:00
Local Time
BC (n
g/
m
3)
Claire 2001 Cold Front
A
CPD
4 , 2301–2 331, 200 4 Nitr og en o xides measuremen ts in an Amazon site A. M. C ordo va e t al. Title P age Abstr act Introduction Conclusions Ref erences T ab les Figures ◭ ◮ ◭ ◮ Bac k Close Full Screen / Esc Pr int V ersion Inter activ e Discussion © EGU 2004 L B A /C L A IR E 2001 B a lb in a P e rcen ta g e B C i n t h e F P M0 2 4 6 8 10 12 14
14-15 Jun-D 14-16 Jun-N 16-18 Jun-D 16-19 Jun-N 19-21 Jun-D 19-22 Jun-N 22-24 Jun-D 22-25 Jun-N 25-27 Jun-D 25-27 Jun-N 28-30 Jun-D 27Jun-01 Jul-N 01-03 Jul - D 01-04 Jul - N 04-06 Jul - D 04-07 Jul - N 07-09 Jul - D 07-10 Jul - N 10-12 Jul - D 10-13 Jul - N 13-15 Jul - D 13-16 Jul - N 16-18 Jul - D 16-19 Jul - N 19-21 Jul - D 20-22 Jul - N 22-24 Jul - D 22-25 Jul - N 25-27 Jul - D 25-28 Jul - N
Percentage BC on the FPM (%)
A
CPD
4 , 2301–2 331, 200 4 Nitr og en o xides measuremen ts in an Amazon site A. M. C ordo va e t al. Title P age Abstr act Introduction Conclusions Ref erences T ab les Figures ◭ ◮ ◭ ◮ Bac k Close Full Screen / Esc Pr int V ersion Inter activ e Discussion © EGU 2004 LB A /C L A IR E 2001 B a lb in a P e rcent a ge soi l i n t h e C P M0 2 4 6 8 10 12 14
14-15 Jun-D 14-16 Jun-N 16-18 Jun-D 16-19 Jun-N 19-21 Jun-D 19-22 Jun-N 22-24 Jun-D 22-25 Jun-N 25-27 Jun-D 25-27 Jun-N 28-30 Jun-D 27Jun-01 Jul-N 01-03 Jul - D 01-04 Jul - N 04-06 Jul - D 04-07 Jul - N 07-09 Jul - D 07-10 Jul - N 10-12 Jul - D 10-13 Jul - N 13-15 Jul - D 13-16 Jul - N 16-18 Jul - D 16-19 Jul - N 19-21 Jul - D 20-22 Jul - N 22-24 Jul - D 22-25 Jul - N 25-27 Jul - D 25-28 Jul - N
Percentage soil on the CPM (%)
ACPD
4, 2301–2331, 2004Nitrogen oxides measurements in an
Amazon site
A. M. Cordova et al.
Title Page Abstract Introduction Conclusions References Tables Figures ◭ ◮ ◭ ◮ Back Close
Full Screen / Esc
Print Version
Interactive Discussion
©EGU 2004
particle size < 0.3 µm
0 100 200 300 400 500 600 700
0.01 0.1 1 10 100 1000 10000
conc [#/cm3] a lti tu de [m ] 6/12/2001 6/14/2001 6/16/2001 6/19/2001 6/20/2001 6/21/2001
particle size 0.3-0.5 µm
0 100 200 300 400 500 600 700
0.01 0.1 1 10 100 1000 10000
conc [#/cm3] a lt it ude [ m ] 6/12/2001 6/14/2001 6/16/2001 6/19/2001 6/20/2001 6/21/2001 a b
particle size 0.5-1 µm
0 100 200 300 400 500 600 700
0.01 0.1 1 10 100 1000 10000
conc [#/cm3] a ltitu d e [m ] 6/12/2001 6/14/2001 6/16/2001 6/19/2001 6/20/2001 6/21/2001
particle size 1-5 µm
0 100 200 300 400 500 600 700
0.01 0.1 1 10 100 1000 10000
conc [#/cm3] a lt itud e [m ] 6/12/2001 6/14/2001 6/16/2001 6/19/2001 6/20/2001 6/21/2001 c d
Fig. 13.Particle size vertical profiles for diameter ranges: (a)<0.3,(b)0.3–0.5,(c)0.5–1.0 and
ACPD
4, 2301–2331, 2004Nitrogen oxides measurements in an
Amazon site
A. M. Cordova et al.
Title Page
Abstract Introduction
Conclusions References
Tables Figures
◭ ◮
◭ ◮
Back Close
Full Screen / Esc
Print Version
Interactive Discussion
©EGU 2004
ACPD
4, 2301–2331, 2004Nitrogen oxides measurements in an
Amazon site
A. M. Cordova et al.
Title Page
Abstract Introduction
Conclusions References
Tables Figures
◭ ◮
◭ ◮
Back Close
Full Screen / Esc
Print Version
Interactive Discussion
©EGU 2004
ACPD
4, 2301–2331, 2004Nitrogen oxides measurements in an
Amazon site
A. M. Cordova et al.
Title Page
Abstract Introduction
Conclusions References
Tables Figures
◭ ◮
◭ ◮
Back Close
Full Screen / Esc
Print Version
Interactive Discussion
©EGU 2004