Implementation of New Pairing Technique
for Studying the Effectiveness of Pairs on
Persona and Programming
HARSIMARJEET KHURANA
ASSISTANT PROFESSOR
Gurunanak Institute of Management and Technology Gujarkhan Campus, Model Town
Ludhiana, Punjab, India
DR. J.S. SOHAL
DIRECTOR
Ludhiana College of Engineering and Technology Katanikalan
Ludhiana, Punjab, India
Abstract :
This paper reports on a study in which persona for the category of paired and solo students were compared on the parameter like program clarity, presentation, satisfaction level and confidence level, alsothe effectiveness of pairs in a JAVA programming language and the impact of pairs on each other. In this study same programs were given to all the category of paired and solo students. Finding reported in this paper are that pairing students were more likely to turn in working programs, and these programs were correctly implemented with more required features as compared to solo students. It has been observed that pairing of intelligent, average and poor with themselves has not shown significant differences but we have seen significant differences with combination of pairs.
Keywords
Pair programming; XP; Confidence; Satisfaction, Presentation
Introduction
As it is rightly said two pairs are better than one. It means working in pairs is better than working alone. This paper is divided into two broad areas- a. to study the impact of pairs on persona b. to study the effectiveness of pairs in programming language. For persona parameters like confidence level, satisfaction level, presentation and program clarity and for effectiveness in programming language parameter like number of lines checked, tested methods, executed cases, executable lines were studied.
Comparison of Preceding Work Done On Pair Programming Table1 YEAR AUTHOR NAME TOOL PROFESSIONAL / STUDENTS PERSONALITY VARIABLES EFFCTIVE/ PARTIAL EFFECTIVE/ NOT EFFECTIVE RESULTS
2002 Dick et al. Action
Research
Professional Communication,
ComforTable, Confidence, Compromise
PP is effective The four personality variables are posited as beneficial for pair programming
2003 Thomas Survey Students Self
confidence(9 point scale from Code-Warrior to Code-a-phobe)
PP is partial effective Evidence that students who have considerable self confidence do not enjoy the experience of pair
programming as much as other students and that students produce their best work when placed in pairs with students of similar confidence levels.
2004 Choi Survey
Experiment
Professional and student both
MBTI PP is partial
effective
programmers which predefined factors they thought most influences pair
programming and revealed that personality, communicati on and genders as the perceived most influential factors. (The other predefined factors were programming skill, cognitive programming style, familiarity, and pair protocol.)
2004 Katira
et al.
Regression Students MBTI PP is partial
effective
Differences in personality types led to higher compatibility for one session of the experiment (significant), but not the other. However, 90% of pairs (randomly allocated and irrespective of
personality) report compatibility.
2006 Chao et al. Survey
Experiment
Professional and student both
Open minded, Logical, Responsible, Attentive
PP is partial effective
The
in higher quality code than the low/low combination (non-significant)
2006 Hanks Survey Students Confidence PP is effective Students with
the greatest confidence had the most positive responses to pair
programming attitude questions
2006 Layman Regression Students MBTI, FSLS PP is partial
effective
Personality type (MBTI) and learning styles (FSLS) had little effect on the attitude change. Students who disliked collaborative experiences were predominantl y reflective learners, introverts, and strong coders 2006 Sftetsos
et al.
Experiment Students KTS PP is effective Better
performance and
collaboration-viability for pairs with mixed temperament.
2006 Williams
et al.
Regression Students MBTI, FSLS PP is partial
effective
allocated and irrespective of
personality) report compatibility.
2010 Hannay
and Arisholm
Regression path analysis regression trees
Professionals Big five PP is partial
effective
Low support of
hypotheses. Other factors than personality have greater impact.
Table 2(a)
Year Name Subject Pairing
technique
Pair Programming Effective/Partial effective/ Not effective
objective
1998 Nosek Professionals Random PP effective Comparison
between
productivity of pair and solo
programmers
2000 Williams Students Random PP is effective Comparison
between
productivity of pair and solo students
2001 Nawrocki and
Wojciechowski
Students Random PP is not effective Comparison
between solo and pair students
2002 Baheti et al. Students Pairs divided in
distributed and collocated
PP is partial effective
Comparison between distributed and collocated pair programming
2002 Rostaher &
Hericko
Students Random PP is not effective Time spend on
testing by group of professional programmers working in pairs and a control group programming
2003 Heiberg et al. Students Random PP is partial
effective
Effect on Developers Technical Productivity
2005 Canfora et al. Students Random PP effective To study the
productivity of PP
Boehm between Pair Development and
software
development with Inspection as verification technique in Thailand
2006 Madeyski Students Random PP is partial
effective
To provide an empirical evidence of the impact of both practices on package dependencies playing a role of package level design quality indicators
2006 Lui and Chan Professionals Sorted by marks
and Repeat Programming
PP is effective Comparison
between novice-novice vs expert epert
2006 Mu ller Students Pretest
performance based
PP is not effective Comparison of development cost between solo and pair
2007 Arisholm et al. Professionals Random PP is partial
effective
Are two heads better than One
2007 Phongpaibul and
Boehm
Students Random PP is effective Comparison
between Pair Development and software
development with Inspection
2007 Domino et al. Professional and
Students
Random pp not effective To study the
impact of pp on programming performance and user satisfaction
2007 Mu ller Students Random PP is partially
effective
Comparison of programmer defects caused by programmer pairs and solo
developers
2007 Canfora et al. Engineers &
Scientist
Similar skill and experience
PP is partially effective
Evaluating performances of pair designing in industry
2008 Bipp Students Random PP is effective Benefits of Pair
Table 2(b)
Year Name Study Setting Conclusion
1998 Nosek 45 min to solve 1 programming task
(database consistency check script)
The results show that pair programming is more productive and produce higher quality code than solo programmers.
2000 Williams 6-week course where the students had to
deliver 4 programming assignments
The results shows that pair programming is more productive and produce higher quality code than solo students
2001 Nawrocki and
Wojciechowski
lab sessions over a winter semester, as part of a University course. Wrote four C/C++ programs ranging from 150–400 LOC
The result shows that pair programming is unproductive as compared to solo students.
2002 Baheti et al. Teams had 5 weeks to complete a
curricular OO programming project. Distinct projects per team
It is feasible to develop software using distributed pair programming and the resulting software is comparable to software developed in collocated or virtual
teams(without pair programming in terms of productivity and quality
2002 Rostaher & Hericko small user stories filling 1 day The comparison of the control
group of individuals and the group programming in pairs showed that both groups spent almost the same amount of time to complete the tasks.
2003 Heiberg et al. 4 sessions over 4 weeks involving 2
programming tasks to implement a component for a larger ‘‘gamer” system
pp effective in early tesTable programming as compared to solo programmers. But the final result was same of pair programmers and non pair programmers.
2005 Canfora et al. applications each with 2 tasks (run1 and run2)
pp decreases the effort of the single programmer
2006 Phongpaibul and
Boehm
12 weeks to complete 4 phases of development + inspection
The classroom experiment the average development effort of the pair development group was 24% less than inspection group with improved productive quality. Industry experience showed bit more efforts but about 40% fewer major defects.
2006 Madeyski 8 laboratory sessions involving 1 initial
programming task in a finance accounting system (27 user stories)
Using test driven development instead of classic testing approach had statistically significant positive impact on some class level software quality indicators (CBO and RFC metrics) in case of solo programmers as well as pairs. Combined results suggest that positive impact on software quality may be limited to class level.
2006 Lui and Chan 8 group of three similar capability
members worked for 4 rounds till the assignment is over
The result shows that pair programming effectively help developers unfamiliar programming problems
2006 Matthias The experiment had an inter-subject design
and was held at the university of Karlsruhe during the summer lectures 2004. The study of extreme programming. The course
was composed of four sessions(introducing pair programming, test first, refactoring and the planning game) and a whole week of project work
similar level of correctness is concerned
2007 Arisholm et al. 10 sessions with individuals over 3 months and 17 sessions with pairs over 5 months (each of1 day duration, with different subjects). Modified 2 systems of about 200-300 Java LOC each
the best answer is "it depends" - on both the programmer's expertise and the complexity of the system and tasks to be solved. Two heads are better than one for achieving correctness on highly complex programming tasks
2007 Phongpaibul and
Boehm
Part of a team project to extend a system. 13 weeks to complete 4 phases of development + inspection
In the classroom experiment the pair development group had less average development effort than inspection group with the same or higher level of quality. Industry experience showed bit more efforts but about 40% fewer major defects.
2007 Domino et al. Run as several sessions during a period of
two months. Pseudo code on ‘‘Create-Design” tasks Test-driven development
Better performance and satisfaction outcomes are achieved when the pp is performed in face to face versus virtual settings, in combination with the test driven approach and with more experienced programmers.
Limiting the extent of collaboration can be effective when
programmers are more experienced.
2007 Matthias 42 programs to be developed in extreme
programming lab course
Pair programmers make as many algorithmic mistakes but fewer expression mistakes than solo programmers
2007 Gerardo et al. The experiment took place in one of the
rooms of the company that was equipped for pair work. Two assignments were randomly distributed to the individuals or to pairs in the two different rounds and the experimenters were present in the room to control the execution of the experiment
Pair programming slows down the task, yet improves quality. Pair programming applied to design phase appears less efficient when applied to coding phase
2008 Bipp The study was carried out in courses for
software development at the university of Dortmund, Germany. Thirteen software development teams with about 100 students took part in the experiments. There were two set of groups with different working conditions. One group was of paired and the second group was of individuals
Methods and Materials
H0: that there exist significant differences in different pairs of intellectual levels as far as program clarity, presentation; confidence level and satisfaction level are concerned.
H1: that there exist significant differences in different pairs of intellectual levels.
H2: that there exists significant differences in pair and solo corresponding to three intellectual levels Intelligent, Average and Poor for the four parameters i.e. numbers of lines checked, tested methods, executed cases and execuTable lines.
To test the developers on personality, data has been collected on parameters like program clarity, presentation; confidence level and satisfaction level 20 pairs for each category has been taken and to see the impact of pairs on personality and quality of a program. Data has been collected for parameters number of lines checked, tested methods, executed cases and execuTable lines as parameters. For these parameters data has been collected from 40 programs corresponding to solo intelligent, solo average, solo poor and compared it with pair of II, AA and PP by using a technique of pair-t-test to test the hypothesis.
Technique used is non-parametric chi-square test for testing the significance differences in populations with k independent samples. In chi-square test all possible six paired combinations and three solos i.e. solo intelligent, solo average and solo poor constituted nine populations to be compared for intellectual levels.
The ranks for testing Program clarity, Presentation, Confidence level and Satisfaction level are as follows – Program Clarity- 1 Not Clear, 2 Clear, 3 Very Clear, 4 Excellent.
Presentation – 1 Poor, 2 Good, 3 Very Good, 4 Excellent Confidence Level – 1 Very Low, 2 Low, 3 High, 4 Very High
4. Satisfaction Level – 1 Not Satisfied, 2 Partial satisfaction, 3 Full Satisfaction.
For testing intelligence “A TEST OF INTELLIGENCE FOR SPECIAL STUDIES” by Dr. S.S. JALOTA is referred. G-STAT is used for analysis. For testing programs Jtest 7.5 version is used.
Analysis Tables
Table 3
PARAMETERS CHI-SQUARE VALUES
Program Clarity 198.569**
Presentation 199.555**
Confidence Level
172.216**
Satisfaction Level
175.285**
Table – 4(a) Program clarity
Table – 4(b)
non ns significant differences
* Significant difference at 5% level of significance (p<0.05) ** Significant difference at 1% level of significance (p<0.01)
II IA IP AA AP PP
II - 0.48 ns 1.667ns 16.596** 21.818** 60.00**
IA 0.48ns - .373ns 3.774ns 7.177** 40.00**
IP 1.67 ns 0.37 ns - 1.832ns 4.44* 34.737
AA 16.60** 3.77 ns 1.83ns - 0.601ns 23.721**
AP 21.82** 7.18** 4.44* 0.60ns - 18.261**
PP 60.00** 40.00** 34.74** 23.72** 18.26** -
I 0.00 ns 0.10 ns 0.09ns 16.60** 21.82** 60.00**
A 23.72** 8.53** 3.59ns 1.07ns 0.07ns 16.60**
P 60.00** 40.00** 34.74** 23.72** 18.26** 0.00 ns
I A P
II 23.00ns 23.721** 60.00**
IA .098ns 8.531** 40.0**
IP 0.089ns 3.587ns 34.737**
AA 16.596** 1.067ns 23.721**
AP 21.818** 0.067ns 18.26**
PP 60.00** 16.596** 0.00ns
I - 23.721** 60.00**
A 23.72** - 16.596**
Table 5(a) Presentation
Table 5 (b)
ns non significant differences
*Significant difference at 5% level of significance (p<0.05) ** Significant difference at 1% level of significance (p<0.01)
II IA IP AA AP PP
II - .48 ns 1.67ns 1.92ns 4.32* 60.00**
IA 0.48 ns - 0.373ns 0.098ns 1.364ns 13.303**
IP 1.67 ns 0.37 ns - 0.089ns 0.158ns 9.64**
AA 1.92 ns 0.10 ns 0.09ns - 0.74ns 11.38**
AP 4.32* 1.36 ns 0.16ns 0.74ns - 6.67**
PP 60.00** 13.30** 9.64** 11.38** 6.67** -
I 0.00 0.10 ns 2.78ns 0.00ns 12.0ns 30.0**
A 12.0** 1.36 ns 0.32ns 0.74ns 0.00ns 6.67**
P 27.81** 11.59** 8.15** 9.77** 5.40* 0.07 ns
I A P
II 0.00ns 12.0** 27.81**
IA 0.098ns 1.36ns 11.59**
IP 2.783ns 0.317ns 8.15**
AA 0.00ns .739ns 9.77**
AP 12.0** 0.00ns 5.40*
PP 30.0** 6.67** 0.073ns
I - 12.00** 27.81**
A 12.00** - 5.41*
Table–6(a) Confidence level
Table 6(b)
I A P
II 0.0ns 20.0** 45.89**
IA 12.00** 1.714ns 17.78**
IP 18.26** 0.067ns 10.8**
AA 25.71** 0.61ns 5.46*
AP 30.00** 1.714ns 3.354ns
PP 37.30** 4.59* 1.002ns
I - 20.00** 45.88**
A 20.00** - 9.32**
P 45.88** 9.32** -
ns non significant differences
* Significant difference at 5% level of significance (p<0.05) ** Significant difference at 1% level of significance (p<0.01)
II IA IP AA AP PP
II - 12.00** 18.261** 25.74** 30.00** 37.30**
IA 12.00** - 1.11ns 4.29* 6.67** 10.75**
IP 18.26** 1.11 ns - 1.071ns 2.44ns 5.71*
AA 25.71** 4.29* 1.071ns - 0.287ns 1.93 ns
AP 30.00** 6.67** 2.44ns 0.29ns - 0.74 ns
PP 37.3** 10.75** 5.71* 1.93ns 0.74ns -
I 0.00 ns 12.00** 18.26** 25.71** 30.00** 37.30**
A 20.00** 1.71 ns 0.07ns 0.61ns 1.71ns 4.59*
Table –7(a) Satisfaction level
II IA IP AA AP PP
II - 0.48 ns 1.67ns 6.49* 14.07** 17.78**
IA 0.48 ns - 0.37ns 3.77ns 10.00** 13.303**
IP 1.67 ns 0.37 ns - 1.83ns 6.79** 9.64**
AA 6.49* 3.77 ns 1.83`ns - 1.67ns 3.30*
AP 14.07** 10.00** 6.79** 1.67ns - 0.29 ns
PP 17.78** 13.30** 9.64** 3.30* 0.29ns -
I 0.20 ns 0.12 ns 0.08ns 1.15ns 5.46* 8.08**
A 15.86** 11.59** 8.15** 2.41ns 0.07ns 0.07 ns
P 19.82** 15.15** 11.28** 4.34* 0.66ns 0.08 ns
Table 7(b)
ns non significant differences
* Significant difference at 5% level of significance (p<0.05) ** Significant difference at 1% level of significance (p<0.01)
I A P
II 0.202ns 15.864** 19.82**
IA 0.12ns 11.59** 15.15**
IP 0.082ns 8.15** 11.28**
AA 1.15ns 2.41ns 4.34*
AP 5.46* 0.071ns 0.66ns
PP 8.08** 0.073ns 0.077ns
I - 6.97** 9.6**
A 6.97** - 0.30ns
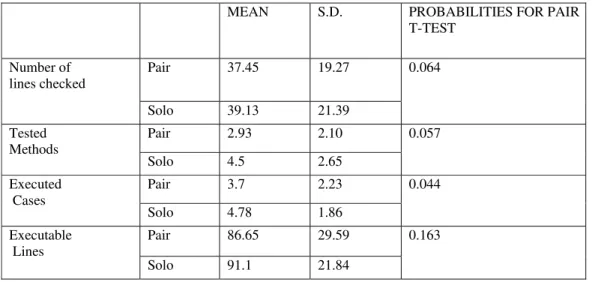
Table 8 Analyses of intelligent students
Table 9 Analyses of average students
Table 10 Analyses of poor students
MEAN S.D. PROBABILITIES FOR PAIR
T-TEST
Number of lines checked
Pair 37.45 19.27 0.064
Solo 39.13 21.39
Tested Methods
Pair 2.93 2.10 0.057
Solo 4.5 2.65
Executed Cases
Pair 3.7 2.23 0.044
Solo 4.78 1.86
Executable Lines
Pair 86.65 29.59 0.163
Solo 91.1 21.84
MEAN S.D. PROBABILITIES
FOR PAIR T -TEST
No. of lines checked Pair 34.6 11.98 0.052
Solo 35.98 12.73
Tested Methods Pair 1.77 1.61 0.016
Solo 3.33 1.45
Executed Cases Pair 2.81 2.52 0.078
solo 4.0 3.42
Executable lines Pair 79.43 10.03 0.067
solo 78.60 8.84
MEAN S.D. PROBABILITIES
FOR PAIR T-TEST Number of
lines checked
Pair 48.78 7.64 0.027
Solo 35.98 8.68 Tested
Methods
Pair 1.45 1.26 0.01
Solo 2.24 1.36
Executed Cases
Pair 1.53 1.45 0.0115
Solo 2.79 2.39
Executable lines
Pair 16.1 17.04 0.151
Results and Discussions
Table 1&2The sample of 27 is taken to study the effectiveness of pairs. Findings are that the experiments are done mainly on students and less on professionals. For persona various tools are used like MBTI, 9 point scale from Code-Warrior to Code-a-phobe, FSLS, KTS are used. The pairing techniques that are used are random, distributed and collocated, skill and experience and pretest performance. To study the effectiveness it is divided into three categories: Effective, Not effective and Partial effective. 46.67% feels pairing is effective, 20% feels pairing is not effective and 33.33% feels pairing is partially effective.
Table 3 There exists highly significant differences (p<0.01) in different combinations of intellectual levels as far as all four parameters are concerned. After establishment of differences in a population of intellectual levels, pair wise comparisons of intellectual levels were carried out among the four parameters i.e. program clarity, presentation, confidence level and satisfaction level using technique of non-parametric chi-square test to test the hypothesis.
Table 4 a&b While comparing program clarity of students of different intellectual levels it is observed that paring of intelligent students with either II or with IA or with IP students bring significant differences in program clarity as compared to pair of AP, pair of PP and solo P. Program clarity of II and IA differ highly significantly from that of solo A but not of IP. Paring of average students with either AA or with AP student brings highly significant differences in program clarity corresponding to pair of II, pair of PP, solo I and solo P students. Paring of PP brings significant differences in program clarity from intellectual levels except the solo poor and similarly program clarity of solo poor is at par with pair of PP.
Table 5a&b While comparing presentation of different intellectual levels it has been observed that pair of II, IA, IP, AA, AP differs significantly from presentation of pair of PP and solo P is at par with each other but it differs significantly from the presentation of all other intellectual levels.
TABLE 6a&b It is observed that confidence level of solo intelligent and pair of intelligent students (II) is at par with each other but there confidence level differs significantly from all other intellectual levels. Confidence level of pairing of intelligent with either IA or with IP and that of solo A brings significant differences between pair of II, PP and solo I and solo P. Confidence level of IA also differs significantly from confidence level of AA and AP. Confidence level of pairing of Average with either AA or with AP brings significant differences from confidence level of II, IA, and solo I. Confidence level of AA also differs from solo P. Confidence level of solo P and pairing of PP are at par with each other but differs significantly from confidence level of II, IA, IP and solo I and solo P in addition. Solo P differs significantly from AA also.
Table 7a&b Its observed that satisfaction level of solo and pairing of I with either II or with IA or with IP brings highly significant differences from satisfaction level of pairs of AP, PP, solo A and solo P. Satisfaction level of AA differs significantly from that of II, PP and solo P. While comparing satisfaction level of solo A and its pairing with poor i.e. pair AP differs significantly from satisfaction level of II, IA, IP and solo I. Satisfaction level of solo P and its pairing with PP are at par with each other but differs significantly from II, IA, IP, AA and solo I.
Table 8 According to observation that there is no significant effect of pairing on executable lines of the programmes but pairing is effective in executed cases at 4.4% level of significance, in number of lines checked at 6.4% level of significance and for tested methods at 5.8% level of significance.
Table 9 While comparing performance of solo poor student from pair of poor results depicts that tested methods differs significantly at 1.6% level of significance, number of lines checked at 5.2% level of significance, executed lines at 6.7% level of significance and executed test cases at 7.8% level of significance.
Table 10 In pairing of poor students in comparison to solo average student number of lines checked differ significantly at 2.7% level of significance, tested methods at 1% level of significance, executed test cases at 1.2% level of significance and executable lines at 1.5% level of significance.
CONCLUSION
1. Pairing of I, A, P with themselves has no significant differences with solo I, A, P but if we have pairs in combination then significant differences were seen.
2. Pair of IA differs significantly as compared to solo A, pair of AA also differs significantly from solo A and solo P, pair of AP significantly differs from solo P but not from solo A, but pair PP is at par with solo P.
3. Pair of IA and IP differs significantly from solo P but it is at par with solo I and solo A, whereas pair AA differs significantly from solo P, pair AP differs significantly from solo I and solo P and pair PP differs significantly from solo I and solo A.
5. To improve the quality of a program, pair programming is more effective in poor students in comparison to average students and more effective in comparison to intelligent students.
APPENDIX
Assignment given to solo and pair students
1. Write a Program using abstract class and multiple inheritances. 2. Write a Program using event handling.
3. Write a Program based on applet concepts. 4. Write a Program using call by reference. 5. Write a Program using call by value. 6. Write a Program using constants.
7. Write a Program using exception handling. 8. Write a Program using finally.
9. Write a Program using font in an applet. 10. Write a Program using interfaces
11. Write a Program using interface and extends 12. Write a Program using mouse action applet. 13. Write a Program using mouse event applet.
14. Write a Program using multiple catch in exception handling. 15. Write a Program using multiple try in exception handling. 16. Write a Program using nested class in java
17. Write a Program using single inheritance. 18. Write a Program using static keyword. 19. Write a Program using super keyword.
20. Write a Program using super keyword in single inheritance. 21. Write a Program using this keyword in java.
22. Write a Program using thread and applet. 23. Write a Program using simple thread. 24. Write a Program based on priority of threads. 25. Write a Program using run state of thread. 26. Write a Program using user defined exception. 27. Write a Program using simple abstract class. 28. Write a Program using access specifications. 29. Write a Program using action event applet. 30. Write a Program using overloading.
31. Write a Program using exception with function. 32. Write a Program using final.
33. Write a Program using graphics in applet. 34. Write a Program using method overriding. 35. Write a Program using method overloading. 36. Write a Program using new operator. 37. Write a Program using thread as method. 38. Write a Program using all the states of thread. 39. Write a Program using multiple threads. 40. Write a program using controls.
REFERENCES
[1] Arisholm, E.; Gallis, H.; Dybå, T.; Sjøberg.; D.I.K.. (2007): Evaluating pair programming with respect to system complexity and programmer expertise, IEEE Trans. Software Eng., 33, 65–86.
[2] Baheti, P.; Gehringer, E.;Stotts, D. (2002): Exploring the efficacy of distributed pair programming, Proc. XP/Agile Universe 2002, ser. Lecture Notes in Computer Science, vol. 2418, Springer Verlag, pp. 208–220.
[3] Bipp, T.; Leeper, A..; Schmedding, D. (2008): Pair Programming In Software Development Teams – An Empirical Study Of Its Benefits, Information and Software Technology, 50, pp. 231-240.
[4] Canfora, G.; Cimitlie, A.; Visaggio, C.A.; Garcia, F.; Piattini, M. (2007): Evaluating Performances Of Pair Designing In Industry, The Journal of Systems and Software, 80, pp. 1317-1327.
[5] Canfora, G.;Cimitlie, A.; Visaggio, C.A. (2005): Empirical study on the productivity of the pair programming, in: Proc. XP 2005, ser. Lecture Notes in Computer Science, vol. 3556, Springer Verlag, pp. 92–99.
[6] Chao, J.; Atli, G. (2006): Critical Personality Traits in Successful Pair Programming, Proc. Agile ’06 Conf.
[8] Dick, A.J.; Zarnett, B.(2002): Paired Programming & Personality Traits, Proc. Third Int’l Conf. Extreme Programming and Agile Processes in Software Eng., pp. 82-85.
[9] Domino, M.A.; Webb Collins, R.; Hevner A.R. (2007): Controlled experimentation on adaptations of pair programming, Information Technology and Management 8(4) 297–312.
[10] Hanks, B. (2006): Student Attitudes toward Pair Programming, Proc. 11th Ann. Conf. Innovation and Technology in Computer Science.
[11] Hannay, Jo E.; Arisholm, Erik.; Engvik, Harald.; Sjøberg, Dag I.K.(2010): Effects of Personality on Pair Programming, IEEE TRANSACTIONS On Software Engineering VOL. 36, NO. 1, JAN/FEB, pp 61-80.
[12] Heiberg, S.; Puus, U.; Salumaa, P.; Seeba, A. (2003):Pair programming effect on developers productivity, Proc. XP 2003, ser. Lecture Notes in Computer Science, vol. 2675, Springer Verlag, pp. 215–224.
[13] Katira, N.; Williams, L.; Wiebe, E.; Miller, C.; Balik, S.; Gehringer, E.(2004): On Understanding Compatibility of Student Pair Programmers, Proc. 35th Technical Symp. Computer Science Education, pp. 7-11.
[14] Layman, L. (2006): Changing Students’ Perceptions: An Analysis of the Supplementary Benefits of Collaborative Software Development, Proc. 19th Conf. Software Eng. Education and Training.
[15] Lui, K.M.;Chan, K.C.C. (2006): Pair Programming Productivity: Novice–Novice Vs. Expert–Expert, International Journal of Human-Computer Studies, 64, pp. 915–925.
[16] Madeyski, L. (2007):On the effects of pair programming on thoroughness and fault-finding effectiveness of unit tests, Proc. PROFES, ser. Lecture Notes in Computer Science, vol. 4589. Springer Verlag, pp. 207–221.
[17] Madeyski, L.(2006): The impact of pair programming and test-driven development on package dependencies in object-oriented design – an experiment, Proc. PROFES, ser. Lecture Notes in Computer Science, vol. 4034, Springer Verlag, pp. 278–289.
[18] Mu¨ller, M. M. (2006): A Preliminary Study on The Impact Of A Pair Design Phase On Pair Programming And Solo Programming, Information and Software Technology, 48, pp. 335–344.
[19] Mu¨ller, M. M. (2007): Do Programmer Pairs Make Different Mistakes than Solo Programmers, The Journal of Systems and Software, 80, pp. 1460–1471.
[20] Nawrocki, J.; Wojciechowski, J.A. (2001):Experimental evaluation of pair programming, Proc. European Software Control and Metrics Conference, pp. 269–276.
[21] Nosek, (1998), “The case for collaborative programming”, Comm. ACM 41(3) 105–108 (Mar.).
[22] Phongpaibul, M.;Boehm, B. (2006): An empirical comparison between pair development and software inspection in Thailand, Proc. Int’l Symposium on Empirical Software Engineering (ISESE’06), pp. 85–94.
[23] Phongpaibul, M.; Boehm, B.;(2007):A replicate empirical comparison between pair development and software development with inspection, in: Proc. 1st Int’l Symp. Empirical Software Engineering and Measurement (ESEM’07), IEEE Computer Society, pp. 265–274. [23] Rostaher, M.; Hericko, M. (2002): Tracking test first pair programming – an experiment, Proc. XP/Agile Universe 2002, ser. Lecture Notes in Computer Science, vol. 2418. Springer Verlag, pp. 174–184.
[24] Sfetsos, P.; Stamelos, I.; Angelis, L.; Deligiannis, I. (2006):Investigating the Impact of Personality Types on Communication and Collaboration-Viability in Pair Programming—An Empirical Study,” Proc. Seventh Int’l Conf. Extreme Programming and Agile Processes in Software Eng., pp. 43-52.
[25]Thomas, L.; Ratcliffe, M.; Robertson, A.,(2003): Code Warriors and Code-a-Phobes: A Study in Attitude and Pair Programming, Proc. 34th Technical Symp. Computer Science Education.
[26] Williams, L.; Kessler, R.R.; Cunningham, W.; Jeffries, R.(2000):Strengthening the case for pair programming, IEEE Software, 17(4) (2000) 19–25.
[27] Williams, L.; Layman, L.;Osborne,J.; Katira, N. (2006) :Examining the Compatibility of Student Pair Programmers, Proc. Agile ’06 Conf.