AHMED YOUSSEF ABDELNABI MOHAMED ELSAYED
INHERITANCE OF RESISTANCE TO TOMATO LATE BLIGHT IN A POPULATION OF Solanum lycopersicum X Solanum habrochaites
VIÇOSA
MINAS GERAIS-BRASIL 2010
A thesis submitted to Universidade Federal de Viçosa in partial fulfillment of the requirements for the degree of Doctor
Ficha catalográfica preparada pela Seção de Catalogação e Classificação da Biblioteca Central da UFV
T
Elsayed, Ahmed Youssef Abdelnabi Mohamed, 1977- E49i Inheritance of resistence to tomato late blight in a 2010 population of Solanum lycopersícum x
Solanum harbochaites / Ahmed Youssef Abdelnabi Mohamed Elsayed. – Viçosa, MG, 2010.
xiv, 88f. : il. (algumas col.) ; 29cm.
Orientador: Derly José Henriques da Silva.
Tese (doutorado) - Universidade Federal de Viçosa. Referências bibliográficas: f. 71-88.
1. Tomate - Melhoramento genético. 2. Tomate - Resistência a doenças e pragas. 3. Phytophthra infestans. I. Universidade Federal de Viçosa. II.Título.
AHMED YOUSSEF ABDELNABI MOHAMED ELSAYED
INHERITANCE OF RESISTANCE TO TOMATO LATE BLIGHT IN A POPULATION OF Solanum lycopersicum X Solanum habrochaites
Examination Date: March 17, 2010
Prof. Eduardo Seiti Gomide Mizubuti (Co-Advisor)
Prof. Pedro Crescêncio Souza Carneiro (Co- Advisor)
Dra. Eveline Teixeira Caixeta Prof. Everaldo Gonçalves de Barros
Prof. Derly José Henriques da Silva (Advisor)
A thesis submitted to Universidade Federal de Viçosa in partial fulfillment of the requirements for the degree of ‘Doctor
ii
To …..
My Family,
Parents
iii
ACKNOWLEDGEMENT
First of all, to God who enabled me to realize and finish my study until this moment. To University Federal of Viçosa and Postgraduate program in Genetics and Breeding for this opportunity. I also wish to acknowledge to The National Council for Scientific and Technological Development (CNPq), Brazil and The Academy of Science for the Developing World (TWAS), Italy for the fellowship during the period of course and I greatly appreciate your confidence and financial support for opportunity to study in Brazil and attain scientific and cultural benefits.
I would like to express my deepest thanks, gratitude and appreciations to Prof., Advisor and Friend Derly José Henriques da Silva, for his great manners, suggesting the point of research, supervision, continuous encouragement, helpful advice during the course.
My gratitude and appreciation to Prof. Eduardo Seiti Gomide Mizubuti for his supervision, guidance, great interest, encouragement, and beneficial criticism throughout this work.
My deepest and sincere grateful to Prof. Pedro Crescêncio Souza Carneiro for his supervision and great help during carrying out and preparing this work.
I wish to thank Prof. Everaldo Gonçalves de Barros and Dra. Eveline Teixeira Caixeta for their advices and suggestions. Furthermore, Prof. Randy Gardner, North Carolina State University, USA, for his co-operation and his fast response to providing part of the resistant tomato materials.,
iv
The secretary of Postgraduate Program in Genetics and Breeding; Rose, Rita and Edna and also, all the secretary staff of DFT for official aid, friendship, reliability, efficiency.
For my friends Sebastião and his wife Maura and their family for the hospitality and friendship during 4 years of my stay here in Viçosa.
v
BIOGRAPHY
I was born in Dakahlia (Egypt) on the 09th of October, 1977. In July 1995, concluded second grade at Ali Mobarak School. After that, joined course in Agronomy, Faculty of Agriculture, Mansoura University, Egypt from September, 1995 to June, 1999 graduated in Horticultural Science with ranked general grade very good.
In July, 2000 I got my first government employment as Agricultural Specialist in Horticulture Research institute, Agriculture Research Center, Giza, Egypt. After I got my position I intended to start my postgraduate study and registered to Master degree under supervision of Professor Kauthar Sad Kash, Department of Genetics, Mansoura Uni. concluded in January, 2004.
vi
TABLE OF CONTENTS
Page
RESUMO... x
ABSTRACT... xii
1. INTRODUCTION... 01
2. LITERATURE REVIEW………... 05
2.1 Tomato production in Brazil ……….. 05
2.2 Tomato Late Blight………. 06
2.2.1 Taxonomy and morphology of pathogen……… 07
2.2.2 Symptoms and signs……….... 07
2.2.3 Primary inoculum……… 08
2.2.4 Reproduction………... 09
2.3 Disease management………... 10
2.4 Breeding for late blight resistance in tomato………. 11
2.5 Heterosis (Over dominance)……….. 13
2.6 Diallel analysis ……….. 16
2. MATERIALS AND METHODS... 19
2.1 Experimental location………. 19
2.2 Plant Materials……… 19
2.2.1 Genetic source of Ph-2 and Ph-3 resistant genes ………... 20
2.3 Mating design……….. 21
2.4 Field design……… 21
2.5 Pathogen isolates………. 22
2.5.1 Preparation of Inoculum ………. 23
2.5.2 Quantify the Resistance……….. 23
2.5.3 Data collection. ………... 24
2.5.3.1 Disease rating... 25
vii
2.7 Statistical analysis……….. 27
2.7.1 Analysis of variance ………... 27
2.7.1.1 Dunnett’s test……… 28
2.7.1.2 Cluster analysis……… 28
2.7.2 Diallel analysis ………... 29
3. RESULTS AND DISCUSSIONS... 32
3.1 The inheritance analysis of resistance to late blight ……….. 32
3.1.1The analysis of variance for Y50, Ymax and AUDPC……… 35
3.1.2 Pearson’s correlations between disease variables ……….. 44
3.2 Evaluation of resistance in F2 population………... 44
3.2.1 Genetic analysis of resistance in F2 population ……….. 45
3.3 Half diallel analysis of inheritance to resistance………. 49
3.3.1 Combining ability analysis of late blight resistance……….. 50
3.3.1.1 The GCA effects (gi)………. 50
3.3.1.2 The SCA effects (Sij)………... 51
3.3.2 Combining ability analysis of fruit quality traits………... 59
3.3.2.1 GCA effects (gi)………... 60
3.3.2.2 SCA effects (Sij)………. 61
4. CONCLUSIONS……… 68
viii
RESUMO
ELSAYED, Ahmed Youssef Abdelnabi Mohamed, DSc. Universidade Federal de Viçosa, março de 2010. A herança da resistência a requeima do tomateiro na população S. lycopersicum x S. habrochaites. Orientador: Derly José Henriques da Silva. Co-Orientadores: Eduardo Seiti Gomide Mizubuti e Pedro Crescêncio Souza Carneiro.
A requeima causada por Phytophthora infestans (Mont.) De Bary, é uma séria doença que afeta a produção de tomateiros especialmente em regiões tropicais e subtropicais. No Brasil, cerca de 20% do custo da produção de tomate é devido ao controle químico da requeima. A ausência de cultivares resistentes a requeima é devido à dificuldade de trabalhar com este patógeno em programas de melhoramento, pois as raças do patógeno possuem alta variabilidade e a resistência a este é associada com uma herança quantitativa. No desenvolvimento de cultivares competitivas o estudo da capacidade de combinação é extremamente importante para auxiliar o melhorista na escolha dos pais e combinações híbridas superiores. Este trabalho teve como objetivo estudar herança a resistência na população F2 e estimar a capacidade geral (CGC) e específica (CEC) de combinação para resistência à requeima e qualidade de frutos de tomate. Foi realizado dialelo parcial obtendo vinte e cinco combinações híbridas, provenientes de cruzamentos entre variedades de tomate e cinco linhagens F9 como fontes de genes de resistência a requeima. As combinações híbridas foram avaliados para resistência à requeima e qualidade de frutos em dois experimentos simultâneos, no delineamento em blocos casualizados com três repetições e 3 plantas por parcela. Os parentais e os cruzamentos F1, mais duas variedades industriais ‘Nova York' e 'Caline’ como padrões de susceptibilidade contendo o gene de resistência ph-1 foram artificialmente inoculadas em condições de campo com mistura de isolados de Phytopthora
infestans a uma concentração de 103 esporângios/mL. Severidade da doença foi
ix
x
ABSTRACT
ELSAYED, Ahmed Youssef Abdelnabi Mohamed, DSc. Universidade Federal de Viçosa, March, 2010. Inheritance of resistance to tomato late blight in a population of Solanum lycopersicum x Solanum habrochaites. Advisor: Derly José Henriques da Silva. Co-Adivsors: Eduardo Seiti Gomide Mizubuti and Pedro Crescêncio Souza Carneiro.
xi
xii
1
1. INTRODUCTION
Tomato (Solanum lycopersicum) is one of the most important vegetables in the world including Brazil. It is a rich source of lycopene, beta-carotene, folate,
potassium, vitamin C, flavonoids, and vitamin E (Willcox et al., 2003; Bose and
Agrawal, 2007). Worldwide production of fresh market and processing tomatoes has
steadily increased during the last decade and reached an annual production of 124.4
million tons in 2004, with an average yield of 27.5 ton/hectare ( FAOSTAT 2004)
and world fresh tomato trade grew 45% over the last 5 years (USDA-FAS 2009).
The tomato growing area has increased by 38% and production by 42% worldwide
in the past 10 years. Most of the increase came from China, where the growing area
nearly tripled from 0.47 million ha in 1995 to 1.26 million ha in 2004, and
production more than doubled from13.2 million ton to 30.1 million ton. More than
half of the total tomato production was from the six top producing countries: China,
USA, Turkey, India, Egypt, and Italy (USDA-FAS 2007).
Tomato cultivars suffer from as many as 200 diseases worldwide of which 30
are routinely important (Watlerson, 1986). Out of these diseases, late blight, caused
by the oomycete Phytophthora infestans Mont. De Bary, is a destructive disease of tomatoes, and approximately 15-20 % of fresh tomato production costs in Brazil are
2
and control measures are estimated to exceed $5 billion annually. P. infestans is thus regarded as a threat to global food security (Duncan, 1999). A 80-90% of tomato
production may be damaged by this disease if control measures are not applied on
the time (Zahid et al., 1993).
Cultural and physical methods of control are of limited efficiency and have
serious operational implementation constraints as high costs and labor demands. The
control of late blight heavily relies on the frequent application of protecting
fungicides, which are applied every 5-14 days (Wang, 2003). This is expensive and
undesirable for the ecosystem and lead to emergence of resistant isolates with
increased fitness and aggressiveness (Ko, 1994). Late blight control is increasingly
difficult due to changes in P. infestans pathogenicity, the introduction of new pathogen isolates, and increased resistance of the pathogen to fungicides (Kato et al.,
1997). For healthy tomato cultivation, using resistant cultivars is a desirable
alternative to chemical control. The development of crops that possess durable
genetic resistance provides the best prospect for efficient, economical and
environmentally safe control of late blight (Bonnet et al., 2007).
Attempts to breed late blight resistant tomato lines started since 64 years ago
(Richards and Barratt, 1946) ultimately resulting in the identification of three
dominant genes: Ph-1 on chromosome 7 (Clayberg et al., 1965; Peirce, 1971), Ph-2 on chromosome 10 (Moreau et al., 1998) and Ph-3 on chromosome 9 (Chunwongse et al., 1998). Tomato varieties carrying the resistance genes Ph-1 or Ph-2 provide inadequate control against the local population of the pathogen (Cohen, 2002).
Whereas, Ph-3 is a strong resistance gene and has been incorporated into many breeding lines of fresh market and processing tomato. However, new P. infestans
isolates have been identified which overcome Ph-3 resistance (Chunwongse et al., 2002).
Race-specific and polygenic resistance have been characterized and exploited
in breeding, providing an efficient control of disease severity (Thabuis et al., 2004).
3
virulence, has made race-specific resistance genes almost useless in disease control
(Andrivon, 1994). With the lack of durability of resistance with single dominant
genes that result in hypersensitive resistance (HR), it is probable that new resistance
genes that result in HR will not be durable. More emphasis is being given to transfer
of quantitative trait resistance to commercial cultivars of tomato.
Wild S. pimpinellifolium is the original source of the race-specific resistance genes Ph-1, Ph-2 and Ph-3 (Gallegly, 1960; Ignatova et al., 1999). Resistance to late blight has also been observed in wild S. habrochaites (Lobo and Navarro, 1987; Kim and Mutschler, 2000; Abreu, 2005). An interspecific F1 progeny from S. lycopersicum L. cv. Santa Clara x S. habrochaites f. glabratum accession BGH 6902 exhibited resistance to numerous P.infestans isolates under the field conditions of Viçosa, MG state (Abreu, 2005).
The choice of parents for use in a plant breeding program is one of the most
important decisions that a breeder makes (Borem and Miranda, 2005). In tomato, the
methodology presented by Griffing (1956) is quite used. This methodology which
estimates the general and specific combining abilities of the parents in a diallel cross
was developed for four types of diallel tables corresponding to four methods. The
most commonly used is method 2 which includes the n parents and the [n(n-1)/2]
crosses in the generation F1 without reciprocal crosses and the second in use is
method 4 which involves only the group of F1s without parents and reciprocal.
In a hybridization program, selection of parents on the basis of per se
performance alone is not a sound procedure since superior lines identified on the
basis of per se performance may result in poor recombinants in the segregating
generations. Therefore, parents should be chosen on the basis of their combining
ability. The general combining ability (GCA) characterizes the average performance
of a genotype in a series of hybrids combinations and is mainly associated with
additive gene action. While, the specific combining ability (SCA) is used to
characterize the performance of a specific hybrid combination in relation to the
4
dominance. Ramalho et al. (1993) mentioned GCA as a parameter of larger practical
importance for breeder since it gives information about the participation of additive
gene effects in the variation range of the segregating generations of a cross allowing
to trace the best strategies for the breeding program.
The main objectives of the current study were to study the inheritance of
resistance to late blight in two segregating populations, develop durable resistance to
late blight in tomato using different sources and levels of resistant genotypes;
estimation the components of genetic variation and general and specific combining
ability through half dialel analysis; combining both fruit quality and high level of
resistance within the resistant individual and recovering the quality factors through
5
2. Literature Review
2.1 Tomato production in Brazil
Brazil takes the eighth place in tomato production worldwide (USDA-FAS
2007). Although tomatoes can be grown in many regions of Brazil, and favorable
weather allows for production throughout the year in many areas, the main season
runs from June to September. Yields are highest in regions with milder winters and
low chance for frost while summer production poses greater risks for disease and
fruit set problems. The states with the largest tomato production are Goiás, São
Paulo and Minas Gerais.
According to Global Agricultural Information Network (GAIN) report in
2009, Brazilian tomato production declined significantly in 2009 dropping 9 percent
to 3.58 million metric tons (mmt) from 2008’s harvest of 3.94 mmt. Production is
expected to fall in terms of both area planted (from 62,100 to 59,100 hectares) and
average yield (from 63.35 to 60.65 kg/hectare). Area planted is expected to decline
over 20 percent in the state that is the major producer of tomatoes for industrial use.
Excessive heat and humidity in the major fresh tomato producing state has reduced
fresh tomato yields and led to a price spike.
Due to adverse weather conditions, the yields have declined in the major
6
fruit to be smaller and green and therefore not marketable. Besides creating quality
issues, the hot weather in February and March increased the incidence of
Tospovirus, reducing average yields in key São Paulo growing areas by as much as
14 percent. In March 2009 this drop in production caused the price of tomatoes to
double temporarily. The price of a kilo of tomatoes in the supermarket went from
R$2 to R$5.
According to industry contacts, tomatoes for fresh consumption accounted for
60% of total Brazilian tomato production. The percentage of production for
processing tomatoes is steadily increasing. Most of the country’s processing tomato
products are located in Goias creating a strong vertical production system in the
state. Modernization continues as late last year a new plant opened up that can
harvest, pack and ship in the same day.
Per capita tomato consumption is fairly low in Brazil, particularly for fresh
tomatoes. According to a São Paulo-based Agricultural Institute, Brazilian per capita
tomato consumption is 6.5 kilos per year, while per capita consumption in Norway,
Greece, Switzerland, and other countries exceeds 40 kilos per year.
2.2 Tomato Late Blight
Late blight is best known as a disease responsible for the Irish potato famine
during the 1840s. The disease essentially destroyed the potato crop in Ireland during
1845 and 1846, when over one million people died and 1.5 million Irish citizens
emigrated (Large 1940). In 2004, late blight was confirmed in at least 26 counties in
USA, which completely destroyed some commercial organic plantings and many
home garden tomatoes (Foolad et al., 2006). The disease occurs in a wide range of places where tomatoes are grown, being more severe in cold and humid periods. It is
favored by moderate temperatures, 12 - 20 °C and leaf wetness than 10 hours and
can occur in warm climates, where the nights are cold (Vale et al. 2000). At
7
remains alive and can cause damage as soon as weather conditions are favorable
(Lopes and Santos 1994).
The use of pathogen free seed tubers, application of fungicides, and
elimination of other pathogen harboring sources helped to reduce late blight effects
in the middle of the twentieth century (Fry and Goodwin 1997a). However,
devastating outbreaks of the disease during the 1980s and 1990s throughout the
world have led to renewed efforts to understand the pathogen nature and to develop
novel methods of late blight control (Fry and Goodwin 1997b).
2.2.1 Taxonomy and morphology of pathogen
The genus Phytophthora was first described by Anton de Bary in 1876, the name derived from the Greek; phyto = plant, pthora = destroyer. Phytophthora is a member of the kingdom Chromista, phylum Oomycota, order Peronsporales, family
Pythiaceae (Hawksworth et al., 1995). There are 60 described species within
Phytophthora, which affect many plant species (Erwin and Ribeiro, 1996). Although originally classified as a fungus, oomycetes have been re-classified in the kingdom
Chromista. Oomycetes are distinguishable from fungi based on metabolism (Pfyffer
et al., 1990), cell wall composition (Bartnicki-Garcia and Wang 1983), rRNA sequence (Cooke et al., 2000), and zoospore motility (Zentmyer, 1983). The mycelium characterized by the absence of cross walls, zoospores with heterokont
flagella (one whiplash, one tinsel) borne in sporangia, diploid nuclei in vegetative
cells, and sexual reproduction via antheridia and oogonia, Heterothalic (Zentmyer
1983).
2.2.2 Symptoms and signs
Late blight symptoms can develop on leaves, stems, green and ripe fruit. Leaf
symptoms begin as small, water-soaked spots, generally at the tips or edges of lower
8
favorable weather, gray to white mycelia growth may occur on the undersides of
foliar lesions. Foliage infected with late blight eventually turns brown, shrivels, and
dies (Agrios 2005). Symptoms on stems resemble leaf symptoms. Stem lesions are
typically dark patches or brown spots, leading to brittleness and plant death
(Blancard 1994).
Tomato fruit symptoms begin as dark, greasy spots on the fruit surface. These
spots may increase in size to cover the entire fruit. Under environmental conditions
conducive to late blight sporulation, white mycelium may be visible on fruit
(Stevenson, 1991). Lesions on tomato fruit may establish a ringed pattern. Late
blight fruit infection is often followed by soft rot leading to total fruit decay
(Watterson 1986). P. infestans fruit infection can penetrate the seed, oospores were detected inside the embryo resulting in infected tomato seedlings (Rubin et al., 2001).
2.2.3 Primary inoculum
The primary inoculum of tomato late blight is airborne sporangia from
infected plants left in fields or gardens, infected volunteer potato plants, and infected
transplants (Agrios, 2005). Since sporangia can be transported over large distances
by wind, the pathogen can move south to north in the spring if cool moist conditions
prevail. In regions where P. infestans reproduces sexually, oospores in the soil or on debris also serve as a source of primary inoculum. While soil-borne sporangia
remain viable for a maximum of 77 days, oospores have been shown to remain
viable for eight months even in extreme temperatures (Pittis and Shattock 1994).
The life cycle can be completed in 3–4 days and rapid inoculum build up
commonly occurs in fields during favorable conditions (average temperature
between 20 and 22 °C and high relative humidity or in rainy weather), which leads
to high progress rate epidemics but the high humidity play a major role in the
9
2.2.4 Reproduction
P. infestans has the ability to reproduce by both types of asexual and sexual reproduction. In the case of asexual reproduction, in cool moist weather, numerous
sporangiophores bearing sporangia may emerge within four days after infection
(Agrios, 2005). Sporangia are dispersed via wind or water splash. Each sporangium
contains between three and eight zoospores which are released upon bursting of the
sporangial wall (Agrios 2005). Upon coming to rest, and in the presence of cool
temperatures and adequate water, sporangia germinate by the production of
zoospores. Late blight lesions have been found to produce up to 30,000 sporangia
per day (Legard et al., 1995). Furthermore, foliar disease has been noted to increase
from 1 to 75 % in a period of two weeks under favorable environmental conditions
(Turkensteen 1973).
In the sexual reproduction, P. infestans is a heterothallic organism defined as the requirement of two different mating types A1 and A2 for sexual reproduction.
Individual genotypes of P. infestans produce both antheridia and oogonia and some genotypes are capable of self-fertilization in culture (Frinking et al. 1987). These
self-fertile types only produced oospores in vitro and did not produce oospores in
vivo. When growing in close proximity, each mating type (compatibility type)
produces a hormone which induces mycelia of the opposite mating type to form
antheridia and oogonia (Smart et al. 1998). Initial interaction between mating types
occurs between diploid mycelium. Upon recognition of the other mating type,
haploid antheridia and oogonia are formed (Smart et al., 1998). An antheridium can
fertilize an adjacent oogonium, yielding a diploid oospore (Agrios, 2005).
Germination of oospores occurs through a germ tube and results in the production of
a sporangium (Agrios 2005). The presence of both P. infestans mating types and the subsequent potential for sexual reproduction raises several concerns with respect to
disease variability and survivability. Sexual recombination provides the potential or
new, more adapted or aggressive isolates (Gavino et al., 2000). In Brazil to date, all
10
are of the A2 mating type (Reis et al., 2006) and A1 and A2 isolates were never
found in the same field (Reis et al., 2003).
2.3 Disease management
Commercial tomato varieties with effective general late blight resistance
against all extant strains are not available (Mizubuti, 2005). Primary use of disease
free transplants, preventative fungicide application along with appropriate cultural
practices, including sanitary field practices, crop rotation, and removal of diseased
material and weed hosts (Agrios, 2005; Stevenson, 1991) means are employed to
control late blight. Low levels of late blight are difficult to detect in the field and
may remain unnoticed until substantial damage occurs. Currently, most effective
fungicides labeled for use are protectants and must be applied prior to infection,
since they lack therapeutic activity (Fry and Goodwin 1997a).
Chemical control is complicated by the rapid development of late blight
epidemics in wet conditions. Since fungicides cannot be applied and spray residues
may wash off in rain, crops are often unprotected under ideal conditions for
pathogen reproduction, dispersal, and infection (Gallegly, 1960). In addition, strains
of late blight resistant to the fungicide metalaxyl have been developed (McLeod et
al., 2001; Mukalazi et al., 2001; Reis et al., 2003) and resistance to other fungicides
may emerge in the future. Due to these problems with chemical late blight control,
the development and utilization of late blight resistant cultivars is highly desirable.
In comparison with susceptible cultivars, resistant cultivars may require fewer
11
2.4 Breeding for late blight resistance in tomato
Breeding for resistance to P. infestans in tomato began more than 64 years ago (Richards and Barratt 1946). In the early 1950s, a screening of many cultivars led to
the discovery of a single dominant resistance gene, Ph-1, conferring resistance to late blight race T0 (Gallegly, 1952). Subsequent linkage tests indicated that Ph-1 is
located at chromosome 7 (Peirce, 1971). Ph-1 existed originally in two cultivars, ‘West Virginia 36’ and ‘West Virginia 106’, and was later integrated into ‘Geneva
11’, ‘Rockingham’, and ‘New Hampshire Surecrop’ (Walter, 1967). A new race of
P. infestans, T1, which overcame the resistance conferred by Ph-1 was observed shortly thereafter (Conover and Walter, 1953).
A second tomato resistance gene was found in a late blight resistant wild
relative, L. pimpinellifolium, accession ‘West Virginia 700’. This resistance was originally documented by Gallegly in 1960. However, at the time, the inheritance
was unknown (Gallegly, 1960). Consequently, partial resistance to P. infestans in line WVa 700 was redefined to be controlled by a single incompletely dominant
gene named Ph-2 (Laterrot 1975). Ph-2 maps to the long arm of chromosome 10 (Moreau et al., 1998).
Two types of resistance to late blight have been identified in tomato. The first
is specific or qualitative resistance this resistance shows a discontinue range of
variation in resistance, susceptible and resistant genotypes can be easily discerned.
It’s effect against specific races or biotypes of a pathogen (Thurston, 1971). It is
usually characterized by a hypersensitive response to late blight and frequently
confers immunity (Black, 1952).
According to Kuc´ et al. (1976), expression of specific resistance against P.
infestans is associated with rapid localized cell death in the resistant plant, browning of the affected area, and the accumulation of at least 16 terpenoids. Specific late
blight resistance so far identified has been monogenic. These genes are often
12
populations throughout the world, especially for virulence, has made race specific
resistance genes almost useless in disease control (Andrivon, 1994).
The second type of resistance is general or quantitative resistance in which host
shows a continuous range of variation in resistance from extremely susceptible to
fairly resistant. The effect of this resistant is against all known pathogen strains or
biotypes (Vale et al., 2001). General resistance is controlled by multiple genes, each with a small effect. General resistance consists of a number of complementary
resistance components (host-parasite interactions) which can be individually
measured (Thurston 1971). These resistance components are infection efficiency,
lesion growth rate, latent period, sporulation capacity, and sporulation period. It is
difficult to assess general resistance accurately, as it has been reported to be
influenced by plant age, nutrition, day-length, leaf position (Thurston, 1971).
Breeding for general resistance is also challenging due to frequent decreases in the
level of resistance in crossing and backcrossing (Douches et al., 2001).
Black et al (1996a) reported that resistance in L. pimpinellifolium accession L3708 possessed a single dominant resistance gene Ph-3. This was confirmed and the locus was mapped to chromosome 9 (Chunwongse et al., 1998). L3708 has been further investigated in virulent California fields, and quantitative trait loci aside from
Ph-3 were identified on chromosomes 6 and 8, although the effect of the QTL on chromosome 6 is hypothesized to be a pleiotropic effect of the sp locus (Frary et al., 1998).
Other studies have identified tomato resistance sources to late blight, however
the mode of inheritance of resistance in these sources is unknown. In 1951, Barham
and Ellis screened all tomato plant introduction accessions using a seedling
greenhouse inoculation, and found 28 of the 909 available lines to possess some
resistance. A collection of heirloom cultivars was screened in a field trial with
natural US-11 strain inoculation. ‘Matt’s Wild Cherry’ was identified as possessing
13
Black et al., (1996b) screened lines with Taiwanese P. infestans isolates and found four accessions, L3707, L3708, L3683, and L3684, with some resistance.
Continuous variation of this character suggested that the resistance is quantitative,
presumably polygeneic in nature.
Kim et al., (2005) identified the resistance to late blight in an accession L3708. This resistance has been transferred to processing tomato lines, which are
resistant to multiple P. infestans isolates. Lab trails, inoculated field trials in New York, and naturally infested field trails in Mexico indicate that these processing
tomato lines are fixed late blight resistance. Segregation data do not support the
hypothesis of single gene control of the full resistance trait, but suggest that more
than one gene is involved, and these genes interact in an epistatic manner. Tomato
genotypes carrying the Ph-2 gene of resistance to late blight and sensitive genotypes which have good yield and quality were hybridized by Mijatovic et al. (2007) who
found the new lines and hybrids of tomato were more resistant than their sensitive
parents and showed intermediate type of heredity to late blight.
2.5 Heterosis (Over dominance)
The choice of germplasm source determines the potential improvement for
traits under selection in the breeding programme (Fountain and Hallauer 1996). The
parents used in a plant breeding programme generally fall into two categories:
locally adapted varieties and varieties chosen for a particular attribute without regard
to local adaptation (Simmonds, 1979). All programmes concentrate upon
economical means of exploiting the genetic variability of unrelated foreign parents
and locally well-adapted genetic backgrounds. In addition, the utilization of
heterosis improves the performance of varieties through developing high-yielding
single-cross hybrids in allogamous or autogamous species. The literature includes
many estimates advantages of hybrids relative to the mid-parent (heterosis), the high
parent (heterobeltiosis), or the best standard (inbred or open-pollinated varieties;
14
Heterosis is a biological phenomenon manifesting itself in hybrids that are
more vital, adaptive and productive than their parents (Bai and Lindhout 2007).
Heterosis has been explained by over-dominance and by additive effects. However,
it is still unclear how much each of these effects contributes to the total heterosis
effect (Birchler et al., 2006; Semel et al., 2006). Heterosis has a dual influence in the
breeding procedure: firstly, it enriches the cultivation categories of varieties with
single-cross hybrids; commercial single cross hybrid-varieties are often the major
component of seed companies’ catalogues, as for example in maize (Troyer, 1996),
or in tomato (Scott and Angell, 1998). Secondly, it creates a new gene pool by using
the F2 generation as germplasm; for example, in maize, an increased use of F2 and
backcrosses for second-cycle inbred development programmes was reported
(Jenkins, 1978).
Even though benefits of heterosis in tomato have long been recognized and
some hybrid varieties were available in the 1940s, widespread use of hybrids has
occurred only since the 1970s. The use of hybrids is not due so much to the benefits
of heterosis per se, such as increased earliness and greater yields, but has more to do with several other factors. A primary benefit is the protection of parental inbreds
used in the production of elite hybrids. This is important, since there has been an
increase in the involvement of private companies in tomato breeding research (Scott
and Angell, 1998). A second important benefit of hybrids is the uniformity of trait
expression among plants of a variety (Wehner, 1999). Hybrids offer additional
advantages when important traits are controlled by dominant genes (Kalloo, 1993),
which need not be fixed in all breeding lines. Examples include resistance to
Fusarium wilt races 1, 2 and 3, Fusarium crown and root rot, Verticillium wilt race
1, root-knot nematodes, tobacco mosaic virus and spotted wilt virus (Scott and
Angell, 1998). Also, there are cases where hybrids may offer benefits that are not
possible in inbred or open-pollinated varieties, as for example, the ripening inhibitor
(rin) gene or the non ripening gene (nor), which in the heterozygous form can reduce
postharvest damage if fruit is harvested at more mature stages of development
15
production of hybrids. In tomato, hybrid advantage ranges from 0 to 300% over the
best inbreds (Wehner, 1999). The average turnover time of commercial tomato
cultivars is approximately 5 years.
Tomatoes are heterotic for vigour, increased growth and development,
earliness, yield, uniformity, or adaptability to a range of environments (Scott and
Angell, 1998). Several theories have been proposed to account for heterosis.
Griffing (1990) showed that heterosis in a cross of two tomato inbreds was due to
increased nutrient uptake, as opposed to being more efficient at utilizing limited
nutrients. In spite of commercial hybrid-varieties, a number of local varieties or
open-pollinated varieties are cultivated by farmers, which are mainly grown in the
open-field under lower-input systems.
As the inbred-hybrid system still remains the most important breeding
scheme for the commercial production of hybrid seeds (Miranda Filho, 1999), the
narrowing of the genetic base and the genetic vulnerability to abiotic and biotic
stresses, as well as limited future gains from selection (Taller and Bernardo, 2004)
are matters of concern. The maize paradigm showed that among the maize inbreds
available in 2001 from foundation seed companies, most derived from only eight
inbreds (Lu and Bernardo 2001). This point attracted the attention of tomato
breeders, although tomato has three advantages: (i) in temperate zones, the
proportion of natural out crossing has been between 0.005 and 0.04 (Rick, 1949),
because there is a requirement for physical movement of flowers for pollination to
take place (Jones, 1999), and the stigma receptivity begins 1–2 days before anthesis
(Scott and Angell, 1998); (ii) there are many well-adapted varieties that complement
the source germplasm, and they are themselves either at or near local varietal
standard in performance; and (iii) in self-fertilized crops, like tomato, additive
genetic variation predominates, and it is always feasible to fix and transgress
heterosis (Burdick, 1954; Christakis and Fasoulas, 2001).
New traits are rarely introduced from wild germplasm as it may take many
16
due to linkage drag. When the parental lines are more fixed (F4 to F6), crosses are
made to produce test hybrids. After several generations of testing at the breeders site
and eventually at the farmers’ sites, the best hybrids are selected for commercial
usage. Hybrids of tomato show some heterosis, but this is only selected for at the
latest stage of the breeding programme, when test hybrids are generated. In earlier
generations, the parent lines are selected at a single plant basis but not for combining
abilities or heterosis. So, recurrent selection programmes to select parents with the
best combining abilities, like that used in field crops, is not a common practice in
tomato breeding (Bai and Lindhout, 2007).
2.6 Diallel analysis
One of the most important factors in an breeding program is selection of the
parents (Borem and Miranda, 2005). When choosing parents, the objective is to
maximize the probability of generating new lines that will perform better than the
best pure line that are currently in use. The parents chosen should generate a
population for selection that will meet the criterion of usefulness described by
Schnell (1983), as discussed in Lamkey et al. (1995). The usefulness of a
segregating population was described by Schnell as the mean of the upper α% of the
distribution expected from the population. Mathematically, Uα= YGα, where Uαis
usefulness, Y is the mean of the unselected population and Gα is gain from selection
of the upper α% of the population. This statistic takes into account both the mean
and the genetic variability, thus emphasizing a basic axiom in plant breeding: a
population that will produce an improved cultivar will have both a high mean and an
adequate genetic variability.
In the vegetable species, countless lines exist and cultivate that could be
participate in the hybridization programs to obtain segregated populations, is being
necessary using criteria for selection. The identification of efficient methodologies
17
the available methods, the dialel crossing has been the more thoroughly used in
almost cultivated species. Griffing proposed a dialel technique for determining the
combining ability of lines and characterizing the nature of extent of gene action in
both plants and animals. His approach has also been adapted to assess competition.
Griffing's analysis allows the option to test for fixed (model 1) or random (model 2)
effects. Griffing (1956) proposed four methods of diallel crossing; method 1 (full
dialle), the P, F1 and F1r are included; method 2 (half dialle), P and F1’s included
only; method 3 includes F1 and F1r but no P and finally method 4 where F1 included,
but no reciprocal or parents. Total entries are (P2), [p(p+1)/2], (P2-P) and [p(p-1)/2]
respectively. Experimental material and the objective of the experiment are the main
factors that determine the appropriate method that could be used. The reciprocal
effects can be usefully employed to detect variation due to sex-linked genes and
maternal effects (cytoplasmic inheritance). So, method 3 would be most useful.
While in most combining ability analysis in which a chosen set of lines is used, the
interesting is concentrated on the performance of F1’s. Therefore, there is no
necessary to include the parental lines. But in some cases, it’s important to include
the parents when the breeder want to synthesize new variety and if there is
inbreeding occurs in the species, so it is advisable to use method 1 or 2. In plant and
animal breeding, when a random set of lines is used, dialle crossing method 3 or 4 is
again the most applicable.
The term general combining ability (GCA) is the average performance of a
parent in a series of hybrid combinations and is associated with the presence of
additive effects of alleles and associations of the epistatic additive effect. While the
specific combining ability (SCA) refers to those instances in which the performance
of a hybrid is relatively better or worse than would be expected on the basis of the
average performance of the parents involved (Sprague and Tatum 1942). The SCA
shows the deviation on the average of their parental GCA and associated with
dominance effect and epistasis involving dominance (Cruz and Vencovsky 1989).
Through using these estimates, we can identify the best parents and hybrids for use
18
By calculating the proportion GCA/SCA, a relatively large variance ratio
suggests the importance of additive gene effects while a low ration implies the
presence of dominant and epistatic gene effects. It should also be noted that if
additive x additive effects are present, the GCA component will contain some of
these effects in addition to additive effects.
The diallel analysis is widely used in breeding programs, providing
information about the predominant type of gene action and heterosis and to estimate
the GCA and SCA which aid as tools in choosing the best strategy for improvement
19
2. MATERIALS AND METHODS
2.1 Experimental location
The field experiments were conducted at Horta de Pesquisa da Universidade Federal de Viçosa (UFV). Viçosa belongs to Minas Gerais state (MG), southeastern Brazil. It has a subtropical highland climate, and is situated at an altitude of 689 m
above sea level and is located in the co-ordinates of 20° 45 14 latitude S and 42°
52 54 longitude W. The annual average minimum and maximum temperatures are
15.63 and 26.82 °C respectively and the annual average precipitation is 1,440 mm
with relative humidity of 80% (average annual).
2.2 Plant materials
In the current study, five inbreed lines of F9 generation (127F, 64B, 73A,
163A and 133A) were used from the breeding program against late blight resistance
in tomato, Universidade Federal de Vicosa (UFV). These lines resulted from
interspecific cross between Solanum lycopersicum L.cv. Santa Clara x Solanum habrochaites f. glabratum. They were selected from previous work by Abreu (2005) followed by Fiorini (2008) who produced F8 generation. These lines had confirmed
polygenic resistant genes to late blight, and were used as a source of pollens (♂). These lines are indeterminate in growth habit, with small green and inferior quality
20
2008 in order to increase the amount of seeds and in addition to obtain the F8 lines
by self-pollination.
2.2.1 Genetic resource of Ph-2 and Ph-3 resistant genes
The following advanced inbred varieties; NC 1 CELBR, NC 2 CELBR and
NC 25P were received from Prof. R. Gardner, North Carolina State University. They
are homozygous, with determinate growth habit, heavy foliage and large, red-fruited
tomato. NC 1 CELBR and NC 2 CELBR incorporate combined early blight
resistance (Campbell 1943 and PI 126445 origin) and have late blight resistance
genes (Ph-2 and Ph-3). It is also resistant to Verticillium wilt (Ve gene) and races 1 and 2 of Fusarium wilt (I and I-2 genes). NC 1 CELBR bear deep oblate to flattened globe fruit are firm and highly crack resistant, late in maturity and has larger fruits
than NC 2 CELBR. NC 25P is a fresh market plum tomato line with the Ph-3 gene for late blight resistance and crimson gene for increased lycopene. It has early blight
and Verticillium wilt resistance (Ve gene) and resistance to races 1 and 2 of
Fusarium wilt (I and I-2 genes) determinate in habbit with heavy foliage cover.
Fruits are intermediate in length with 2-3 (mostly 3) locules and jointless pedicels.
Immature fruits are uniform, light green. Fruit are highly resistant to gray wall and
fruit cracking. Besides, the following commercial hybrids were used in our current
study:
‘Ikram’ (Solanum lycopersicum L.): indeterminate growth habit, round slightly flattened; long life, fruit weight 130-150 grams, fresh market variety and
resistance to Fusarium 1 e 2, Verticilium 1, T.M.V.
‘Heinz H7155’ (Solanum lycopersicum L.): is processing tomato, oval fruit shape, resistant to Fusarium (race 1), Verticillium (race 1).
‘Alambra’ F1 (Solanum lycopersicum L.): indeterminate growth habit, fresh market
tomato; fruit weight 200-250 grams; open field, fresh market variety,
21
To study the inheritance in the F2 population, F2 seed of the crosses were
Ikram x inbred line 163A and Heinz H7155 x inbred line 163A were included with
77 and 95 plants of each F2 population respectively. These materials were used from
the previous work of Fiorini (2008).
In addition to the previous materials, ‘New York’ and ‘Caline’ which have
only the Ph-1 resistance gene to late blight were used as standard varieties susceptible control.
2.3 Mating design
Thirty seedlings of each of the 10 selected parents were grown in the
greenhouse during winter 2008 at Horta Velha, Vicosa, MG. Pollens from each
inbred line plants originated from the crossing (Solanum lycopersicum L.cv. Santa Clara x Solanum habrochaites f. glabratum) were collected and bulked into plastic plate, 4cm in diameter with the aid of vibration tool to help pollen-dispersal. Each of
the 3 commercial hybrids (Ikram, Heinz H7155 and Alambra) and three advanced
inbred lines (NC 1 CELBR, NC 2 CELBR and NC 25P) were crossed separately to
each of the five inbred lines following the II mating design (half dialle) where the P
and F1’s were included only. Twenty pollinations for every cross was accomplished
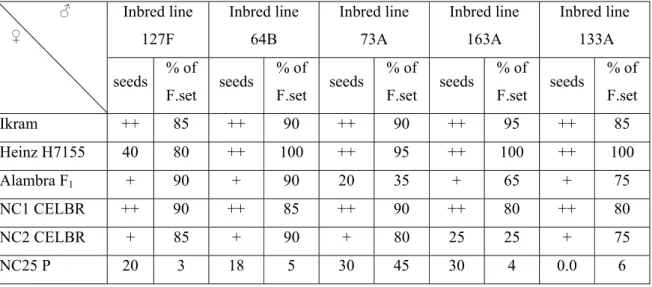
during June/July, 2008. The fruit set of the cross NC 25P x inbred lines was low and
in addition a majority of fruits did not produce sufficient seeds (Table 1) so this
cross was eliminated from the field experiment evaluation. Table 1, shows the
names of parents and the amount of seed of each cross. Seed extraction was done
through fermentation for 48 h according to Giordano et al. (2003).
2.4 Field design
Seeds of F1 were sown in 2nd of March, 2009 in 200-cell trays using
commercial peat moss mixture as growing media fertilized once a week with 0.5%
solution of N:P:K (15:15:20). Thirty five day-old seedlings were transplanted in the
field. The applied experiment design was randomized complete block design
22
cm inter-row. The experiment was surrounded from outside by a border of tomato
plants to prevent the other plants into the blocks and to insure that the amount of
relative humidity and the spraying is distributed equally over the plants as possible.
Not all the seeds of the hybrids were equal in amount since there were certain ones
with few seeds due to the difficulty and incompatibility of interspecific cross
between S. lycopersicum and S. habrochaites and as a result of missing cross combinations with the female parent NC 25P, Design II analyses of 5 x 5 was
applied.
Table 1. The amount of seeds obtained and the % of fruit set of thirty crosses
conducted in the current study during June/July 2008. Viçosa-MG, 2008.
Inbred line 127F Inbred line 64B Inbred line 73A Inbred line 163A Inbred line 133A ♂ ♀
seeds % of
F.set seeds
% of
F.set seeds
% of
F.set seeds
% of
F.set seeds
% of
F.set
Ikram ++ 85 ++ 90 ++ 90 ++ 95 ++ 85
Heinz H7155 40 80 ++ 100 ++ 95 ++ 100 ++ 100
Alambra F1 + 90 + 90 20 35 + 65 + 75
NC1 CELBR ++ 90 ++ 85 ++ 90 ++ 80 ++ 80
NC2 CELBR + 85 + 90 + 80 25 25 + 75
NC25 P 20 3 18 5 30 45 30 4 0.0 6
++: more than 100 seeds; +: around 50 seeds;
2.5 Pathogen isolates
To avoid the specific-race resistance and to eliminate possible epistatic effect
genes of vertical resistance, selection upon the horizontal resistance phenotypes was
considered through applied inoculum of mixture isolates of P. infestans collected from different regions from several production fields of tomato during 28 and 29 of
May 2009 as follow: 5 isolates from Coimbra and 1 isolate each from Ervalia, Paula
Cândido and Viçosa respectively. We could not reach any field of tomato in the city
23
Eucalyptus and other cultivars. At early morning, infected leaves of late blight were
collected from the commercial fields of tomato and put in polyethylene cases saved
in ice tank until reaching the laboratory.
2.5.1 Preparation of inoculum
After reaching the laboratory, the infected leaves were placed in 30 x 40 x 5
cm plastic trays in order to multiply the inoculum. A single ply of facial tissue
paper was plastered with water on the bottom of the tray to maintain high humidity.
The trays were kept in a dark chamber at 18–20 ◦C for 24 h. After 24 h, the surface
of fresh mycelium on the underside of leaves was very lightly brushed with a
toothpick, and the toothpick was whisked in chilled, distilled water in a 100-mL
beaker to loosen the sporangia. The suspension of each isolate was prepared
separately to adjust its concentration. After that equal volume of every suspension
was taken and mixed together. The sporangia suspension was kept in the dark at 11–
12 ◦C for 90–100 min to release the zoospores (Nilson, 2006). A uniform suspension
was used to obtain an accurate sporangia count. The concentration was determined
with a hemacytometer and adjusted to 103 sporangia mL- .The inoculation was
accomplished in 1st of June 2009 at 7:30 PM after about 2 hours of sunset using
manual backpack sprayer (20 litre volume) applying 20 mL of the sporangia
suspension per plant with total volume of 16.50 litres applied for 817 plants. The
time between the preparation of the suspension and inoculation did not exceed two
hours to keep the culture vigorous and maintain infectivity (Abreu, 2005).
2.5.2 Quantify the resistance
Thirty five genotypes of the half-diallel in addition to standard susceptible
varieties were screened against late blight disease under field conditions. The first
observation was recorded after 4 days of inoculation and then every 4 days during
June 2009. The disease severity was recorded based on the proportion of area or
amount of plant tissue that is diseased. To insure optimal conditions for germination
of the zoospores, a level of humidity was provided on the leaves to keep a thin film
24
spray system was adjusted to turn on 15 minutes each 3 h over the 24 h beginning
after the inoculation on 1st June to 23 June 2009. Before applying the inoculation,
the micro sprinklers were kept turned on for approximately 2 hours to provide a thin
film of water to aid the spores to penetrate the plant tissues. After 4 days of
inoculation, the first evaluation of disease severity was started and repeated over
time every 4 days for a total of 6 times. During this period of disease development
(1st to 23 June) the average maximum and minimum temperature was 25.2 and 13.7
°C, respectively and average relative humidity was 85.7. On an average 31.21 mm
of rainfall occured during the evaluation period while was 267.0 and 157 mm on 6th
and 18th of June, respectively.
2.5.3 Data collection
Foliar data were converted using the area under the disease progress curve
(AUDPC) model to account for foliar disease, which progressed over time as follow:
(Tooley and Grau 1984).
Where:
R= rating (estimated proportion of affected tissue) at the ith observation. ti= time (days) since the previous rating at the ith observation.
n = total number of observations.
The AUDPC was first calculated for each plant per plot and the final value of
each plant was taken by calculating the mean of all the plant leaves. To evaluate the
disease severity of late blight, the estimators were submitted to training, to use the
software ‘severity Pro’ (Nutter, 1997), a computerized disease assessment training
25
9 plants for each F1 and their parents. In addition, 95 and 77 plants the two F2
populations was evaluated. It was best to record readings independently (i.e.,
without knowing the value given at the previous reading) at each date, such as
having someone else write in the field book or by using a cassette recorder
(Henfling, 1987). The selection to the resistance to late blight was done based on the
negative values, or in other words, the plants which had minimum values of AUDPC
were considered as resistant. In addition to the previous disease variable, it was
estimated the percentage of severity at the halfway epidemic (Y50) and at the
percentage of severity at the end of epidemic (Ymax).
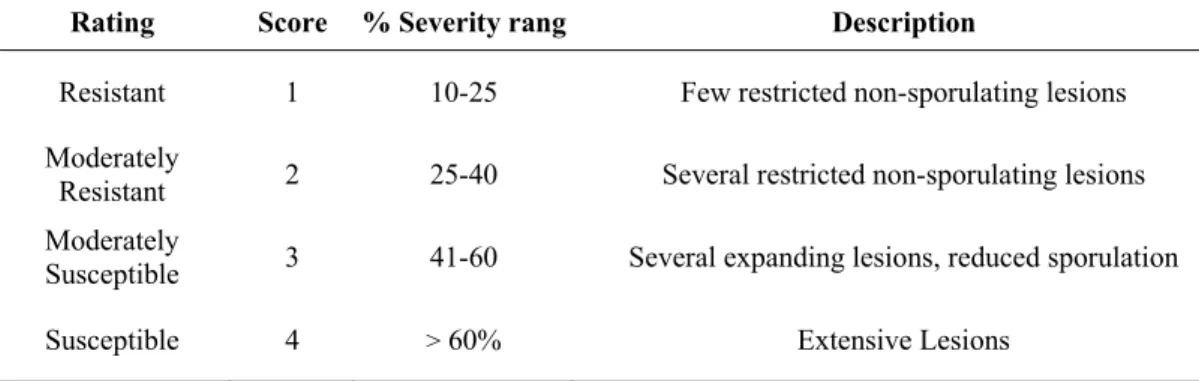
2.5.3.1 Disease rating
To classify the individuals in order to study the genetic inheritance in the
segregating populations, a disease rating was used as shown in Table 2.
Table 2. Four ratings, numeric scores, and descriptions utilized in evaluating the F2
populations. Inbred line 163A is resistant, L. esculentum ‘Ikram’ is highly susceptible, and F2 individuals displayed intermediate symptoms development.
Rating Score % Severity rang Description
Resistant 1 10-25 Few restricted non-sporulating lesions
Moderately
Resistant 2 25-40 Several restricted non-sporulating lesions
Moderately
Susceptible 3 41-60 Several expanding lesions, reduced sporulation
Susceptible 4 > 60% Extensive Lesions
2.6 Evaluation of fruit quality
To evaluate the characters that determine fruit quality of the parents and F1,
three lateral shoots were collected from every genotype from the previous evaluation
experiment before inoculation and was then planted in 72 tray-cells until rooting.
26
experimental design was randomized block with 2 replicates, 60 cm intra-row and
100 cm inter-row.
The following traits were used in the evaluation; average fruit weight (AFW),
fruit size (FZ), fruit shape index (FSI), firmness (F), total soluble solids (TSS), pH,
% titratable acidity (TA) and flavor. Fruit volume was determined by the water
displacement method.
Average fruit weight in grams was taken by random sample of the two first
clusters and average fruit weight was calculated by dividing the weight of sample
with the number of fruits in the sample. To evaluate TSS, pH and TA, the fruits of
each genotype were crushed in a multi brand ‘ARNO’. The TSS was estimated using
digital refractometer ‘QUIMIS’ apparatus Científicos Ltd. The refractometer was
washed with distilled water each time after use and dried with blotting paper. The
total acidity (pH) was estimated using pH meter ‘MS TECNOPON instrumentações
Cientifica’ after standardization with buffer solutions of 7.0 and 10.0 pH. The %
titratable acidity (TA) was determined using 0.05 mol.L-1 of NaOH solution and
using 5 grams of the crushed pulp transferred to 100ml-standard flask diluted to 100
mL with distilled water. 10 ml of this diluted solution was used for titration using
phenolphthalein indicator (1%). Appearance of pink colour was taken as end point
of titration. The titratable acidity was expressed in terms of mg anhydrous citric acid
in 100 ml of juice and calculated as given below:
% Acidity = M=(V x N x meqAc.Citr. x F x 100)/Y
Where:
V=volume (ml) of NaOH used in titratable;
N= concentration of NaOH solution (=0.005)
meq citric acid=0.064
F= correction factor of NaOH=1.04
Y=volume (ml) or weight (g) of sample
The flavor was obtained by proportion between TSS and TA (Kader et al.
27
fruits per entry per replication were measured by digital Vernier Calliper and fruit
shape index was calculated as an average of the ratio (P/E) of five fruits per entry
per replication.
2.7 Statistical analysis
2.7.1 Analysis of variance
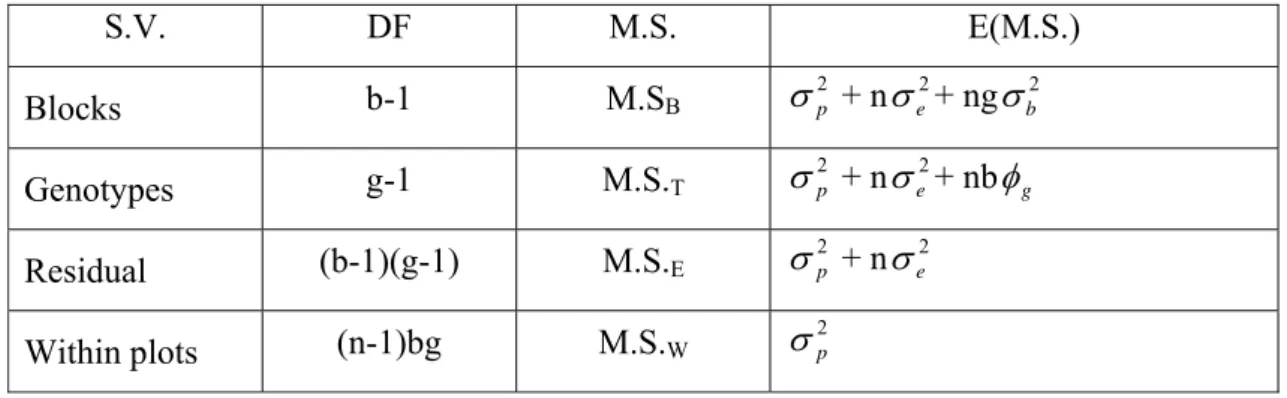
Randomized block design experiment was analyzed by standard analyses of variance and tests of significance at P< 0.05 for each trait.
Table 3. The scheme of analysis of variance of a randomized complete block design
with within-plot individuals information.
S.V. DF M.S. E(M.S.)
Blocks b-1 M.SB
2 p
σ + nσe2+ ngσb2
Genotypes g-1 M.S.T
2 p
σ + n 2 e
σ + nbφg
Residual (b-1)(g-1) M.S.E
2 p
σ + nσe2
Within plots (n-1)bg M.S.W σ2p
The statistical model:
ijk
Y = The observe obtained from the k individual of i genotype evaluated in j block ;
µ= General mean;
Gi= Effect of i genotype considered fixed;
Bj= Effect of j block considered random;
ij= Random effect of the variance among plots;
ijk= Random effect of variance within the plants among the plots.
In this model, the following components of variance can be obtained:
2 p σ
: Phenotypic variance among plants within the families;
ijk
Y
= µ + i
G
+ j
B
28 2
b
σ : Component of variance of environmental factors, that measures the variations
among blocks
g
φ : Squares component associated with families’ variability
2 e σ
: Component of environmental variance that measures the variations among plots
2 p
σ : Component of phenotypic variance that measures the variations among plants
within plots.
2.7.1.1 Dunnett’s test
Dunnett’s test was applied (Dunnett, 1955) at P<0.05 for comparing each disease variable mean with the control mean. Dunnett’s test controls the experimental error and is more powerful than tests designed to compare each mean with each other mean. Dennett’s test is conducted by computing a t-test between each genotype and the control group using the formula:
Where:
Mi is the mean of the ith genotype group, Mc is the mean of the control group, MSE
is the mean square error as computed from the analysis of variance, and nh is the
harmonic mean of the sample sizes of the experimental group and the control group
2.7.1.2 Cluster analysis
Three disease variables Y50, Ymax and AUDPC were used to calculate squared
Euclidean distances. The distances were used to group the genotypes into clusters
according to the method outlined by Johnson (1967). When all variables are
continuous, the most commonly used distance between two individuals
(observations) is the Euclidean distance or the Manhattan distance. The Euclidean
29
2.7.2 Diallel analysis
For the determination of combining abilities and gene effects, both disease
variables AUDPC and Ymax were used in the statistical analysis. The GCA and SCA
were determined according to the Griffing (1956) diallel crossing system analyses:
Method 2, with parental values but without reciprocal crosses. Crosses were
considered as fixed effects, so the GCA mean square was tested against SCA mean
square for estimating the significance of F values.
The genotypic value Gij of the single cross hybrid obtained by pollinating maternal parent i by paternal parent j is:
Gij = μ + gcai + gcaj + scaij
where
μ = the overall mean
gcai = the general combining ability of parent Pi gcaj = the general combining ability of parent Pj
scaij = the specific combining ability of parents Pi and Pj
Half diallel involving two groups of parents and their crosses closed to the
factorial model proposed by Comstock and Robinson (1948) (Model II).
Adjustments to the Griffing model (1956) and Gardner and Eberhart (1966) for this
type of diallel have maximum possible information on the groups with few crosses
than that required in complete diallel.
The following model was carried out:
Analysis of Parents and F1's- (Geraldi and Miranda Filho, 1988)
(
)
.2 1
' 2
1 i j ij ij
ij d d g g s
30
Where:
Yij: The mean crossing involving the i-th and j-th parents of groups I and II;
Yi0: The mean i-th parent of group I (i = 0,1,...p)
Y0j: The mean of the j-th parent of group II (j = 0,1,...q)
μ: The diallel general mean
d1,d2: Contrasts involving means of groups I and II and the general mean
gi : Effect of general combining ability of the i-th parent of group I
g'j : Effect of general combining ability of the j-th parent of group II
sij : Effect of specific combining ability
εij.: Mean of the experimental error
All the statistical analyses, analysis of variance, cluster analysis, comparing
between the means and estimation of genetic parameters in the half diallel and
31
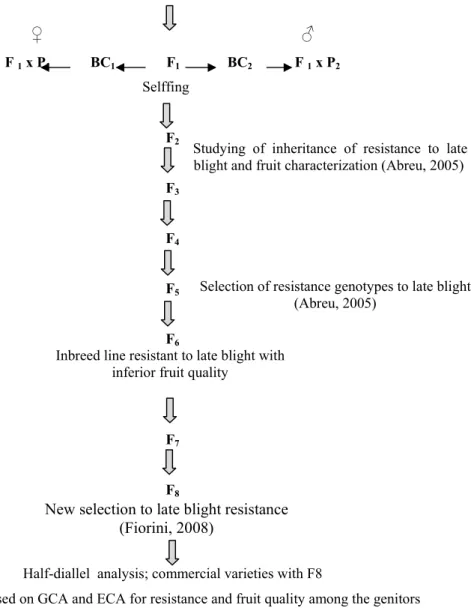
Selffing
Studying of inheritance of resistance to late blight and fruit characterization (Abreu, 2005)
Selection of resistance genotypes to late blight (Abreu, 2005)
Inbreed line resistant to late blight with inferior fruit quality
New selection to late blight resistance (Fiorini, 2008)
S. lycopersicum L. cv. Santa Clara x S. habrochaites f. glabratum accession BGH 6902
♀ ♂
F 1 x P1 BC1 F1 BC2 F 1 x P2
F2
F3
F4
F5
F6
F7
F8
Half-diallel analysis; commercial varieties with F8
Selection based on GCA and ECA for resistance and fruit quality among the genitors
Half –diallel analysis; combination the resistance genes from both lines and testers groups
Qualitative (ph-2, ph-3) combined with quantitative resistance genes
Study the inheritance of resistance in of F2 populations:
‘Ikram’ x 163A and ‘Heinz H7155’ x 163A
Identification of SSR molecular marker linked
to resistance genes and QTLs mapping
32
3. RESULTS AND DISCUSSIONS
3.1 The inheritance analysis of resistance to late blight
After four days of the inoculation, the disease symptoms began to show up
and were very slight. In the following days, heavy rain and low temperature which is
considered favorable and optimal natural conditions for disease development
followed and from the second evaluation, the lesion expansion of the infected plants
was obvious and the symptoms were extreme.
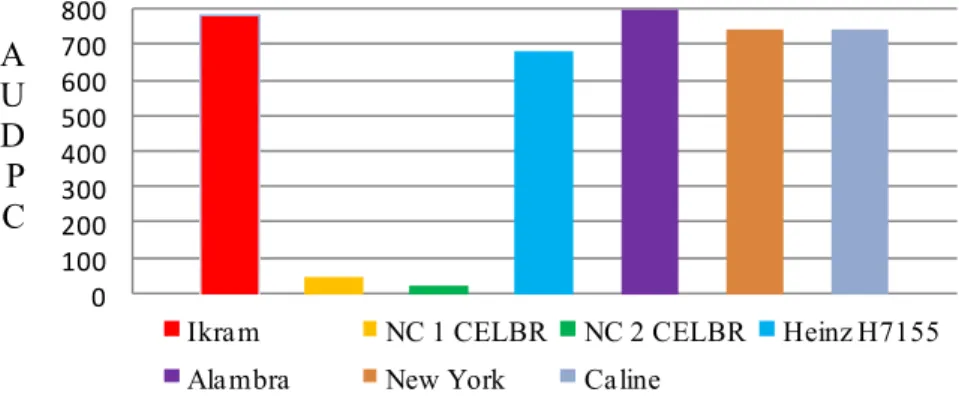
Out of the thirty five genotypes (parents and their progenies), none exhibited
immune reaction. The females varieties (group I) differed in their resistance
expression and susceptibility (Figure 2) while the testers (group II), all the inbred
lines were closed in their expression in respect of AUDPC and the 73A recorded the
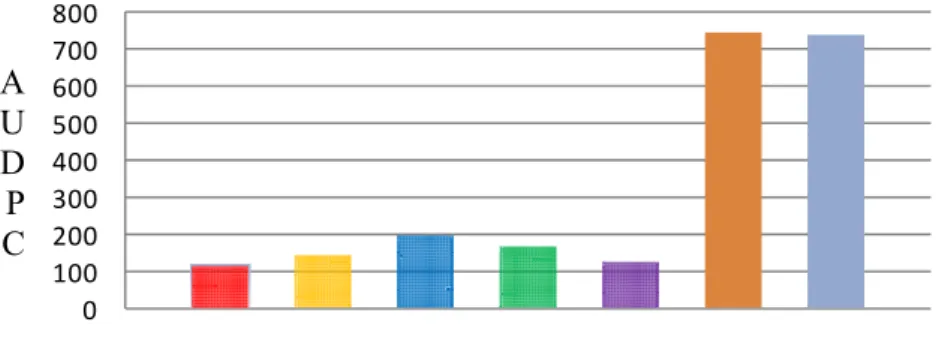
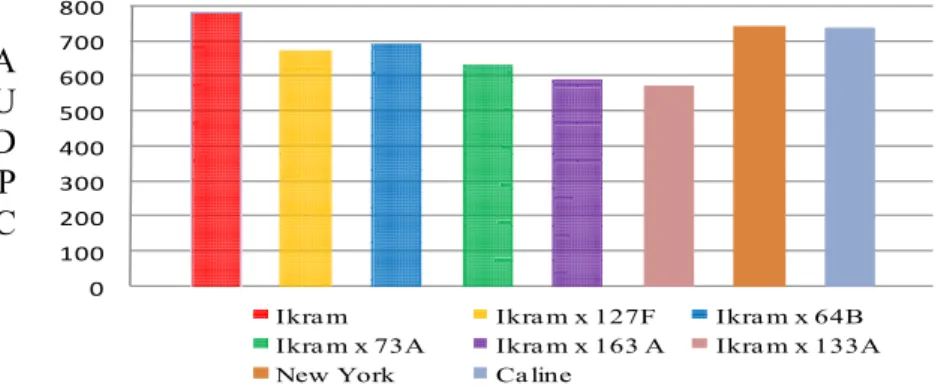
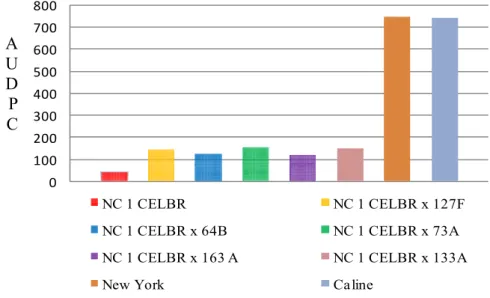
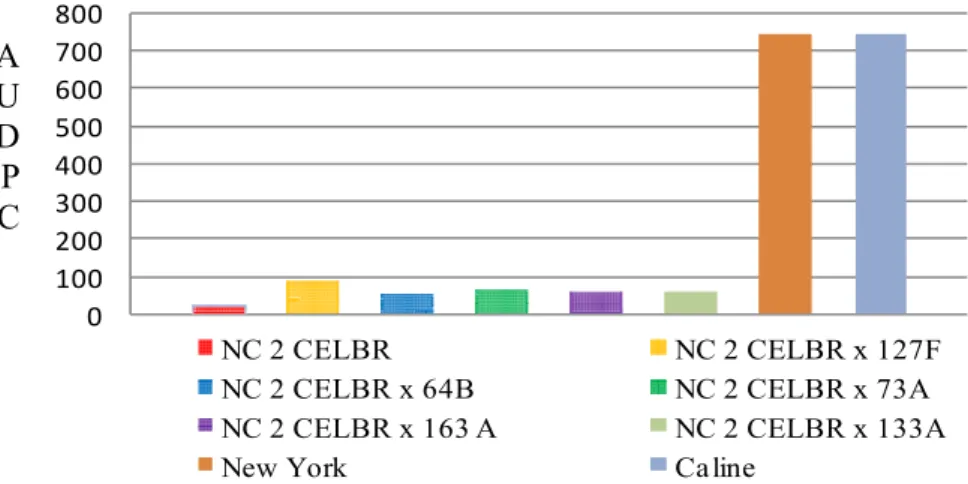
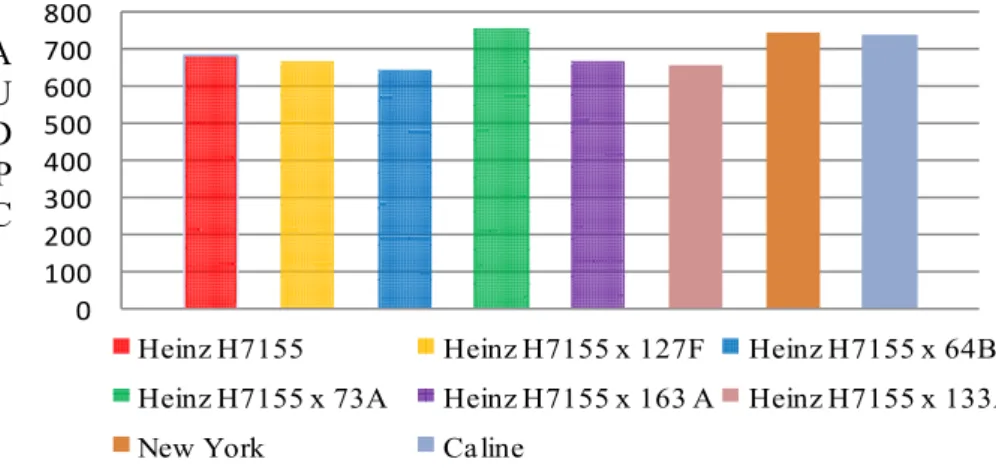
highest values comparing with other testers. All of the crosses between varieties
parents and inbred lines are represented in Figures 3, 4, 5, 6 and 7. However, two
crosses resulted from crossing both NC 1 CELBR and NC 2 CELBR as females
parent to the five inbred lines as source of pollens were found to be resistant in all
the three experimental plots. In these crosses, the lesions were very small and there
was less sporulation as compared with the susceptible varieties ‘New York’ and
33
of these crosses may be attributed to the differences in the genetic background and
the types of the resistant genes they possess which transmitted from the parents to
their progeny.
The commercial female parents (Figure 2) showed divergence in respect of
resistance to late blight comparing with NC 1 CELBR and NC 2 CELBR. The
Alambra cultivar had the maximum value of AUDPC ( 801.90) and was grouped in
the same group of the cultivar Ikram despite it not having significant differences
between its group and control group (Caline and New York) in Dunnett's test at
P<0.05 (Table 5). While the other parents showed no statistically significant
difference. The both NC 1 and NC 2 scored the minimum values of AUDPC and had
high sufficient vertical analysis probably due to their content of monogenic
resistance genes Ph-2 and Ph-3.
Certain genotypes were maintained after the last field evaluation on 23rd June
since these genotypes had slight symptoms and showed high level of resistance over
all the replicates. These genotypes (F1) resulted from the crosses NC 1 CELBR and
Figure 2. The mean values of the area under disease progress curve (AUDPC) of the female parents commercial hybrids (Ikram, Heinz H7155, Alambra) and NC 1, NC 2 CELBR possessing the resistance genes Ph-2 and Ph-2 + Ph-3, respectively, and ‘New York’ and ‘Caline’ as susceptible control.
A U D P C
0 100 200 300 400 500 600 700 800
Ikra m NC 1 CELBR NC 2 CELBR Heinz H7155