Jacques-Alexandre Sepulchre1*, Sofı´a D. Merajver2
, Alejandra C. Ventura3
1Institut Non Line´aire de Nice, UMR 7335 CNRS - University of Nice Sophia Antipolis, Valbonne, France,2Department of Internal Medicine, and Comprehensive Cancer Center, University of Michigan, Ann Arbor, Michigan, United States of America,3Instituto de Fisiologı´a, Biologı´a Molecular y Neurociencias, CONICET and Departamento de Fisiologı´a, Biologı´a Molecular y Celular, Universidad de Buenos Aires, Buenos Aires, Argentina
Abstract
In biochemical signaling pathways without explicit feedback connections, the core signal transduction is usually described as a one-way communication, going from upstream to downstream in a feedforward chain or network of covalent modification cycles. In this paper we explore the possibility of a new type of signaling called retroactive signaling, offered by the recently demonstrated property of retroactivity in signaling cascades. The possibility of retroactive signaling is analysed in the simplest case of the stationary states of a bicyclic cascade of signaling cycles. In this case, we work out the conditions for which variables of the upstream cycle are affected by a change of the total amount of protein in the downstream cycle, or by a variation of the phosphatase deactivating the same protein. Particularly, we predict the characteristic ranges of the downstream protein, or of the downstream phosphatase, for which a retroactive effect can be observed on the upstream cycle variables. Next, we extend the possibility of retroactive signaling in short but nonlinear signaling pathways involving a few covalent modification cycles.
Citation: Sepulchre J-A, Merajver SD, Ventura AC (2012) Retroactive Signaling in Short Signaling Pathways. PLoS ONE 7(7): e40806. doi:10.1371/ journal.pone.0040806
Editor:Masaru Katoh, National Cancer Center, Japan
ReceivedMarch 21, 2012;AcceptedJune 13, 2012;PublishedJuly 26, 2012
Copyright:ß2012 Sepulchre et al. This is an open-access article distributed under the terms of the Creative Commons Attribution License, which permits unrestricted use, distribution, and reproduction in any medium, provided the original author and source are credited.
Funding:ACV is a member of the Carrera del Investigador Cientı´fico (CONICET) and was supported by the Department of Defense Breast Cancer Research Program, the Center for Computational Medicine and Bioinformatics (University of Michigan), and the Agencia Nacional de Promocio´n Cientı´fica y Tecnolo´gica (Argentina). SDM receives funding from the Breast Cancer Research Foundation. The international program of scientific collaboration PICS 05922 between CNRS (France) and CONICET (Argentina) supported this work. The funders had no role in study design, data collection and analysis, decision to publish, or preparation of the manuscript.
Competing Interests:The authors have declared that no competing interests exist.
* E-mail: [email protected]
Introduction
One of the most vital processes in biology is the transduction of signals along biochemical pathways, enabling the living cell to elicit appropriate responses to chemical and physical stimuli [1]. In this context, the concept of signaling cascade is used as a paradigm or a model of signaling pathways. It consists of a chain of enzymatic reactions wherein a protein is interconverted reversibly between two forms. At each stage in the cascade, the activated form of the protein, which usually is a covalently modified derivative of the native protein, serves as the enzyme to activate the protein in the next stage in the chain and so on. Thus, a signaling cascade consists of a succession of covalent modification cycles, whose classical representative example is the phosphory-lation/dephosphorylation cycle, but the general concept is broadly applicable. In some important cases, such as the well-studied MAPK cascades, the stages are in fact composed of double phosphorylations [2,3]. In all cases, the concept of cascade clearly indicates a notion of flow oriented unidirectionally.
A general intracellular signaling network may consist of several interconnected cascades [4]. Its topology can then be described as an oriented graph whose nodes represent stages of the cascades and the arrows serve to relate the activated proteins at a given stage to other covalent modification cycles or to a substrate targeted by the network. Associated with such a graph one may define several signaling pathways, namely several paths in the oriented graph, going from a top vertex, representing a biochemical entry of the system, e.g. a ligand, towards the bottom
stage of one of the cascades, e.g. a transcription factor for some genes. A simple type of signal that can be transmitted in this system is a step increase of the enzyme activating the top cycle of one signaling pathway. Several studies have been devoted to the modeling of the propagation of such signal in signaling chains, and on the transmission properties as a function of most of the parameters of the cascade [3,5–7].
of the effect (referred to as retroactivity in [9]) was done mostly numerically in [8], introducing the notion of ‘‘reverse stimulus response curve’’. Now, we study in detail reverse stimulus response curves, by characterizing both analytically and numerically when to expect a measurable upstream effect due to a downstream change in a control parameter. This work provides a roadmap for planning experiments that carefully account for this phenomena.
The absence of retroactivity for a signaling module implies that the state variables of this module do not change when its output is used as the input of another device. Special conditions are to be met in the design of a network unit in order to minimize the retroactivity [9,10]. In the context of engineering, and specifically in synthetic biology where modularity is required [11–13], retroactivity is usually considered as a nuisance, often preventing the proper functioning of devices that consists of assemblies. The property of pathway retroactivity started to gain interest in the systems biology community [9,14–16]. Retroactivity tends to be attenuated in long signaling cascades [7,10]. However, ref. [10] also shows that the probability that a 3-stage cascade exhibits retroactivity is around 0.5, so under many commonly encountered conditions, retroactivity occurs. Indeed, recent experiments demonstrate that retroactivity can be set in evidence and measured
in vivoin the MAPK cascade controlling the early development of drosophila embryos [17]. Anin vitrostudy shows that retroactivity effects can be easily induced at one stage of the signaling system regulating the nitrogen assimilation in E. coli [18]. In short, retroactivity can be experimentally demonstrated in signaling pathways. In the recent paper by Wynn et al [16], it is shown that an important consequence of retroactivity is its role in the cellular response to a targeted therapy. In particular, we characterized the fact that kinase inhibitors can produce off-target effects as a consequence of retroactivity. In this numerical study, a statistical methodology based on a random sampling of the parameter space was utilized. In particular, that study considered a signaling topology with 3 single cycles, where one of them activates the other two in parallel. This system is also analysed in the present paper which is based on a numerical and analytical study of the nonlinear equations. In that sense, both articles complement each other.
Moreover, in the present work, we make use of the property of retroactivity in order to extend, theoretically, the standard view of signaling to a new type of intracellular signaling. Indeed, the existence of retroactivity in signaling pathways turns the usually one-way oriented graphs mentioned above, into two-way oriented graphs, with arrows going now from downstream to upstream. We call retroactive signalingthe design of a pathway that exploits this
possibility, that is to say, an extended signaling pathway which comprises a connected path of upstream signaling from output to input (cf. Fig. 1). Since retroactivity is a secondary effect, when compared with the usual activation in signaling cascades, a retroactive signaling pathway would typically include only one or a few upstream arrows combined with the usual downstream arrows. Nevertheless, the possibility of retroactive steps in a signaling pathway opens up previously unexplored possibilities for signal transduction.
In this paper we explore this concept for the first time in short signaling pathways like the basic case of a 2-cycle cascade and simple extensions of it. The 2-cycle cascade, or the bi-cyclic cascade, is usually described as a motif comprising 2 cycles and a single arrow linking the activated protein of the first onto the second cycle. In this article, retroactive signaling in this system will be dealt with by analysing how a variation of the parameters affecting the downstream cycle, e.g. varying the total protein concentration in this cycle, or its phosphatase, can induce a response in variables of the upstream cycle. The upstream response can be computed numerically and estimated analytically. We will illustrate the theoretical work with examples of retroactive signaling in short multi-cycle pathways.
Results
The Main Question
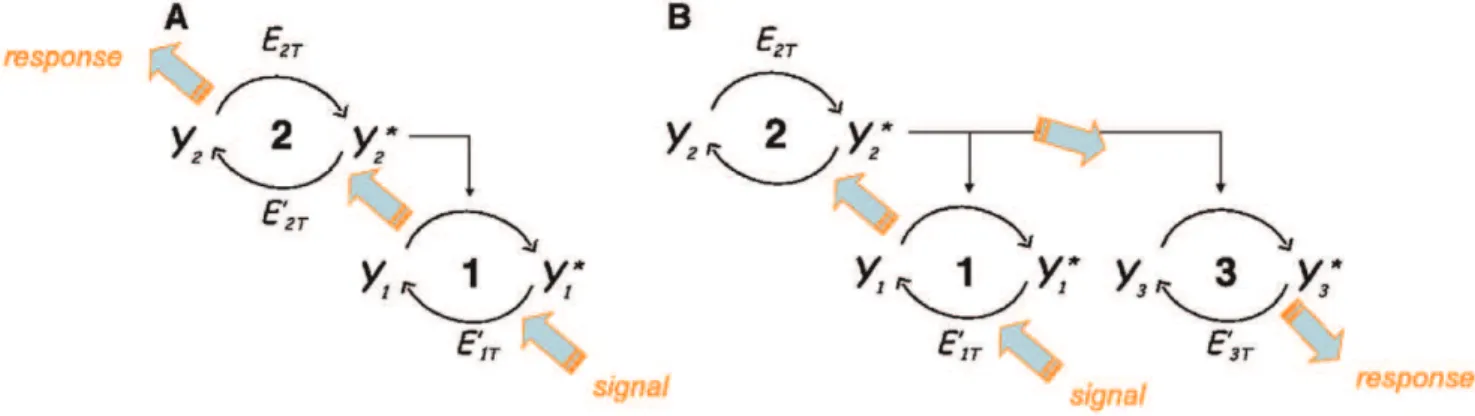
Figure 1 depicts simple motifs of 2-cycle and 3-cycle pathways. The goal is to study the conditions under which a signal, or a perturbation, that modifies the state of adownstreamcycle, can be transmittedupstream, to another cycle in the context of these short pathways. We will focus most of our studies on what happens to the upstream cycle in a 2-cycle system, when control parameters of the downstream cycle are modified, as for instance its total available protein or its total phosphatase.
The mathematical equations describing these systems are discussed in the Methods section. To summarize our main notations, we name each cycle in a given signaling pathway by an indexi(i~1,2, ). We take the convention to call cycle 1 the starting cycle of a retroactive signaling scheme, and to increment the number of the other cycles following their position in the signaling network until the last cycle in the pathway has been reached. Figure 1(B) shows a simple example of retroactive signaling in the pathway 1?2?3 where cycle 2 is an enzyme for both cycles 1 and 3. For notational convenience we will use variable names to denote both a chemical species and its concentration. For instance, the instantaneous state of each cycle
Figure 1. Motifs of short signaling pathways illustrating the concept of retroactive signaling in (A) a 2-cycle cascade and (B) in a 3-cycle cascade.Thick arrows indicate the direction of signaling.
doi:10.1371/journal.pone.0040806.g001
is described by the variablesYiandYi, denoting respectively the
concentrations of the inactivated and of the activated proteini, whose total amount is denoted byYiT. The enzymatic activations
of a given stage of the cascade on the next stages are indicated by vertical top-down arrows on Fig. 1, except for the activation of the uppermost stage for which the activating enzyme is a parameter, e.g.E2Tdenoting the total concentration of the enzyme converting Y2intoY
2. In all cases, the enzyme deactivating cycleihas a total
concentration denoted byEiT0 .
In most signaling systems, the activated form of protein i
corresponds to its phosphorylated form, in which case the converting enzymes are called kinaseand phosphatase, respectively for the phosphorylation and the de-phosphorylation of the protein. Since this situation is the most frequently present in intracellular signaling modules, in what follows we will often name E2 the kinase and E20 the phosphatase of cycle 2, just for brevity. Moreover, the activating covalent modification will be referred to as phosphorylation. In fact, all the formalism used in this study can equally well apply to other covalent modifications like adenlyla-tion, methylaadenlyla-tion, GTP-ase modifications.
Varying the Available Protein in a Signaling Cycle
In order to describe the 2-cycle cascade (cf. Fig. 1(A)) from the point of view of retroactive signaling, let us start by suppressing the phosphatase in the upstream cycle, i.e. set E0
2T~0 in cycle 2.
Then, cycle 1 behaves like a single signaling cycle with kinaseY2T
and with phosphatase E0
1T. Let us analyse what happens to the
activated and the non-activated proteins in cycle 1, when the total available amount of this protein, denoted by Y1T, is varied
between0and an arbitrarily large value. In what follows, we will see that answering this question will provide a way to analyse simple instances of retroactive signaling.
The intermediate complexC1formed by enzymeY
2~Y2Tand
proteinY1is a key chemical species in the coupling between cycle 2 and cycle 1. Thus it is relevant to study howC1grows when the total protein of cycle 1 is increased from the value0. Figure 2(B) shows the case where cycle 1 is deactivated (i.e.Y1wY
1). Then,C1
first increases proportionally to Y1T, and reaches a plateau
corresponding to its saturated value,Y2T, whenY1T&Y2T. This
saturating behavior suggests the definition of a characteristic range for the variation ofY1T, meaning that above this range a further
increase of total protein in cycle 1 has not much effect on the sequestration of protein in cycle 2. For example, we can define the characteristic range for Y1T by extrapolating the initially linear
growth of C1 as a function of Y1T to its asymptotic value C1~Y2T. This is indicated and denoted on Fig. 2 by Y1c. This
characteristic range of Y1T can be analytically calculated as a
function of the parameters of cycle 1. The result is:
Y1c~ 1 k1z
1
k0
1 z
K1
V1z K0
1
V0
1 !
V1 ð1Þ
where V1 and V0
1 are the maximal reaction rates defined in
Eq.(19), and(K1,K0
1)are the Michaelis-Menten coefficients of the
cycle 1 (cf. section Methods). The quantityY1cwill be used in the
following in order to non-dimensionalize the parameter Y1T by
scaling it withY1c wheneverY1T is plotted (e.g. in abscissa).
Figure 2(C) shows the increase ofC1when cycle 1 is activated (Y1vY
1). It can be shown that in this case the maximum amount
forC1isV
0 1
V1Y2T, withV 0
1vV1, meaning that the sequestration is
lower than in the case where cycle 1 is deactivated. Therefore, we
will see in the next Section that in order to optimize the retroactivity in a 2-cycle system, the downstream cycle should be deactivated, so that varying Y1T has a larger effect on C1 and
thereby a greater influence on the upstream cycle.
At the same time, two distinct behaviors are seen for variables (Y1,Y
1) as a function of totalY1T, according to whether cycle 1 is
activated or not (cf. Fig. 2(D-E)). If cycle 1 is deactivated the asymptotic behavior is a linear increase of variableY1 whileY1 tends to a constant. If cycle 1 is activated, the converse happens, namely Y
1 grows linearly and Y1 reaches a constant value.
Therefore, increasing the amount of substrate Y1T beyond the
characteristic rangeY1cin the covalent modification cycle 1 tends
to an increase of either the activated or of the deactivated protein, but not of both, and the other variable tends to a constant. These latter values can be computed analytically as follows, ifY1T&Y1c
(cf. the section Methods):
N
ifV1vV 0 1thenY
1=K
0
1?
1 V0
1=V1{1
ð2Þ
N
ifV1wV0 1thenY1=K1? 1
V1=V10{1 ð3Þ
Figures 2(D-E) illustrates also that the graphs ofY1 andY
1 as a
function ofY1T can be sketched by piecewise linear
approxima-tions. In particular, the initial slope ofY1with respect toY1T is
found to beK1=Y1c, whereas the initial slope ofY1is V1
V0
1
K0
1=Y1c
(cf. section Methods).
The results of this section were obtained by assuming absence of phosphatase in cycle 2, so that cycle 1 behaved as an isolated cycle. In the general case of a 2-cycle system, with some phosphatase acting in the upstream cycle (E0
2T=0), the obtained
results can change, but the modifications are worked out in the Method section. Particularly, one shows that the characteristic
range for Y1T, which are now denoted by Y E0
2T
1c , has a similar
expression to the one defined by Eq.(1), but replacing in this equation V1 by Y
2(0), where Y2(0) is the phosphorylated
protein in cycle 2, in the limit of vanishingY1T. Nevertheless, it
appears that Y1c (Eq.1) is useful as an upper bound of the
characteristic rangeYE 0 2T
1c , whose a lower bound is given byK1.
Regarding the behavior of the cycle whenY1T&Y1c, Eq.(2) still
holds whatever the value of E0
2T is, if V1vV0
1. On the other
hand, when V1wV0 1 and E
0
2T=0, the limit (3) gives the final
value ofY1 only approximately. The exact asymptotic behavior of Y1, which cannot be formulated as a simple analytical expression, is given in the Method section (cf. Eq.(39)).
Retroactive Signaling in a 2-cycle Cascade
Having gained insight into how a covalent modification cycle behaves when its total proteinY1T is varied, we ask how the cycle
amount of phosphatase acting on the deactivation of cycle 1, i.e. E0
1T. In this section the considered control parameters of the
2-cycle cascade will beY1T orE 0 1T.
What kind of variables can we measure on the upstream cycle to observe the effect of varying the control parameters of the downstream cycle? One possibility is to measure the fraction of activated (e.g. phosphorylated) protein in cycle 2 [17]. The latter is defined by:
P~
Y
2zC
0
2zC1
Y2T
ð4Þ
Indeed the intermediate complexesC20 andC1both contain some fraction of the phosphorylated protein in cycle 2. In particular,C1 represents the fraction of activated protein 2 that is sequestered in
Figure 2. Behaviors of cycle 1 as a function ofY1T, the total protein in cycle 1.The kinase for this cycle is denoted byY2Tand the phosphatase byE0
1T. The abscissa are scaled by the characteristic rangeY1c, cf. Eq. (1). A) Two cases are considered for cycle 1, which is said deactivated ifY1wY
1and activated ifY1vY
1. B-C) Increase of the intermediate complexC1when cycle 1 is respectively deactivated or activated.
D-E) Variations of activatedY
1and non-activatedY1proteins in the two casesY1wY
1 andY1vY
1. The graphs were obtained by solving Eqs.(16)-(18)
with the following parameters :k1=k0
1~1,K1~K
0
1~0:1mM,Y2T~1mM,E
0
2T~0; panels (B-D) :E 0
1T~2mM.; panels (C-E) :E 0
1T~0:5mM.
doi:10.1371/journal.pone.0040806.g002
cycle 1. Thus this variable embodies the coupling between the two cycles and the source of retroactivity.
Figure 3 shows the variations of the activated fractionPas a function of parameters Y1T and E
0
1T under several conditions,
depending on cycle 2 is activated or not. As will become clearer in the next sections, the main message of Fig. 3 is that varying the downstream parameters, the retroactivity on the phosphorylated fraction P is significant only when the upstream cycle starts in deactivated state (left column). It is relatively negligible however, when the upstream cycle starts out activated.
Varying the available protein of the downstream cycle. Let us consider in detail the effect of varying the total proteinY1T in cycle 1. In practice, this can be achieved in various
ways, e.g. by overexpressing the gene coding for protein 1, or by interfering with this quantity by adding a drug able to inhibit this protein [16], or by sequestration ofY
1 resulting from modifying its
substrates [19]. Since the retroactive control of cycle 1 on cycle 2 depends crucially on the complex C1, the relevant range of variation for Y1T can be estimated by Y1c given by Eq.(1).
Therefore, the graphs presented in Figs. 3(B-C) show variations of P over a range of 2Y1c, which is adequate to capture the
significant variations of the activated fraction of protein 2 induced by varyingY1T. Figure 3(B) shows that when cycle 2 is deactivated,
the variation ofPcan pass from a value close to0to a value close to1. Moreover the amplitude variation ofP is maximum when cycle 1 is deactivated. In the latter case, we have seen in the previous section that the non-activated protein Y1 grows proportionally toY1T (Fig. 2(D)). This arbitrarily large increase
of the substrate ofY1causes the saturation of enzyme 1 for cycle 1 and the complexC1increases towards its maximal allowed value Y2T like in Fig. 2(B). Therefore, by increasing Y1T, the
phosphorylated fraction P tends to its maximal value 1; in this case we have a phenomenon of total sequestrationof protein 2 in cycle 1.
On the other hand, if cycle 1 is activated and cycle 2 is still deactivated, the results of the previous section show that C1
reaches only a fraction of total protein 2, namely V
0 1
V1Y2T (Fig. 2(C)). Here we observe a phenomenon of partial sequestration
of species 2 by cycle 1. Once this partial sequestration has occurred, a further increase ofY1T has no longer an effect on the
upstream cycle 2. The latter behaves then as a single covalent modification cycle with a reduced amount of protein 2, equal to
Y2T(1{ V0
1
V1). Therefore, the fraction P saturates sooner than before and remains inferior to1. It is seen on Fig. 3(B) (thin red lines) that a piecewise-linear sketch for the variations of P is sufficient to describe the behavior ofPas a function ofY1T.
Finally, the case where cycle 2 starts out activated is depicted on Fig. 3(C). In this situation, the phosphorylated fractionPhardly varies whatever the value ofY1T is, especially if cycle 1 starts out
also activated. If it is deactivated, the variation ofPis non zero, but very weak. In conclusion, in order to enhance the retroactive control of cycle 1 on cycle 2, that is to get the larger possible increase of the fraction of phosphorylated protein in cycle 2, and this as a function of parameter Y1T of cycle 1, one should start
from a situation where both cycles 1 and 2 are deactivated.
Varying the phosphatase of the downstream cycle. We turn now to the retroactive effect of varying the phosphatase of the downstream cycle,E10T, on the fraction of phosphorylated protein in cycle 2. Here the total proteinY1T is fixed. Figures 3(D-E) show
the variation of the phosphorylated fraction P as a function of V0
1=V1, that is a non-dimensionalized parameter proportional to
E0
1T (Eq.(19)). In the same manner as before, one observes that the
phosphorylated fractionPexhibits a significative variation only in the case where cycle 2 is deactivated (Fig. 3(D)). Moreover, the variation of P is seen only when the control parameter V0
1=V1
varies in the interval½0,1, that is when cycle 1 passes from its activated to its deactivated state. Then, the level ofP increases proportionally toE0
1T, until reaching a plateau depending on the
chosen amount ofY1T. This plateau, that is the maximum fraction
of upstream protein 2 that can be phosphorylated by increasing the phosphatase of the downstream cycle, can be predicted by the expression:
Pmax~ Y
2
Y2T 1z
Y1T
K1zY
2(1zk1=k
0
1) z
E0
2T K0
2zY2 !
ð5Þ
This equation is derived below, in the section Methods. In this equation,Y
2 is the maximum free protein 2 that is activated in the
limit of arbitrarily large phosphataseE0
1T. Thus it is unknown a
priori but, as a first approximation, it can be replaced byY
2(0)
(the value ofY
2in absence of cycle 1). To get a better estimate, the
actual value ofY2can be found by using an iterative process. Equation (5) allows us to estimate the level ofY1T necessary to
reach a given fractionPmaxin the limit of large phosphataseE 0 1T:
Y1Tw Pmax Y2T
Y
2 {1{
E0
2T K0
2zY2 !
K1z(1z
k1
k0
1
)Y
2 !
ð6Þ
In summary, in a 2-cycle cascade, in order to create conditions that may substantially modify the fraction of the activated protein in the upstream cycle by perturbing the parameters of the downstream cycle, it is recommended to deactivate the upstream cycle 2. Then, if the downstream cycle 1 is also maintained deactivated a substantial change inPcan be obtained by varying the total protein in the downstream cycle, within a range½0,Y1c,
whereY1ccan be computed as a function of the system parameters
(Eq.(1)). In the case where the downstream cycle is activated, it is also possible to changePby varying the total protein, but in a smaller range than before, namely ½0,Y1cV
0
1=V1. Varying the
phosphatase of the downstream cycle will not modifyP, if cycles 1 and 2 are both deactivated. If, on the other hand, the downstream cycle is activated, then a retroactive signaling inPcan be achieved by modifying the downstream phosphatase, provided that the total protein 1 is sufficiently abundant (cf. Eq.(6)).
The above analysis focussed on the changes of the fraction of phosphorylated protein in cycle 2 because the variable P is experimentally accessible. However, it is also interesting to describe the behaviors of the 2-cycle cascade in terms of the free proteins in cycle 2, respectivelyY2andY
2, as will be covered in
the next section. Indeed, as discussed below, Y2 and Y2 are responsible for the possible crosstalk effects in cascades with more than 2 cycles.
Downregulation of the free proteins in the upstream cycle. When the upstream cycle 2 is deactivated, Figs. 3(B,D) demonstrate that the phosphorylated fractionPcan be raised by increasingY1T orE
0
1T from0. How does this growth affect the
amount of free non-active and active proteins in the upstream cycle? It is seen on Fig. 3(F) and (H) that the growth ofPcoincides with a decrease of the non-active protein Y2. Conversely, the variation of the free activated proteinY
2 is negligible (not shown).
cycle 1 can lead to a complete depletion of protein Y2 in the upstream cycle. The decrease ofY2is roughly linear in the range ½0,Y1c, and then beyond this range it is inversely proportional, Y2!1=Y1T. When the downstream cycle is activated, the decrease
ofY2occurs on the smaller range½0,Y1cV 0
1=V1and then reaches a
plateau that can be analytically predicted (cf. thin continuous lines on Fig. 3)(F)). This situation reflects the phenomenon of partial sequestration of protein of cycle 2 in the dynamics of cycle 1.
As illustrated on Fig. 3(H), the variation of phosphatase in the downstream cycle can also retroactively affects the amount of non-activated proteinY2, provided that cycle 1 is activated and that the quantity Y1T is large enough. This figure also shows that the
variation of Y2 is well approximated by a linear decrease as a function ofE0
1T or, equivalently, ofV 0 1=V1.
When the upstream cycle 2 is activated, Figs. 3(C,E) showed that a variation of control parameters in cycle 1 entailed only minor changes in the fraction of phosphorylated protein in the upstream cycle 2. This result might convey the idea that when cycle 2 is activated no retroactivity can be observed on cycle 2. In reality, this view would be wrong, because in this case there can exist a large decrease of the free active enzymeY
2, as illustrated
on Figs. 3(G,I). Indeed, although the fractionPstayed relatively constant on Figs. 3(C,E), these graphs showed also that the amount of protein 2 sequestrated by cycle 1 increased under a boost of the control parameters Y1T or E
0
1T. In fact, the growth of the
intermediate complex C1 is compensated by a corresponding decrease inY
2, keeping a roughly constant total phosphorylated
fractionP. As before, to get a large variation of Y
2 by making
available more proteinY1T, cycle 1 should be deactivated, leading
to the phenomenon of total sequestration in a range of ½0,Y1c
(Fig. 3(G)). In contrast, if the control parameter is the phosphatase of the downstream cycle, then a retroactive response on cycle 2 is possible if the downstream cycle starts activated, whileY1Tis large
enough (cf. Fig. 3(I)).
Retroactive Signaling in Multi-cycle Pathways
The results obtained with a 2-cycle cascade can predict the effect of retroactivity in short signaling pathways with more than 2 cycles. We first consider a 3-cycle pathway where the activated protein in the cycle at the top of the pathway is an enzyme that activates two other cycles which are not directly linked together (Fig. 4(A)-(B)). In the last section we have demonstrated that a change in the parameters of a downstream cycle, for example the amount of phosphatase or the available protein of the cycle 1, can affect the state of the upstream cycle 2. More precisely, we anticipate that when the phosphatase is increased in cycle 1, it can augment the deactivated form of the proteinY1. The latter then can bind to a greater amount of enzymeY
2, which become less
available for the activation of other substrates such as the protein in cycle 3. Therefore, to implement the scheme of retroactive signaling 1?2?3, we start by assuming that the upstream cycle 2 is activated and we consider a signal having the form of an increase in the phosphatase of the downstream cycle 1. We know from the above results (cf. Fig. 3)(I)) that to create a substantial variation in the upstream cycle 2, the phosphatase signal should
switch the cycle 1 from an activated state to a deactivated state, considering at the same time a relatively large amount of available protein in cycle 1 (cf. Eq.(6)). Then Fig. 3(I) showed that the switching of the downstream cycle caused a complete decrease of the free phosphorylated enzymeY2in the upstream cycle 2. This behavior ofY2 can be considered as an output response of the pathway 1?2 that can be used as the input of the conventional signaling pathway 2?3. Therefore a retroactive signaling in the 3-cycle pathway 1?2?3 shown on Fig. 4 is promoted when there is a strong retroactivity on the segment 2?1, but a weak retroactivity on the segment 2?3 with respect to the considered input. Another condition is that, when the downstream cycle 1 is completely activated (i.e. when the phosphatase signal on cycle 1 is absent), cycle 3 should be activated by cycle 2. In this case only, it will feel the strong decay of the free phosphorylated enzyme in the upstream cycle 2 caused by its sequestration in the compounds of cycle 1. Figure 4(A) illustrates this type of signaling. One sees that cycle 3 can be switched on or off by varying the phosphatase regulating the input cycle 1.
A similar retroactive signaling in the same 3-cycle pathway can be achieved by modifying not the phosphatase but the available protein in the starting cycle 1. Keeping the same parameters as above, Fig. 4(B) shows that increasing the signaling protein 1 from a low value to four times the characteristic range Y1c entails a
deactivation cycle 3. This happens because of the retroactive mechanism between cycles 1 and 2, as discussed in the previous section (cf. Fig. 3)(G)). In the latter case, the increase of the total protein available in the downstream cycle 1 downregulated the activated enzyme in the upstream cycle 2, assuming that the downstream cycle was deactivated. Here again, by combining a large retroactivity between cycles 1 and 2, but a low one between cycle 2 and 3, one achieves a retroactive signaling between cycle 1 and 3.
In some covalent modification cycles, the deactivated protein can serve also as an enzyme for another protein modification [18,20]. For example a variation of the motif shown on Fig. 4(A) is a 3-cycle network consisting of one upstream cycle and 2 downstream cycles activated respectively by the phosphorylated and non-phosphorylated forms of protein in the upstream cycle. Then we checked that a change in the phosphatase of one downstream cycle can produce a transition in the other downstream cycle activated by the non-phosphorylated protein in the upstream cycle (not shown).
To extend the possibility of retroactive signaling to more complex situations than a 3-cycle pathways we now consider a motif of a 5-cycle network in which the activated protein in the top cycle acts as the enzyme regulating two 2-cycle cascades, as shown on Fig. 4(C). Can we produce in this case an example of retroactive signaling from one bottom cycle to the other bottom one, numbered respectively by 1 and 5, initiated for instance by a phosphatase variation in cycle 1? Here, the study of the 2-cycle and the 3-cycle systems reported above can also help to answer this question. In this 5-cycle pathway, the subnetwork formed by cycles 2-3-4 has the same topology than the 3-cycle pathway discussed previously. Therefore, since this latter subsystem is suitable for retroactive signaling, let us consider the subnetwork 2-3-4 with the
Figure 3. Phosphorylated fraction of protein 2 as a function of 2 control parameters of the downstream cycle 1, namelyY1Tand E0
1T.The graphs are obtained by solving Eqs.(16)-(18) with the following parameters :k1=k
0
1~1,K1~K
0
1~K2~K
0
2~0:1mM,Y2T~1mM; On the left
figures (B,D,F,H) cycle 2 is assumed deactivated, withE2T~0:02mM,E0
2T~0:04mM. These values are swapped for the right figures (C,E,G,I) where cycle 2 is assumed activated. Panels (B,C,F,G) : cycle 1 is either deactivated (E0
1T~2mM), or activated (E 0
1T~0:5mM). On panels (D,E,H,I), phosphatase E0
1Tis varied from0to2Y2T(so thatV 0
1=V1~(k0
1E
0
same parameters as considered for the 3-cycle network of Fig. 4(B). Then we can link to this system the cycle 1 downstream to cycle 2, and the cycle 5 downstream to cycle 4. For recall, cycle 2 is deactivated. Now we use the result shown on Fig. 3(H), showing that increasing the phosphatase in cycle 1 is going to reduce the available protein in cycle 2 in such a way that the free activated enzyme in cycle 3 is strongly reduced. This, in turn, deactivates cycle 4, and then cycle 5 as for standard cascades. This example of retroactive signaling scenario is seen on Fig. 4(C) where the increase in the phosphatase in cycle 1 entails not only the
deactivation of cycle 1 (not shown) but also the deactivation of the remote cycle 5. Let us remark that this crosstalk effect can propagate to possible downstream effectors activated by cycle 5.
Discussion
Cell signaling is generally thought in terms of a series of reversible biochemical reactions that are chained together in a feedforward network where extra connections, called feedbacks, could regulate the information flow from bottom-up. In particular
Figure 4. Retroactive signaling in multi-cycle pathways.ki=k0i~1,Ki~Ki0~0:1mM for alli~1to5, except for (A)–(C)K3~0:5mM, and for (D) K4~0:5mM. (A) E0
1T is varied in the range [0,0:5mM] such that V 0
1=V1 goes from 0 to 1. Y1T~10mM, Y2T~0:5mM, Y3T~1mM,
E2T~0:04mM,E0
2T~0:02mM,E
0
3T~0:05mM. (B) same butY1T is varied on the range½0,4Y1candE 0
1T~0:5mM. (C) identical to (A) except that cycle 2 is deactivated, with E2T~0:02mM,E0
2T~0:04mM. (D) Y1T~50mM, Y2T~5mM, Y3T~0:5mM, Y4T~1mM, Y5T~5mM, E 0
2T~0:5mM,
E3T~0:02mM,E0
3T~0:02mM,E
0
4T~0:05mM,E
0
5T~0:8mM.
doi:10.1371/journal.pone.0040806.g004
the expression ‘‘signaling cascade’’ was coined to suggest the idea of an upstream to downstream signal transmission. In the simplest scheme of a cascade of two covalent modification cycles, the input signal typically is a steep increase of the enzyme modifying the first protein. Then the latter acts as the enzyme activating the second protein whose concentration is interpreted as the output of this system. In this paper, however, we show that in such a cascade a retroactive signaling is also possible, i.e. transmitting an input signal from downstream to upstream, and we predict conditions for which this phenomenon can be observed. The input signal is now a variation of a biochemical species that can change the state of the downstream cycle. Two cases are considered, namely a change of the total amount of the downstream signaling protein, or a variation of the phosphatase deactivating the same protein. In both cases we work out characteristic ranges of the concentrations of the species for which a retroactive effect can be observed in the upstream cycle. Moreover we show that this potentiality can help to perform retroactive signaling in short multi-cycle pathways.
A covalent modification cycle is generally described as a two-state entity for which the total level of protein is fixed. However, like all the molecules inside the cell, this signaling protein is subjected to a turnover governed by several processes, including synthesis and degradation [21]. The changes in these processes alters the total level of proteins. For example the degradation of several signaling proteins is actively regulated by proteases, which has consequences on the signaling dynamics [22]. The present study shows that the variation of the total amount of available protein in a downstream signaling cycle can also affect the states of signaling modules upstream in the transduction cascade.
There are several ways to modify the available protein in the downstream cycle in a cascade of covalent modifications. One way is to change the amount of substrates to which the activated protein of the downstream cycle can bind. For example, in a recent study reported in [17], the authors perform experiments on the ERK/MAPK pathway associated with the syncytium state of the Drosophila embryo. They manage to modify the amount of substrates of the doubly phosphorylated form of ERK by constructing mutants missing the corresponding substrates. Another way to alter the available protein in the downstream cycle is to add in the medium a kinase inhibitor that can bind to the activated enzyme at the end stage of the pathway [16,23]. Both ways can be modeled by considering an additional chemical reaction of the form:
Y1zD' a
d
C ð7Þ
where D represents a substrate or a kinase inhibitor of the downstream protein Y
1. Then it can be shown that the set of
stationary state equations of the signaling pathway is affected only in the conservation equation for the total protein Y1T. More
precisely this latter quantity is replaced by Y1T{DTY1= (KDzY1), where 2 additional parameters characterize
respec-tively the total amount DT of binding chemical species and the
dissociation constant KD~d=a. Thus, the effect of varying D is
qualitatively analog to changing the amount of available protein Y1T. In particular, when the affinity ofDfor protein 1 is high (i.e., KD small), the available downstream protein is approximately
reduced by Y1T{DT. Therefore under this hypothesis the
upstream response in a 2-cycle cascade to a variation ofDT can
straightforwardly be inferred from the curves shown on Figs. 3. For instance, from Fig. 3(B) one predicts that in a 2-stage cascade increasingDT can decrease the phosphorylated fractionPof the
upstream protein, especially if the upstream cycle is in a
deactivated state. This phenomenon may be the source of undesirable off-target effects in targeted therapies based on kinase inhibitors [16].
In Ossareh et al, the authors performed mathematical analysis of retroactivity in a signaling cascade with an arbitrary number of stages. They achieved necessary and sufficient conditions for which retroactivity exists in such chains. Their analysis is based on the linearization of the steady state equations in order to predict how a small downstream perturbation is amplified in the upstream response of an arbitrarily long signaling chain. Those results are complementary to the ones presented in the present paper, in the sense that here we consider short signaling pathways but our analysis is based on the resolution of the full nonlinear equations, and not only on the linearized system. So, it is concerned with arbitrarily large perturbations of the parameters. In fact we show that retroactive signaling is meant to work only for a characteristic range of parameter variations that we analytically estimate by working on the asymptotic behaviors of the system for small and large parameter perturbations.
Signaling pathways are regulated by several mechanisms, like positive or negative feedback loops linking the output of the cascades and some upstream stages. This requires the existence of specific chemical interactions between the output protein of the cascade and the upstream proteins that are involved in the feedback loop. Our study shows that the property of retroactive signaling can be another way to regulate the functioning of signaling cascades in branched pathways, without explicit feed-backs. In fact, we can further speculate that in natural signaling pathways with possibly several branches, some of the latter would be sensitive to retroactivity and be devoted to the regulation of the usual branches, where signals go in the top-down direction. These results prompt new experiments concerning signaling cascades and possibly new ways to interpret previous results.
Methods
Our theoretical study is performed in the framework of coupled nonlinear equations describing the rate of changes of protein concentrations in signaling cascades formed of covalent modifica-tion cycles. The model equamodifica-tions are deterministic and based on the law of mass action. Only stationary states of these equations are analysed and thus the mathematical method amounts to solving sets of algebraic nonlinear equations. Thus the issue of how the biochemical species reach the equilibrium is not discussed here, as it has been addressed in some previous studies [8,9,24]. In this respect our analysis is independent of questions related to possible time-scale differences between the kinetics of enzyme/ substrate. For example, the usual quasi-steady state approxima-tions are not to be considered since all the variables are at equilibrium.
Steady States in Basic Models of Signaling Cascades
Let us introduce the notations used for writing the equations in the case of the simple 2-cycle cascade as depicted on Fig. 1(A). Assuming that this system is isolated from other biochemical reactions, the chemical equations describing the transformations of these species can be written as follows:
Y2zE2 ' a2
d 2
C2 ? k
2 Y
2zE2
Y
2zE
0 2 ' a0 2 d0 2 C0 2 ? k0 2 Y 2zE
0
2,
Y1zY
2 '
a1
d1
C1 ?k1 Y
1zY
2
Y
1zE
0 1 ' a0 1 d0 1 C0 1 ? k0 1 Y 1zE
0
1, ð8Þ
whereEiandE 0
i denote enzyme concentrations, whereasCiand C0i (i~1,2) are intermediate enzyme-substrate complexes. These chemical equations readily generalize to the other motifs, e.g. the one shown on Fig. 1(B). The kinetic equations of the state variables of the cascades are written using the law of mass actions.
dY
2
dt ~k2C2{a 0
2Y
2E
0
2zd
0
2C
0
2{a1Y1Y2z(d1zk1)C1 ð9Þ
dC2
dt ~a2Y2E2{(k2zd2)C2
dC0
2
dt ~a2Y
2E
0
2{(k
0
2zd
0
2)C
0
2
dY
1
dt ~k1C1{a 0
1Y1E
0
1zd
0
1C
0
1 ð10Þ
dC1
dt ~a1Y1Y
2{(k1zd1)C1
dC0
1
dt ~a1Y
1E
0
1{(k
0
1zd
0
1)C
0
1
with the conservation laws for the total proteins YiT and total
enzyme concentrationsEiT,E 0 iT:
Y2T~Y2zY2zC1zC2zC
0
2 ð11Þ
Y1T~Y1zY1zC1zC
0
1 ð12Þ
E2T~E2zC2
E20T~E20zC02
E0
1T~E 0
1zC
0
1
Since we focus only on the stationary states of the system, the time-derivatives of the concentrations can be equaled to zero. This enables to express the variablesCiandC
0
i (i~1,2) in terms of the
protein concentrations as follows:
C2~E2T Y2
K2zY2
C02~E02T Y
2
K0
2zY2
C1~
Y1Y2
K1 ð13Þ
C0
1~E
0
1T Y
1
K0
1zY1
ð14Þ
with the coefficientsKi~(kizdi)=ai(i~1,2) defined as a function
of he kinetic parameterski,ai,di. One thus recognizes the usual
Michaelis-Menten form for the substrate-enzyme complexes. The substitution of these expressions in Eqs.(9)–(10) and in the conservation laws given Eqs.(11)–(12) leads finally to 4 algebraic equations in the unknownsY2,Y2,Y1,Y1. Therefore a reduced set of equations (9–14) can be written as:
0~k2E2T Y2
K2zY2{k 0 2E 0 2T Y 2 K0
2zY2
ð15Þ
0~Y2zY2(1z
Y1
K1)zE2T Y2
K2zY2zE 0
2T Y2
K0
2zY2
{Y2T ð16Þ
0~k1Y1Y
2
K1 {k 0 1E 0 1T Y 1 K0
1zY1
ð17Þ
0~Y
1zY1z
Y1Y
2
K1 zE 0
1T Y
1
K0
1zY1
{Y1T ð18Þ
We denote the latter as follows:
V2~k2E2T, V 0
2~k
0
2E
0
2T, V1~k1Y2T, V 0
1~k
0
1E
0
1T ð19Þ
The upper bound of the velocity V1, which describes the activation ofY1, will depend on the total protein in cycle 2. In the following section we will seek the conditions under which the variations of parameters of cycle 1 produce a significant effect in cycle 2 due to retroactivity. As will be discussed, this property will depend on the states of the variables of both, upstream and downstream cycles. We will use the following terminology: cycle i (i~1,2)is said to beactivatedifY
iwYi. Otherwise, it is said to
bedeactivated. This property is easily related to the ratioVi=V 0 i in
the symmetric caseKi~K 0
i. Then cycleiis activated if and only if ViwVi0 [5].
The following sections give details on the derivation of equations (1)–(3) and (5) used in the section Results.
Variation of the Total Downstream Protein in a 2-cycle Cascade
Let us consider a 2-cycle cascade as drawn on Fig. 2(A), with total upstream protein Y2T, total downstream protein Y1T, and
total deactivating enzyme E20T and E10T, respectively for the upstream and downstream cycles. We wish to determine a suitable value of Y1T that can be used as a characteristic dose of
downstream protein inducing a retroactive effect on the upstream cycle. The steady state of this system is given by the solution of Eqs.(15)–(18). As motivated above, we focus on the behavior ofC1, i.e. the intermediate substrate-kinase complex, which at
equilib-rium is given by C1~Y2T Y1
K1zY1. The change of C1 as a function of the total proteinY1T is illustrated on Fig. 2(B)–(C) in
the case whereE0
2T~0, but the behavior is the same ifE 0 2T=0. It
can be sketched by an increase ofC1proportional toY1Tfollowed
by a saturation to a constant value, that isC1~Y2T when cycle 1
is deactivated (i.e.Y1wY1). Therefore the quantity
YE 0
2T 1c ~
1 Y2T
dC1
dY1T (0)
{1
ð20Þ
defines a proper characteristic range of Y1T for the variation of
C1. The upper index ofYE 0
2T
1c reminds that the result of the
right-hand side of this equality depends on the value of E0
2T. In
particular, we will be interested to the case E0
2T~0 which
corresponds to the situation of the isolated signaling cycle 1 with kinaseY2T and with phosphataseE
0
1T. To simplify the notations,
we will denote in the following:
Y1c~Y E0
2T~0
1c ð21Þ
and we will show that Eq.(1) holds with this definition. Since C1~Y2TY1=(K1zY1), one deduces that
dC1
dY1T (0)~
Y2T
K1 dY1
dY1T
(0) ð22Þ
Now, it suffices to compute the derivative of Y1 w.r.t. Y1T and
evaluate it at Y1T~0. This can be analytically performed by
differenciating each equation of the system (15)–(18) with respect toY1T. This calculation provides a system of linear equations in
the coupled variables ( dY2 dY1T
(0), dY
2
dY1T
(0), dY1 dY1T
(0),dY
1
dY1T (0)).
Solving this linear system we find that the solution can be written as:
dY2
dY1T
(0)~{ 1=
k1
1=k1z1=k0
1zK1=(k1Y2)zK
0
1=V
0
1 g
1zg
ð23Þ
dY
2
dY1T
(0)~{ 1=
k1
1=k1z1=k0
1zK1=(k1Y2)zK
0
1=V
0
1
1 1zg
ð24Þ
dY1
dY1T (0)~
K1=(k1Y2)
1=k1z1=k0
1zK1=(k1Y2)zK
0
1=V
0
1
ð25Þ
dY
1
dY1T (0)~
K0
1=V
0
1
1=k1z1=k0
1zK1=(k1Y2)zK
0
1=V
0
1
ð26Þ
whereY
2 is the activated upstream enzyme when Y1T~0, and
g~
V0
2=K
0
2
V2=K2. Let us remark thatg%1org&1means respectively that the upstream cycle is highly activated or strongly deactivated. By combining Eqs.(20), (22) and (25), one obtains the characteristic range forY1T, as defined by Eq.(20):
YE 0
2T 1c ~
1 k1z
1 k0
1 z
K1
k1Y
2 z K0 1 V0 1 !
k1Y
2 ð27Þ
In the case whereE0
2T~0, the upstream cycle is such that there is
no phosphatase to deactivate it, so thatY2~0andY
2~Y2T. In
this case, using the definitionV1~k1Y2T, Eq.(27) becomes the
sought relation Eq.(1), i.e.:
Y1c~ 1 k1z
1 k0
1 z
K1
V1z K0
1
V0
1 !
V1 ð28Þ
One easily shows thatY1cwY E0
2T
1c (becauseY2TwY2). Therefore Y1ccan be used as an upper bound of the characteristic range for Y1T. Particularly, if the downstream cycle is strongly activated,
then Y2^Y2T and then Y1c is an excellent approximation of
YE 0
2T
1c . On the other hand, if the downstream cycle is strongly
deactivated, so thatY2%Y2T, one can useY E0
2T
1c ~K1, that is the
lower value reached byYE 0
2T
1c in the limitY2~0.
Let us note that using the definition of Y1c in the simple
situationE0
2T, the derivatives dY1
dY1T
(0)and dY
1
dY1T
(0)in eqs.(25)–
(26) can be written in a compact form, namely:
dY1
dY1T (0)~
K1
Y1c
, dY
1
dY1T (0)~
V1
V0
1
K10
Y1c
Incidently, these expressions give the initial slope of the curves drawn on Figs. 2(D-E).
Now, to justify Eqs.(2)–(3) given in the Results, we wish to compute the asymptotic values of(Y1,Y
1,Y2,Y2) in the limit of
largeY1T. As suggested by the numerical computations, we first
suppose that the asymptotic behavior of these variables are described by:
Y1~Y1T{A ð30Þ
Y
1~B ð31Þ
Y2~C=Y1T ð32Þ
Y
2~D=Y1T ð33Þ
where (A,B,C,D) are unknown constants to be worked out. Substitution of these relations in Eqs.(15)–(18) with Y1T??
determines B~K0
1=(V
0
1=V1{1). Since B must be positive, this
case is only consistent with the hypothesis V1vV0
1, that is
equivalent to Eq. (2) given in the Result section. Let us notice that here the result is independent on considering the caseE10T~0or not. The values of the other unknowns are found to be C~gK1Y2T,D~K1Y2T, and
A~BzV1( 1 k1z
1 k0
1
) ð34Þ
Secondly, in order to justify Eq.(3), we suppose another asymptotic behavior for the system variables in the limit of largeY1T:
Y1~B0 ð35Þ
Y1~Y1T{A 0
ð36Þ
Y2~C0 ð37Þ
Y2~D0 ð38Þ
where (A0,B0,C0,D0) are new unknown constants to be deter-mined. The calculation can be done in 2 steps. First(C0,D0)can be calculated by solving Eqs.(15)–(16) which here becomes:
0~k2E2T C0
K2zC0{ k0
2E
0
2T D0
K0
2zD
0
Y2T{ k0
1
k1E 0
1T~C 0
zD0zE2T C0
K2zC0zE 0
2T D0
K0
2zD
0
This system can be interpreted as finding the activated and deactivated proteins in the upstream cycle with the reduced
amount of total proteinY2T{ k0
1
k1E 0
1T. The latter must be positive,
that is equivalent to the conditionV1wV0
1related to Eq.(3). The
solution of this system is hard to write explicitly, except in the case
E02T~0whereC0~0andD0~Y2T{ k01
k1E 0
1T.
The second step is to solve Eqs.(17)–(18) in the limitY1T??.
Then one easily finds thatB0~K1k0
1E 0 1T=(k1D
0
), and therefore
Y1=K1~V10=(k1D0) ð39Þ
where D0 has been found in the first step. The latter equation generalizes Eq. (3), which holds in the case whereE0
2T~0. Then
the simple expression of D0 leads to the equality B0~K1=(V1=V0
1{1)which is Eq. (3). Finally the value of A
0 is the same expression as Eq.(34), but swapping the ‘‘primed’’ and ‘‘not primed’’ parameters.
In conclusion, by using Eqs.(29)–(38), let us note that we can sketch the behavior of Y1 and of Y1 as a function of Y1T as
piecewise linear graphs (see red lines on Figs. 2(D)–(E)).
Variation of the Downstream Phosphatase in a 2-cycle Cascade
Let us consider a 2-cycle cascade as drawn on Fig. 1(A) and suppose now that the control parameter is the quantity of phosphataseE0
1T in the downstream cycle 1. We wish to prove the
result of Eq.(5) giving the phosphorylated fractionPof protein in cycle 2 in the limit of largeE01T.
First recall that P is defined by the chemical compounds containingY
2, namely (cf. Eq.(4)):
P~
Y2zC20zC1
Y2T
Thus, by using the steady expression for the complexesC1andC0
2,
Pis also expressed as:
P~
Y2
Y2T 1z
Y1
K1z E02T
K0
2zY2 !
ð40Þ
We wish to remove the dependency inY1of this expression. The steady state equations of cycle 1 can be written as follows:
0~{Y1TzY1zY1z
Y1Y2
K1 zE 0
1T Y1
K0
1zY1
ð41Þ
0~k1Y1Y
2
K1 {k 0
1E
0
1T Y
1
K0
1zY1
Since E0
1T is an enzyme, in the limit E 0
1T??, none of the
biochemical variables should diverge. Therefore the second equation in the above system implies that in this limit one has Y
1?0. Thus the Eq.(41) can be simplified into the form:
Y1T~Y1z
Y1Y2
K1 1z k1
k0
1 !
ð42Þ
This enables to writeY1=K1as:
Y1
K1~
Y1T
K1zY
2(1zk1=k01)
ð43Þ
And by using this expression in Eq.(40), one finds Eq.(5), or:
Pmax~ Y
2
Y2T 1z
Y1T
K1zY
2(1zk1=k
0
1) z
E0
2T K0
2zY2 !
ð44Þ
Author Contributions
Conceived and designed the experiments: JAS ACV. Performed the experiments: JAS ACV. Analyzed the data: JAS ACV. Wrote the paper: JAS SDM ACV.
References
1. Nelson D, Cox M (2004) Lehninger Principles of Biochemistry, Fourth Edition. W. H. Freeman, 1100 pp.
2. Seger R, Krebs EG (1995) The mapk signaling cascade. FASEB J 9: 726–35. 3. Huang CY, Ferrell JE (1996) Ultrasensitivity in the mitogen-activated protein
kinase cascade. Proc Natl Acad Sci U S A 93: 10078–83.
4. Elion EA, Qi M, Chen W (2005) Signal transduction. signaling specificity in yeast. Science 307: 687–8.
5. Goldbeter A, Koshland JDE (1981) An amplified sensitivity arising from covalent modification in biological systems. Proc Natl Acad Sci U S A 78: 6840– 4.
6. Qiao L, Nachbar RB, Kevrekidis IG, Shvartsman SY (2007) Bistability and oscillations in the huang-ferrell model of mapk signaling. PLoS Comput Biol 3: 1819–26.
7. Feliu E, Knusden M, Andersen L, Wiuf C (2012) An algebraic approach to signaling cascades with n layers. Bull Math Biol 74: 45–72.
8. Ventura AC, Sepulchre JA, Merajver SD (2008) A hidden feedback in signaling cascades is revealed. PLoS Comput Biol 4: e1000041.
9. Del Vecchio D, Ninfa AJ, Sontag ED (2008) Modular cell biology: retroactivity and insulation. Mol Syst Biol 4: 161.
10. Ossareh HR, Ventura AC, Merajver SD, Del Vecchio D (2011) Long signaling cascades tend to attenuate retroactivity. Biophys J 100: 1617–26.
11. Andrianantoandro E, Basu S, Karig DK, Weiss R (2006) Synthetic biology: new engineering rules for an emerging discipline. Mol Syst Biol 2: 2006 0028. 12. Franco E, Del Vecchio D, Murray R (2009) Design of insulating devices for in
vitro synthetic circuits. In: Proceedings of the IEEE Conference on Decision and Control, Shangai. 4584–4589.
13. Anderson J, Chang Y, Papachristodoulou A (2011) Model decomposition and reduction tools for large-scale networks in systems biology. Automatica 47: 1165–1174.
14. Hartwell LH, Hopfield JJ, Leibler S, Murray AW (1999) From molecular to modular cell biology. Nature 402: C47–52.
15. Alexander RP, Kim PM, Emonet T, Gerstein MB (2009) Understanding modularity in molecular networks requires dynamics. Sci Signal 2: pe44. 16. Wynn M, Ventura A, Sepulchre JA, Garca H, Merajver S (2011) Kinase
inhibitors can produce off-target effects and activate linked pathways by retroactivity. BMC Systems Biology 5: 156.
17. Kim Y, Paroush Z, Nairz K, Hafen E, Jimenez G, et al. (2011) Substrate-dependent control of mapk phosphorylation in vivo. Mol Syst Biol 7: 467. 18. Ventura AC, Jiang P, Van Wassenhove L, Del Vecchio D, Merajver SD, et al.
(2010) Signaling properties of a covalent modification cycle are altered by a downstream target. Proc Natl Acad Sci U S A 107: 10032–7.
19. Kim Y, Coppey M, Grossman R, Ajuria L, Jimenez G, et al. (2010) Mapk substrate competition integrates patterning signals in the drosophila embryo. Curr Biol 20: 446–51.
20. Goldbeter A (1991) A minimal cascade model for the mitotic oscillator involving cyclin and cdc2 kinase. Proc Natl Acad Sci U S A 88: 9107–11.
21. Callis J, Vierstra RD (2000) Protein degradation in signaling. Curr Opin Plant Biol 3: 381–6.
22. Soyer OS, Kuwahara H, Csikasz-Nagy A (2009) Regulating the total level of a signaling protein can vary its dynamics in a range from switch like ultrasensitivity to adaptive responses. FEBS J 276: 3290–8.
23. Kumar N, Afeyan R, Kim HD, Lauffenburger DA (2008) Multipathway model enables prediction of kinase inhibitor cross-talk effects on migration of her2-overexpressing mammary epithelial cells. Mol Pharmacol 73: 1668–78. 24. Jiang P, Ventura AC, Sontag ED, Merajver SD, Ninfa AJ, et al. (2011)
Load-induced modulation of signal transduction networks. Sci Signal 4.