Exercise Tolerance in Rats with Aortic Stenosis and Ventricular
Diastolic and/or Systolic Dysfunction
Olga Castro Mendes
1,2, Mario Mateus Sugizaki
1,3, Dijon Salomé Campos
1, Ricardo Luiz Damatto
1, André Soares
Leopoldo
1,4, Ana Paula Lima-Leopoldo
1,4, Vilmar Baldissera
5, Carlos Roberto Padovani
1, Katashi Okoshi
1, Antonio
Carlos Cicogna
1Departamento de Clínica Médica - Faculdade de Medicina - Universidade Estadual Paulista (UNESP) “Júlio de Mesquita Filho”1, Botucatu; Faculdades Integradas de Bauru2, Bauru, SP; Instituto de Ciências da Saúde - Universidade Federal de Mato Grosso (UFMT)3, Sinop, MT; Departamento de Desportos - Centro de Educação Física e Desportos - Universidade Federal do Espírito Santo (UFES)4, Vitória, ES; Laboratório de Fisiologia do Exercício - Universidade Federal de São Carlos (UFSCar)5, São Carlos, SP, Brazil
Mailing Address: Mario Mateus Sugizaki •
Av. Alexandre Ferronato, 1200 - Setor Industrial - Postal Code 78550-000 – Sinop, MT, Brazil
E-mail: mario.ufmt@gmail.com, mario.sugizaki@ig.com.br
Manuscript received April 25, 2012, revised manuscript July 04, 2012, acepted July 31, 2012.
Abstract
Background: Physical stress tolerance (ST) is a measurement of cardiorespiratory fitness. Aerobic capacity is reduced in heart failure (HF) although there is no data available on this parameter in animals with ventricular dysfunction and no signs of HF.
Objective:Evaluate ST in rats with ventricular diastolic dysfunction isolated or associated with systolic dysfunction induced by ascending aortic stenosis (AoS).
Methods: Young male Wistar rats (20-30 days old), divided in: control group (CG, n=11) and AoSG group, (n=12). Animals were assessed at 6 and 18 weeks after AoS surgery. Treadmill exercise test was until exhaustion and evaluated treadmill speed and lactate concentration [LAC] at lactate threshold, treadmill speed and [LAC] at exhaustion, and total testing time.
Results: Echocardiography data revealed remodeling of the left atrium and left ventricular concentric hypertrophy at 6 and 18 weeks. Endocardial fractional shortening was greater in AoSG than CG at 6 and 18 weeks. Midwall fractional shortening was greater in AoSG than in CG only 6 week. Cardiac index was similar in CG and AoSG at 6 and 18 weeks and decreased between from 6 to 18 weeks in both groups. The E wave to A wave ratio was greater in CG than in AoSG at both periods and did not change in both groups between week 6 and 18. Treadmill stress testing parameters were similar in both groups at 6 or 18 weeks.
Conclusion: Although AoS promotes isolated diastolic dysfunction or associated with systolic dysfunction at 6 or 18 weeks, it is not sufficient to modify physical stress tolerance. (Arq Bras Cardiol. 2013;100(1):44-51)
Keywords: Mice; Exercise; Aortic Valve Stenosis; Ventricular Dysfunction.
the model of ascending aortic stenosis (AoS) has been used to promote the gradual development of left ventricular hypertrophy in rats7-9.In this model, animals develop cardiac
remodeling that is associated, in the short term, with diastolic dysfunction and improved systolic function followed by depressed systolic performance and heart failure10,11.
The physical stress test (ST), one of the most commonly used noninvasive methods for the evaluation of cardiovascular disease, can detect heart function abnormalities not observable at rest12,13. Tolerance to ST, a normative measurement of
cardiorespiratory fitness and aerobic capacity, is the ability to perform dynamic activities during physical stress. This ability is commonly reduced in patients and animals with heart failure (HF)14,15. However, information on patients and animals with
ventricular dysfunction and no signs of HF was not found in the literature.
The purpose of this study was to test the hypothesis that tolerance to physical stress is impaired in the presence of ventricular diastolic dysfunction isolated or associated with systolic dysfunction and no heart failure induced by aortic stenosis.
Introduction
The term cardiac remodeling (CR) has been widely used and can be defined as a modification in genome expression resulting in molecular, cellular and interstitial changes that clinically manifest as changes in size, shape and function of the heart following aggression1.
CR is an important adaptive mechanism to chronic hemodynamic load that allows the heart to maintain its basic functions in response to increased load2, but it is also a
considerable risk factor for ventricular dysfunction and heart failure3.
Methods
All experiments and procedures were performed in agreement with Guide for the Care and Use of Laboratory Animals published by the National Research Council (1996) and were approved by the Animal Ethics Committee of the Botucatu Medical School, UNESP — Universidade Estadual Júlio Mesquita Filho on 10/19/2005 (protocol number 506/2005).
Animal
Twenty-three young male Wistar rats were randomly distributed in two groups: control (CG, n=11) and ascending aortic stenosis (AoSG, n=12). In AoSG, aortic stenosis was induced by placing a silver band on the aorta. CG underwent the same surgery without band placement. All animals were housed in individual cages in a room maintained at 23°C on a 12:12-h light-dark cycle and fed standard Purina® rat chow
and water ad libitum.
Ascending aortic stenosis induction
Cardiac remodeling was induced by AoS according to the method used by several authors5,7,9. The animals, weighing
70-90 g, 20-30 days old, underwent median thoracotomy under anesthesia with intraperitoneal ketamine hydrochloride (60 mg/kg) and xylidine hydrochloride (10 mg / kg). The ascending aorta was dissected and a 0.6-mm internal diameter silver band was placed at approximately 3 mm of the aortic root. CG animals underwent the same surgery, but without band placement.
According to previous studies, animals start to develop ventricular diastolic dysfunction isolated or associated with systolic dysfunction at 6 and 18 weeks after surgery, respectively5,7,9. Thus, all animals were assessed at these time
points: 6 weeks (diastolic dysfunction) and 18 weeks (diastolic dysfunction associated with systolic).
Echocardiography assessment
LV diastolic and systolic functions as well as heart structure were assessed by ECHO according to the method used in our laboratory7,16. The animals were anesthetized
with intraperitoneal ketamine hydrochloride (50 mg/kg) and xylidine hydrochloride (1 mg/kg) for examination with a M-Mode echocardiograph (Philips, model HDI 5000) equipped with a 12-MHz electronic transducer to measure the left atrium diameter (LA) and the following left ventricular parameters: diastolic and systolic diameter (LVDD and LVSD, respectively), diastolic and systolic posterior wall thickness (LVDWT and LVSWT, respectively), diastolic and systolic interventricular septal thickness (IVSDT and IVSST), and left ventricle mass (LV MASS). The left ventricular mass index (LVMI) was determined by normalizing LV mass for body weight (BW). LV wall relative thickness (LVWRT) was estimated dividing LVDWT by LVDD.
The LV systolic function was determined by the percent of endocardial shortening (ΔD endo) and the midwall fractional shortening (ΔD mid), and cardiac index (CI). The ΔD mid
was calculated using the formula ({[(LVDD + ½ PWDT + ½ IVSDT) – (LVSD + ½ PWST + ½ IVSST)]/(LVDD + ½ PWDT + ½ IVSDT )}). The ΔD endo was calculated by the formula ([(LVDD – LVSD)/LV DD x 100].
The diastolic function was assessed by E-waves and A, ratio between E-waves and A-wave (E/A).
Assessment of physical stress tolerance
Physical stress testing
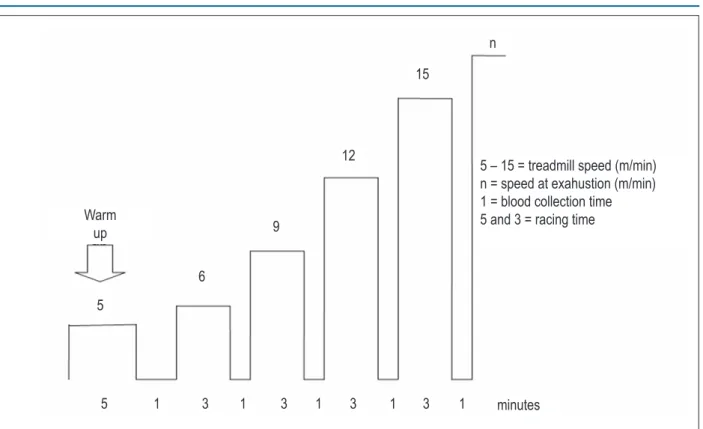
Stress testing was performed using a rodent treadmill constructed by the Technological Center of Clinical Engineering - Universidade Estadual Júlio Mesquita Filho UNESP/Botucatu, São Paulo, Brazil. The protocol used for multistage interval testing was adapted from that previously described by Carvalho et al17. Each animal was tested individually. The test
consisted of an initial 5-min warm up at 5m/min. After 1 min of passive recuperation, the animal was submitted to interval exercise at a speed of 6m/min followed by 3m/min increases in speed every 3 minutes until exhaustion. Exhaustion was determined when the animal refused to run even after sound stimulation or was unable to coordinate steps. After each load increase, the animal was manually taken out of the treadmill for 1 min for blood collection18.
Experimental Protocol
A schematic representation of the test protocol is shown in Figure 1. All rats underwent a period of adaptation to become familiarized with the experiment protocol by daily walking 5 minutes at 5 m/min for one week before testing. Physical stress testing was performed 6 and 18 weeks after surgery in CG and AoSG, that is, by the diastolic dysfunction isolated or associated with systolic dysfunction, respectively.
Parameters assessed
Treadmill speed (SLT, m/min) and lactate concentration ([LAC]LT, mmol/L) at lactate threshold
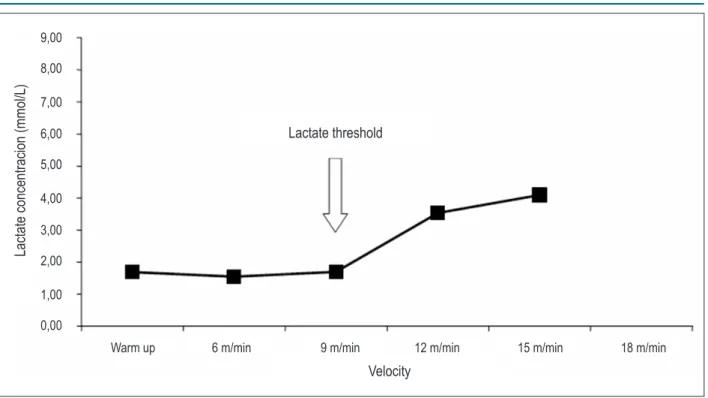
For the assessment of SLT and [LAC]LT, it was necessary to determine lactate threshold (LT), defined as the exercise intensity at which lactate concentration starts to substantially increase in the bloodstream during incremental exercise19.
of the Department of Physiological Sciences – Universidade Federal São Carlos, São Paulo, Brazil. The device was calibrated according to the instructions of the manufacturer. Lactate concentrations were plotted against stage speed. LT was considered as the point where lactate levels started to rise as a function of speed as detected by visual inspection. The speed and lactate concentration found at this point were considered as speed and lactate concentration at lactate threshold (SLT and [LAC]LT, respectively). The graphs were analyzed by two experienced investigators with an inter-observer agreement of 96 %. When disagreement regarding LT occurred, the mean of the values indicated by each observer was used. The graph plotting results for one of the animals are shown in Figure 2.
Treadmill speed (SEx, m/min) and lactate concentration ([LAC]EX, mmol/L) at exhaustion
These parameters were determined as described above, but at exhaustion.
Total testing time (TTT, sec)
TTT was the sum of all stage times up to exhaustion. Intervals between stages were not taken into consideration.
Body and heart morphological characteristics
By the end of the experiment, the animals were anesthetized with intraperitoneal sodium pentobarbital (50 mg/kg) and decapitated. The following variables were
assessed: final body weight (BW), LV weight, RV weight, atrial (left + right) weight (A), LV/BW, RV/BW, A/BW. Fragments of liver (LIVERw/d) and lung (LUNGw/d)were weighed before and after they were placed in an oven at 60°C for 48 h to obtain the wet-to-dry ratio.
Statistical Analysis
Results are reported as position and variability measurements according to data distribution. Morphological parameters were analyzed using the Student’s t-test, when the variable has shown adherence to the normal probability distribution, and using the Mann-Whitney test, when this characteristic was absent. Comparisons between groups were performed using two-way repeated measures ANOVA with one-factor repetition followed by Bonferroni’s multiple comparison procedure. For non-parametric parameters, Anova on ranks and Friedman test was used. Significance level for all tests was set at 5% (p<0.05). Statistical calculations were performed using SigmaStat 3.5 for Windows version (Copyright© 2006, Systat Software Inc.).
Results
Table 1 summarizes morphological data. Body weight was similar in control group (CG) e ascending aortic stenosis group (AoSG). The LV/body weight, RV/body weight and A/body weight were increased in AoSG in relation of CG. There was no difference in LIVERw/d and LUNGw/d fragments.
Table 2 shows serial echocardiographic data of structural and functional parameters at 6 and 18 weeks in CG and Figure 1 - A schematic representation of the test protocol.
minutes
5
5
3
3
3
3
Warm
up
5 – 15 = treadmill speed (m/min)
n = speed at exahustion (m/min)
1 = blood collection time
5 and 3 = racing time
1
1
1
1
1
6
9
12
15
AoSG. Left ventricular mass index decreased between week 6 and week 18 in CG and remained unchanged in AoSG; this parameter was higher in AoSG than CG at 6 and 18 weeks. Left ventricular wall relative thickness did not change in CG, but increased between week 6 and week 18 in AoSG; this variable was higher in AoSG than in CG at 6 and 18 weeks. LA/BW decreased in both groups at week 18 when compared to week 6; it was higher in AoSG than in CG at both evaluated times. Endocardial (ΔD endo) and midwall (ΔD mid) fractional shortening did not change with time in CG, but both decreased between 6 and 18 weeks in the AoSG; ΔD endo was higher in AoSG than in CG at 6 and 18 weeks; ΔD mid was higher in AoSG than in CG at week 6 and similar in both groups at week 18. Cardiac index decreased in both groups between 6 and 18 weeks; it was similar between both groups in the
two evaluated times. E/A was similar in both groups between weeks 6 and 18; however, it was higher in CG than in AoSG in both moments.
Table 3 shows the results of physical stress tolerance assessment. There was no significant difference in speed at exhaustion, total testing time, speed at lactate threshold, lactate concentrations at SLT and at SEx between 6 and 18 weeks in both groups. These parameters were similar between CG and AoSG in both moments.
Discussion
The aortic stenosis employed in this study promoted early left atrium and ventricular hypertrophy, which persisted up to the end of the experiment. It was observed by atrial Figure 2 - Lactate concentrations as a function of the stage speed of one animal with aortic stenosis. The point where lactate levels started to rise was indicated (lactate threshold).
Lactate concentracion (mmol/L)
Lactate threshold
Warm up 6 m/min
Velocity
9 m/min 12 m/min 15 m/min 18 m/min
9,00
8,00
7,00
6,00
5,00
4,00
3,00
2,00
1,00
0,00
Table 1 - Morphological data
CG (n=11) AoSG (n=12)
BW, g 492 ± 69 453 ± 52
LV/BW, mg/g 1,76 ± 0,11 2,69 ± 0,47*
RV/BW, mg/g 0,60 ± 0,09 0,73 ± 0,15*
A/BW, mg/g 0,20 ± 0,03 0,39 ± 0,13*
LIVERw/d
† 3,14 ± 0,72 3,23 ± 0,44
LUNGw/d 4,50 ± 0,21 4,47 ± 0,09
Values are means ± SD; CG : control group; AoSG : ascending aortic stenosis group; BW : final body weight; LV : left ventricle weight; RV : right ventricle
weight; A : atrial weight (left + right); n : number of rats; w/d : wet-to-dry weight ratio. Student’s t-test; (†) median ± half-amplitude, Mann-Whitney U test; *
Table 2 - Echocardiographic data
Groups PERIOD OF ASSESSMENT
6 weeks 18 weeks
HR, beats/min CG
311 ± 34 327 ± 66
AoSG 327 ± 46 345 ± 48
LVMI, g/kg CG 2.62 ± 0.36 2.14 ± 0.32#
AoSG 3.29 ± 0.66* 3,01 ± 0,96*
LVWRT CG
0.17 ± 0.01 0.19 ± 0.02
AoSG 0.23 ± 0.04* 0.28 ± 0.06#*
LA/BW, mm/kg CG 16.95 ± 2.29 11.83 ± 2.65#
AoSG 20.40 ± 2.92* 14.43 ± 2.95*#
∆D endo, % CG 48.20 ± 4.17 50.35 ± 3.00
AoSG 61.05 ± 5.04* 55.65 ± 9.20*#
∆D mid, % CG 29.71 ± 3.51 31.41 ± 2.35
AoSG 37.07 ± 2.64* 31.60 ± 4.75#
CI, ml/min.g-1 CG
0.47 ± 0.09 0.38 ± 0.07#
AoSG 0.45 ± 0.11 0.33 ± 0.09#
E/A CG 1.76 ± 0.16 1.43 ± 0.36
AoSG 1.32 ± 0.30* 1.09 ± 0.54*
Values are means ± SD; CG : control group (n = 11); AoSG : ascending aortic stenosis group (n = 12); D : diastolic dysfunction; S : systolic dysfunction; HR : heart
rate; LVMI : mass index left ventricle; LVWRT : wall relative thickness; LA : left atrium; ∆D endo and mid : endocardial and midwall fractional shortening; CI : cardiac
index; E : peak velocity of early ventricular illing; A : peak velocity of transmitral low during atrial contraction. *:AoSG vs. CG; #: 18 vs. 6 weeks; two-factor ANOVA
for repeated measures followed by Bonferroni’s test, p < 0.05.
Table 3 — Physical stress tolerance
PERIOD OF ASSESSMENT
6 weeks 18 weeks
SEx†, m/min CG 15,0 ± 3,0 15,0 ± 3,0
AoSG 15,0 ± 1,5 15,0 ± 4,5
TTT, sec
CG 680 ± 151 694 ± 132
AoSG 580 ± 107 609 ± 116
SLT†, m/min CG 9,0 ± 4,5 12,0 ± 4,5
AoSG 9,0 ± 3,0 9,0 ± 4,5
[LAC]LT, mmol/L
CG 1,59 ± 0,34 1,71 ± 0,44
AoSG 1,43 ± 0,38 1,50 ± 0,37
[LAC]EX, mmol/L
CG 3,74 ± 1,63 3,70 ± 1,37
AoSG 4,27 ± 1,51 3,89 ± 1,56
Values are means ± SD; CG : control group (n = 11); AoSG : ascending aortic stenosis group (n = 12); D : diastolic dysfunction; S : systolic dysfunction; Sex : speed of
exhaustion; TTT : time total test; SLT : speed of lactate threshold; [LAC]Lt - concentration of lactate on lactate threshold; [LAC]EX: concentration of lactate on exhaustion.
Two-factor ANOVA for repeated measures followed by Bonferroni’s test, p<0.05; † median ± half-amplitude, repeated measures analysis of variance (ANOVA) on ranks
followed by Friedman test.
and ventricular mass at morphologic and echocardiography analysis. The increase of left ventricle wall relative thickness in stenosis group indicates concentric hypertrophy. The data are in agreement with previous studies that showed cardiac
remodeling in this experimental model5,9,11,20. Remodeling of
No clinical or morphological signs of heart failure, i.e. tachypnea associated with edema, ascites, pleuropericardial effusion, LA thrombus or RV hypertrophy were observed. The isolated finding of an increase in RV/BW ratio does not indicate that AoSG rats developed heart failure; this was confirmed by the fact that LIVERw/d and LUNGw/d were similar in control and AoS groups.
LV systolic function, as assessed by ΔD endo and ΔD mid, was increased in AoSG when compared with CG at week 6, and deteriorated during remodeling in the AoSG (Table 2). The ΔD endo observed at week 6 was similar to that reported by Bregagnollo et al7,22, Ribeiro et al11 and Litwin et al9 who
found an improved systolic function at this time. Furthermore, these authors also observed worsening after 18 or 21 weeks. The improved systolic function seen in AoSG, in comparison with CG at week 6 might be related to the development of concentric hypertrophy, wall systolic tension normalization, and maintenance of myocardial fiber oxygen consumption within its physiological range9. The progressive loss of systolic function
may be related with adverse remodeling of ventricular geometry, changes in myocardial composition, progressive contractility impairment or with all those factors combined22-24.
Differently from systolic function, diastolic performance deteriorated early in AoSG in comparison with CG. At week 6, there was a reduction in E/A ratio which remained observable at week 18. AoSG E/A ratio, which was smaller than in CG, suggests the presence of diastolic dysfunction. Our results differ from author9 that observed no changes in E/A ratio 6 weeks after
AoS induction in rats and investigators who found an increase in E/A 12, 18 or 21 weeks after AoS induction7,9,22. Conflicting
results may occur due to the different levels of left ventricular hypertrophy or technical difficulties in obtaining images adequate for the analysis of the Doppler effect; the high heart rate in rats fuse E and A waves making it difficult to measure diastolic function25. Despite the inconsistent results found assessing
diastolic function using E/A 6 weeks, an increased LA diameter observed in this study indicates LV diastolic dysfunction, since an improved systolic function was observed in the AoS group in comparison with controls. During ventricular diastole, LA is directly exposed to intraventricular pressures through the mitral valve. Eventual rises in ventricular diastolic pressure increase atrial pressure and thereby chamber remodeling. Experimental studies of AoS have associated myocardial stiffness with an increase in collagen fibers and changes in the proteins involved in intracellular calcium reuptake, particularly the sarcoplasmic reticulum calcium pump24. Thus, the diastolic function depression
observed 6 and 18 weeks after AoS may be related with changes in elastic properties and disturbances in calcium handling.
While the echocardiographic data showed functional and structural changes at weeks 6 and 18, stress tolerance test did not detect change in functional capacity in both groups. In our knowledge, it´s the first research that evaluated exercise physical tolerance in rat with ascending aortic stenosis. The TTT was the only parameter to show a strong tendency toward decrease in animal with AoS (0.05<p<0.10). The similar stress response may be due to: 1) an inadequate protocol; 2) parameters insensitive to detect changes in functional capacity; and 3) ventricular dysfunction level. With regard to the first item, the physical stress testing used can be considered adequate for the following reasons: i) similar methods have been used in
other experimental studies17,26; ii) it allowed submitting the
animals to an individualized physical stress program; iii) the gradual increase of load interrupted the linear pattern of the lactate concentration curve and allowed determining LT; iiii) no deaths occurred during testing or immediately afterward, indicating that, despite being a maximal test, it can be used in the experimental AoS model. The parameters used were considered appropriate because: i) SLT and/or SEx have been successfully used in several experimental works in normal rats17,27,28, in rats with abdominal aortic stenosis or myocardial
infarction18,27; ii) TTT has also been employed to assess
functional capacity in infarcted and hypertensive animals26,29.
In asymptomatic AoS patients, it has been considered to be a good predictor of the onset of heart failure signs30; iii) [LAC] LT and [LAC]EX have been used in experimental studies in
humans as a marker of physical training intensity28. In relation
to item 3, the literature shows that stress testing has detected functional capacity reduction in animals with ventricular diastolic dysfunction induced by arterial hypertension29 or,
more commonly, with heart failure induced by myocardial infarction26. Moreover, the test is reported to be negative in rats
with abdominal aortic stenosis and compensated ventricular hypertrophy27, and in a rat model of hyperadrenalinemia
induced by adrenalin tablet implantations. In this study, no signs of heart failure were observed, even though diastolic and systolic performances were depressed in AoSG during remodeling. Given that the literature shows that stress testing is significantly positive in animals with heart failure14,15, the
absence of changes observed here may be related to the level of ventricular dysfunction, which was probably moderate. The similar data of cardiac index indicates peripheral blood flow perfusion equivalent between groups. Another explanation about absence of difference between groups can be related of speed exhaustion of control rats. Physical stress test protocol showed small values of speed at exhaustion (15 m/min) and speed at lactate threshold (9.0m/min) in control rats. In according to literature it would be expected higher values of these parameters. Ferreira et al31 observed speed at exhaustion
of 28 m/min and speed at lactate threshold of 15 m/min in untrained mice. Carvalho et al17 shown speed at exhaustion
of 19.5 m/min and speed at lactate threshold of 14.9 m/min in untrained rats. Despite of controversy data, the lactate concentration at exhaustion observed by us were similar at 18 m/min of speed in the Ferreira et al31 study and in the
speed of exhaustion (19.5 m/min) observed by Carvalho et al17. Therefore, it means that our rats attained maximum or
near of maximum effort during exercise testing.
The mechanisms responsible for the reduction in exercise capacity have not been completely elucidated. Some of the possible factors include inadequate flow to skeletal muscle secondary to systolic and/or diastolic dysfunction and changes in the metabolism of the peripheral musculature29. Since the
response to physical stress remained unchanged during interval testing, the factors mentioned above either were absent or of insufficient magnitude in the rats with AoS assessed in this study.
parameters that estimate exercise intensity during physical testing (i.e. heart rate, arterial pressure, oxygen consumption); 3) lacking literature data about time, speed running, lactate in similar experimental conditions.
In conclusion, no changes in physical stress tolerance were observed in the presence of diastolic dysfunction isolated or associated with systolic dysfunction. The level of left ventricular dysfunction seems to be the major determinant on the results of this study. Further studies including animals with greater ventricular dysfunction or heart failure as well as the analysis of the mechanisms that might alter the cardiac remodeling/stress tolerance relationship are necessary.
Potential Conflict of Interest
No potential conflict of interest relevant to this article was reported.
Sources of Funding
There were no external funding sources for this study.
Study Association
This article is part of the master thesis submitted by Olga de Castro Mendes da Silva, from Faculdade de Medicina da Universidade Estadual Paulista Júlio de Mesquita Filho.
1. Cohn JN, Ferrari R, Sharpe N. Cardiac remodeling-concepts and clinical implications: a consensus paper from an international forum on cardiac remodeling. J Am Coll Cardiol. 2000;35(3):569-82.
2. Berenji K, Drazner MH, Rothermel BA, Hill JA. Does load-induced ventricular hypertrophy progress to systolic heart failure? Am J Physiol Heart Circ Physiol. 2005;289(1):H8-H16.
3. Kaplan NM. Systemic hypertension: mechanisms and diagnosis. In: Braunwald E, Zipes DP, Libby P. (eds.). Heart disease: a textbook of cardiovascular medicine. 6th ed. Philadelphia: Saunders Company; 2001. p. 941-1071.
4. Okoshi MP, Matsubara LS, Franco M, Cicogna AC, Matsubara BB. Myocyte necrosis is the basis for fibrosis in renovascular hypertensive rats. Braz J Med Biol Res. 1997;30(9):1135-44.
5. Weinberg EO, Schoen FJ, George D, Kagaya Y, Douglas PS, Litwin SE, et al. Angiotensin-converting enzyme inhibition prolongs survival and modifies the transition to heart failure with pressure overload hypertrophy due ascending aortic stenosis. Circulation. 1994;90(3):1410-22.
6. Rossi MA, Peres LC. Effect of captopril on the prevention and regression of myocardial cell hypertrophy and interstitial fibrosis in pressure overload cardiac hypertrophy. Am Heart J. 1992;124(3):700-9.
7. Bregagnollo EA, Okoshi K, Bregagnollo IF, Okoshi MP, Padovani CR, Cicogna AC. [Effects of the prolonged inhibition of the angiotensin-converting enzyme on the morphological and functional characteristics of left ventricular hypertrophy in rats with persistent pressure overload]. Arq Bras Cardiol. 2005;84(3):225-32.
8. Schunkert H, Orzechowski HD, Bocker W, Meier R, Riegger GA, Paul M. The cardiac endothelin system in established pressure overload left ventricular hypertrophy. J Mol Med (Berl). 1999;77(8):623-30.
9. Litwin SE, Katz SE, Weinberg EO, Lorell BH, Aurigemma GP, Douglas PS. Serial echocardiographic-Doppler assessment of left ventricular geometry and function in rats with pressure overload hypertrophy chronic angiotensin-converting enzyme inhibition attenuates the transition to heart failure. Circulation. 1995;91(10):2642-54.
10. Moreira VO, de Castro AV, Yaegaschi MY, Cicogna AC, Okoshi MP, Pereira CA, et al. [Echocardiographic criteria for the definition of ventricular dysfunction severity in aortic banded rats]. Arq Bras Cardiol. 2006;86(6):432-8.
11. Ribeiro HB, Okoshi K, Cicogna AC, Bregagnollo EA, Rodrigues MA, Padovani CR, et al. Follow-up study of morphology and cardiac function in rats undergoing induction of supravalvular aortic stenosis. Arq Bras Cardiol. 2003;81(6):569-75.
12. Chalela WA, Moffa PJ. Teste ergométrico. In: Negrão CE, Barreto AC. (eds). Cardiologia do exercício - do atleta ao cardiopata. São Paulo: Barueri; 2005. p. 92-126.
13. Sullivan MJ, Hawthorne MH. Exercise intolerance in patients with chronic heart failure. Prog Cardiovasc Dis. 1995;38(1):1-22.
14. Kitzman DW, Little WC, Brubaker PH, Anderson RT, Hundley WG, Marburger CT, et al. Pathophysiological characterizationof isolated diastolic heart failure in comparison to systolic heart failure. JAMA. 2002;288(17):2144-50.
15. Kitzman DW. Exercise intolerance. Prog Cardiovasc Dis. 2005;47(6):367-79.
16. de Paiva SA, Zornoff LA, Okoshi MP, Okoshi K, Matsubara LS, Matsubara BB, et al. Ventricular remodeling induced by retinoic acid supplementation in adult rats. Am J Physiol Heart Circ Physiol. 2003;284(6):H2242-6.
17. Carvalho JF, Masuda MO, Pompeu FA. Method for diagnosis and control of aerobic training in rats based on lactate threshold. Comp Biochem Physiol A Mol Integr Physiol. 2005;140(4):409-13.
18. Bech OM, Sorensen JD, Jensen MK, Diamant B, Steiness E. Effects of long-term Coenzyme Q10 and captopril treatment on survival and functional
capacity in rats with experimentally induced heart infarction. J Pharmacol Exp Ther. 1990;255(1):346-50.
19. Svedahl K, MacIntosh BR. Anaerobic threshold: the concept and methods of measurement. Can J Appl Physiol. 2003;28(2):299-323.
20. Okoshi K, Ribeiro HB, Okoshi MP, Matsubara BB, Gonçalves G, Barros R, et al. Improved systolic ventricular function with normal myocardial mechanics in compensated cardiac hypertrophy. Jpn Heart J. 2004;45(4):647-56.
21. Litwin SE, Raya TE, Anderson PG, Litwin CM, Breezier R, Goldman S. Induction of myocardial hypertrophy following coronary ligation in rats decreases left ventricular dilatation and improves systolic function. Circulation. 1991;84(4):1819-27.
22. Bregagnollo EA, Mestrinel MA, Okoshi K, Carvalho FC, Bregagnollo IF, Padovani CR, et al. Relative role of left ventricular geometric remodeling and of morphological and functional myocardial remodeling in the transition from compensated hypertrophy to heart failure in rats with supravalvar aortic stenosis. Arq Bras Cardiol. 2007;88(2):225-33.
23. Boluyt MO, O’Neill L, Meredith AL, Bing OH, Brooks WW, Conrad CH, et al. Alterations in cardiac gene expression during the transition from stable hypertrophy to heart failure: marked upregulation of genes encoding extracellular matrix components. Circ Res. 1994;75(1):23-32.
24. Boluyt MO, Robinson KG, Meredith AL, Sen S, Lakatta EG, Crow MT, et al. Heart failure after long-term supravalvar aortic constriction in rats. Am J Hypertens. 2005;18(2 Pt 1):202-12.
25. Pritchett AM, Jacobsen SJ, Mahoney DW, Rodeheffer RJ, Bailey KR, Redfield MM. Left atrial volume as an index of left atrial size: a population-based study. J Am Coll Cardiol. 2003;41(6):1036-43.
26. Bayat H, Swaney JS, Ander AN, Dalton N, Kennedy BP, Hammond HK, et al. Progressive heart failure after myocardial infarction in mice. Basic Res Cardiol. 2002;97(3):206-13.
27. Morris GS, Fitzsimons DP, Baldwin KM, Barbard RJ. Exercise capacity of rats remains unaffected by a chronic pressure overload. Cardiovasc Res. 1993;27(7):1346-9.
28. Contarteze RV, Manchado Fde B, Gobatto CA, De Mello MA. Stress biomarkers in rats submitted to swimming and treadmill running exercises. Comp Biochem Physiol A Mol Integr Physiol. 2008;151(3):415-22.
29. Guazzi M, Brenner DA, Apstein CS, Saupe KW. Exercise intolerance in rats with hypertensive heart disease is associated with impaired diastolic relaxation. Hypertension. 2001;37(2):204-8.
30. Das P, Rimington H, Chambers J. Exercise testing to stratify risk in aortic stenosis. Eur Heart J. 2005;26(13):1309-13.