www.atmos-chem-phys.org/acp/5/1879/ SRef-ID: 1680-7324/acp/2005-5-1879 European Geosciences Union
Chemistry
and Physics
The UV-A and visible solar irradiance spectrum: inter-comparison
of absolutely calibrated, spectrally medium resolution solar
irradiance spectra from balloon- and satellite-borne measurements
W. Gurlit1, H. B¨osch2,*, H. Bovensmann1, J. P. Burrows1, A. Butz2, C. Camy-Peyret3, M. Dorf2, K. Gerilowski1, A. Lindner2, S. No¨el1, U. Platt2, F. Weidner2, and K. Pfeilsticker2
1Institut f¨ur Umweltphysik und Fernerkundung, University of Bremen, Bremen, Germany 2Institut f¨ur Umweltphysik, University of Heidelberg, Heidelberg, Germany
3Laboratoire de Physique Mol´eculaire et Applications (LPMA), Universit´e Pierre et Marie Curie, Paris, France *now at: Jet Propulsion Laboratory (JPL), California Institute of Technology, Pasadena, USA
Received: 9 August 2004 – Published in Atmos. Chem. Phys. Discuss.: 20 December 2004 Revised: 20 June 2005 – Accepted: 27 June 2005 – Published: 26 July 2005
Abstract. Within the framework of the ENVISAT/-SCIAMACHY satellite validation, solar irradiance spec-tra are absolutely measured at moderate resolution in the UV/visible spectral range (in the UV from 316.7–418 nm and the visible from 400–652 nm at a full width half max-imum resolution of 0.55 nm and 1.48 nm, respectively) from aboard the azimuth-controlled LPMA/DOAS balloon gon-dola at around 32 km balloon float altitude. After account-ing for the atmospheric extinction due to Rayleigh scatteraccount-ing and gaseous absorption (O3 and NO2), the measured solar
spectra are compared with previous observations. Our solar irradiance spectrum perfectly agrees within +0.03% with the re-calibrated Kurucz et al. (1984) solar spectrum (Fontenla et al., 1999, called MODTRAN 3.7) in the visible spec-tral range (415–650 nm), but it is +2.1% larger in the (370– 415 nm) wavelength interval, and−4% smaller in the UV-A spectral range (316.7–370 nm), when the Kurucz spectrum is convolved to the spectral resolution of our instrument. Sim-ilar comparisons of the SOLSPEC (Thuillier et al., 1997, 1998a, b) and SORCE/SIM (Harder et al., 2000) solar spec-tra with MODTRAN 3.7 confirms our findings with the val-ues being−0.5%, +2%, and−1.4% for SOLSPEC−0.33%, −0.47%, and −6.2% for SORCE/SIM, respectively. Com-parison of the SCIAMACHY solar spectrum from channels 1 to 4 (– re-calibrated by the University of Bremen –) with MODTRAN 3.7 indicates an agreement within−0.4% in the visible spectral range (415–585 nm),−1.6% within the 370– 415 nm, and−5.7% within 325–370 nm wavelength interval, in agreement with the results of the other sensors. In agree-ment with findings of Skupin et al. (2002) our study empha-sizes that the present ESA SCIAMACHY level 1 calibration
Correspondence to:K. Pfeilsticker (klaus.pfeilsticker@iup.uni-heidelberg.de)
is systematically +15% larger in the considered wavelength intervals when compared to all available other solar irradi-ance measurements.
1 Introduction
since sensitive UV/visible spectroscopy in planetary atmo-spheres largely relies on removing the Fraunhofer lines in ra-tioed spectra. To date little is known about the Sun disk aver-age spectroscopic parameters and in particular about the tem-poral and spatial variability of individual Fraunhofer lines.
In the past two decades, information on the solar constant and Eo(λ)were collected by a large number of space-borne, air-borne and ground-based instruments (e.g., Neckel and Labs, 1984; Kurucz et al., 1984, 1992; Wehrli, 1985; Brault and Neckel, 1987; Thuillier et al., 1997, 1998a, b; Harrison et al., 2003). To date, a consensus on Eo(λ)could only be achieved within few percents in the UV-A and visible spec-tral range, primarily due to given problems with the absolute calibration of radiation measurements, long term drifts of the various employed sensors, and resulting intcalibration er-rors.
For the present study most important are the high res-olution spectrum measured by Kurucz et al. (1984) cali-brated with Neckel and Labs (1984) solar line data which forms the basis for the WMO consensus (Wehrli, 1985), and the recent spectro-radiometrically re-calibrated Kurucz et al. solar spectrum (Fontenla et al., 1999, in the manuscript briefly called MODTRAN 3.7) using spectro-radiometric data from the space-borne SOLSPEC instrument, (Thuillier et al., 1997, 1998a, b). These spectra are compared with our balloon-borne Eo(λ)-measurements conducted at 32 km altitude. Unfortunately, our Eo(λ)spectrum can not be com-pared with Eo(λ)recently inferred by Harrison et al. (2003), since the authors did not make their solar spectrum available to the public.
Here direct Sun observations of the LPMA/DOAS payload (Limb Profile Monitor of the Atmosphere and Differential Optical Absorption Spectroscopy) are used to absolutely in-fer Eo(λ)in 2 wavelength intervals in the UV/visible spec-tral range (316.7–418 nm, 400–652 nm). During past balloon flights the primary scientific objective of the LPMA/DOAS payload was the simultaneous measurement of profiles of at-mospheric trace gases which are of interest for the ozone chemistry, such as O3, O4, NO, NO2, HNO3, BrO, OClO,
HCl, ClONO2, IO, OIO, CO, CO2, . . . (for details of the
instruments and the measurements see Camy-Peyret et al., 1993; Payan et al., 1998; Harder et al., 1998, 2000; Ferle-mann et al., 1998, 2000; B¨osch et al., 2001, 2003; Pfeil-sticker et al., 2000, 2001). The used instrumentation and observation geometry provided by the balloon gondola are also ideally suited to support precise Eo(λ)-measurements. Our in-flight measured Eo(λ)is corroborated by a spectro-radiometric calibration of the deployed spectrometers using on-site calibration instruments prior to the balloon flights. The Eo(λ)-measurement includes suitable corrections to the atmospheric extinction, which is based on Langley’s method in order to account for the residual atmospheric extinctions due to Rayleigh- and Mie-scattering, and trace gas absorp-tions of O3, NO2, BrO,. . .
In the past 2.5 years SCIAMACHY (Scanning Imag-ing Absorption Spectrometer for Atmospheric CHartogra-phY) has been monitoring daily Eo(λ) within the 220– 2380 nm wavelength range. These observations form a unique, and unprecedented set of Eo(λ)-measurements when carefully validated. Intentionally, our balloon-borne Eo(λ) -measurements are primarily motivated to validate those of the SCIAMACHY instrument (e.g., Burrows et al., 1995; Frerick et al., 1997; Bovensmann et al., 1999), but due to their high quality they are evidently suitable to test previous Eo(λ)-measurements and their derivates (e.g., Kurucz et al., 1984; Neckel and Labs, 1984; Wehrli, 1985; Fontenla et al., 1999; Thuillier et al., 1997 1998a, b; Harrison et al., 2003).
Here we report on UV/visible Eo(λ)-measurements from SCIAMACHY and the LPMA/DOAS balloon instruments. Results of the near-IR Eo(λ)-measurements will be reported elsewhere.
The present study is organized as follows: In Sect. 2, we describe and discuss the employed methods. Section 3 is de-voted to the description of the absolute calibrations of the balloon-borne and the SCIAMACHY instrument. Section 4 reports on the field observations, and Sect. 5 discusses the results. Finally, Sect. 6 closes the study with concluding re-marks.
2 Methods
2.1 The LPMA/DOAS payload
2.2 The DOAS instrument
Since the details of the DOAS spectrometer have already been described elsewhere (Ferlemann et al., 2000), here only a short description of its key features is given. Two small (light intake) telescopes are mounted at the outer edge of the parallel solar beam provided by the Sun-tracker. They are equipped with appropriate filters, lenses, diffusers and skimmer plates which provide a field of view, FOV=10◦and 16◦, f/5.7 and f/3.5 for the UV and visible instruments, re-spectively. This optical arrangement of the telescopes al-lows observation of the full solar disk (0.55◦, f/55), which is necessary for reliable atmospheric trace gas measurements and radiometric calibrated Eo(λ)-measurements (B¨osch et al., 2003). From the telescope exits, two quartz fibre bun-dles conduct the collected light into two grating spectrome-ters. Both spectrometers are mounted into an evacuated, and thermostated spectrometer housing (0.0±0.3◦C), a feature which keeps the optical imaging reasonably constant during the balloon flights. The exits of the quartz fibre bundles form rectangular slits (125µm in width and 2.5 mm in height). Holographic gratings disperse the solar light onto photo-diode detector arrays in the respective wavelength intervals (UV: 316.7–418 nm and visible: 400–652 nm). The width of the slits (125µm corresponding to the width of 5 pho-todiode pixels) are chosen to provide full width half maxi-mum (FWHM) resolutions of 0.45 nm (or∼0.112 nm/diode), and 1.48 nm (or ∼0.257 nm/diode) for the UV and visible instrument, respectively. The light is detected by two state of the art 1024 element photodiode array detectors cooled to −10◦C with on-chip integrated Peltier elements (Hamamatsu
S5931-1024N). The frequently used sapphire window – usu-ally used to protect the photodiode array surface – is removed to avoid disturbing reflections of the incoming light, a mea-sure decreasing the unwanted spectrometer stray light. The photodiode outputs are pre-amplified and fed into two 16 bit A/D converters and read-out by two 68332-CPU driven con-troller devices. The total read-out time of the electronics is about 60 ms for 1024 diodes allowing us to record individ-ual spectra within∼100 ms. Both 68332-CPU controllers are supervised by a 486-PC single board which also controls the onboard data storage as well as the communication to the ground station via telemetry/telecommand.
2.3 The ENVISAT/SCIAMACHY instrument
SCIAMACHY deployed onboard the ESA ENVISAT satel-lite is an optical spectrometer designed to measure sunlight, transmitted, reflected and scattered by the Earth atmosphere or surface in the ultraviolet, visible and near infrared wave-length region (240 nm–2380 nm) at moderate spectral reso-lution (0.2–1.5 nm). ENVISAT was launched into orbit from Kourou on 28 February 2002 on a Sun synchronous orbit with an equator crossing time at roughly 10:00 LT. SCIA-MACHY measures the absorption, reflection and scattering
characteristics of the atmosphere by monitoring the extrater-restrial solar irradiance and the upwelling radiance observed in different viewing geometries. The ratio of measured Eo(λ) and the upwelling radiance is inverted to provide information about the amounts and distribution of important atmospheric constituents, which absorb or scatter light, and the spectral reflectance (or albedo) of the Earth’s surface (for details on the instrument see Burrows et al., 1995, Frerick et al., 1997 and Bovensmann et al., 1999, and for first measurements see Von Savigny et al., 2004a, b).
Several types of Eo(λ)-measurements are regularly per-formed by SCIAMACHY as part of the in-flight calibration and monitoring concept (e.g., No¨el et al., 2003).
2.4 The calibration sources
For the absolute radiometric calibration, the following radia-tion sources and standards are used:
Calibrated NIST lamps: For the absolute calibration, a Na-tional Institute of Standards and Technology (NIST) FEL 1000 W irradiance standard Quartz Tungsten Halogen (QTH) lamp (serial number F-455) from OSRAM Sylvania is used as radiation standard (see below) (Walker et al., 1987). The lamp emits sufficient light in the 250–2400 nm wavelength range, with a maximum output at 900 nm, from a∼35 mm large spiral-wound filament. In the UV/visible spectral range (350–652 nm), the wavelength dependent radiometric accu-racies range between 0.91%–1.09%, and the long term re-producibility is 0.87%–0.96% depending on the wavelength (for details see NIST report of calibration, 844/25 70 96-96-1, 1997).
Sun simulator: Since the balloon-borne LPMA/DOAS spectrometers analyze the solar light from a parallel beam of 10 cm diameter, a Sun simulator for laboratory test mea-surements has been built. The Sun simulator consists of a small passively cooled reflective diffuser plate of 9.2 mm di-ameter which is uniformly illuminated by 4 stabilized 250 W reflector QTH lamps. The small diffuser plate is imaged into infinity through a 200 mm diameter, f=1000 mm, off-axis parabolic mirror. It produces a collimated beam with a divergence of about 0.52◦. The diffuser plate is mounted into the focus of the collimating mirror for the emission of a nearly homogeneous beam across its principal axis. In lon-gitudinal direction, the beam homogeneity is given by the diameter of the reflective diffuser, the focal length of the parabolic mirror and the diameter of the parabolic mirror. In this region, the irradiance across the beam (diameter 12 cm) remains constant to within±2% and along the major beam axis it changes by less than 1%/m.
intake telescope is used in cross calibration exercises (see be-low).
Prior to the absolute calibration of the in-flight spectrom-eters, the NIST lamp is used to calibrate the output of the Sun simulator using the Ocean Optics USB-2000 spectrom-eter. The cross calibration involves two steps. First, the Ocean Optics USB-2000 spectrometer is calibrated with ra-diation measurements taken from the absolutely calibrated NIST lamp. For this purpose, the NIST lamp, the USB-2000 spectrometer entrance optics, and the Sun simulator beam center are properly aligned on an optical bench. Later a light trap is installed in between the turned-off Sun simulator and the NIST lamp. Calibration of the USB-2000 spectrometer is performed by directing its light intake optics into the center of the NIST lamp. Then the light trap and the NIST lamp are dismounted. Using the calibrated USB-2000 spectrom-eter, the beam irradiance of the Sun simulator is measured as a function of distance by moving the entrance optics of the USB-2000 spectrometer along the Sun simulator beam. The measurements provide information on the Sun simulator beam homogeneity, and on its absolute irradiance as function of beam position. The whole set of inter-calibrated instru-ments (NIST lamp, Sun simulator and the USB-2000 spec-trometer) is further used to calibrate both DOAS spectrom-eters. Evidently, the set of instruments allows a closed loop calibration using either the NIST lamp or the calibrated Sun simulator as standard (see Sect. 3).
3 Absolute radiometric calibration of the field instru-ments
3.1 Calibration of the DOAS spectrometers
The LPMA/DOAS payload represents an optical system with 4 subsystems: (1) the Sun-tracker, (2) the LPMA Fourier Transform instrument, (3) the DOAS UV and (4) visible tele-scope. Ideally, all these optical devices should exactly point into the same direction, but in reality they are only more or less well aligned.
The pre-flight absolute calibration of the LPMA/DOAS spectrometers involves the following 5 steps:
1. The optical alignment of all 3 spectrometers is individ-ually optimized by maximizing the received solar light when the Sun-tracker points to the solar disk’s center. This “best” position of the Sun-tracker is documented by imaging the solar disk with a CCD camera, which is mounted into the viewing direction of the Sun-tracker. The Sun-tracker’s maximum signal position is referred to as the Sun-tracker “zero position”. After this pro-cedure is performed, small misalignments (pointing er-rors) of each of the 3 spectrometers with respect to the Sun-tracker zero position may however, remain.
2. In the second step, the relative alignment of the optical axis of each spectrometer and the Sun-tracker are tested using the Sun simulator. For this purpose, the beam of the Sun simulator is directed towards the Sun-tracker which is kept in its “zero” position. Information on remaining misalignments of the spectrometer’s optical axis with respect to the Sun-tracker “zero position” is further gained by varying the azimuth and elevation an-gles of the Sun-tracker (within the possible limits given by the set-up, see point 5 below) and by monitoring the spectra of the Sun simulator. Then the received maxi-mum signal defines the misalignment of each spectrom-eter and the necessary pointing corrections.
3. After quantification of the pointing errors for the differ-ent spectrometers (using the Sun simulator as a small light source positioned at infinity), both DOAS spec-trometers can be absolutely calibrated with a point source (the NIST lamp) aligned at finite (known) dis-tance. For this purpose an alignment diode laser and the NIST lamp are mounted on an optical bench (4 m long) which is installed roughly 3 m in front of the Sun-tracker. The relative alignment of each spectrometer light intake is measured by directing the laser beam first through the center of a moveable graticule (the so-called alignment-“jig” recommended by NIST; Walker et al., 1987), and the centers of the DOAS telescopes. For this purpose the alignment-“jig” is mounted into the NIST lamp holder on the optical bench. Further, the alignment-“jig” is replaced by the NIST lamp and the irradiance received by each spectrometer is maximized by turning the Sun-tracker into the maximum signal po-sition of each spectrometer. In a next step, the NIST lamp is again replaced by the alignment-“jig”. The op-tical axis defined by the alignment-“jig” and the DOAS telescope’s centers is further geometrically measured by pointing with a theodolite through the graticule and each telescope center. The optical bench is fine adjusted by moving the graticule to different bench positions, while pointing with the theodolite through the graticule’s cen-ter. After this procedure, the optical axis of each DOAS telescope is reproducibly defined relative to the optical bench. Further, using the theodolite and small retro-reflectors positioned in front of the graticule and the telescopes, electro optical distance measurements are performed to within 0.1% precision. The knowledge of the distance between the calibration source and the telescopes is necessary for the calculation of the lamps irradiance at that distance (see point 4).
Table 1.Error budget of the absolute Eo(λ)-measurements in the UV and visible channels of DOAS on the LPMA/DOAS payload.
No error source 340 nm 390 nm 500 nm 600 nm
1 NIST lamp calibration 1.09% 1.09% 0.91% 0.91%
2 long term drift of the NIST lamp 0.96% 0.96% 0.87% 0.87%
3 calibration procedure 5.07% 3.29% 2.58% 2.48%
4 UV/visible spectrometer stray light 0.2% 0.2% 0.1% 0.1%
5 telescope mirror reflectivity correction
and Langley correction error 0.51% 0.5% 0.36% 0.36%
total error ±5.3% ±3.63% ±2.89% ±2.8%
for well aligned point sources. When varying the dis-tance d from 412.5 cm to 571.9 cm the following devi-ations from the square distance irradiance relation are found for the UV and visible spectrometer, respectively: maximum deviation±0.52%/±0.5% with mean values of±0.12%/±0.24%. The small departures thus indicate the validity of our approach and that, laboratory stray light does not play a significant role in the calibration. 5. Since in the laboratory the whole optical set-up (the
500 kg gondola and the optical bench) can not be brought into all relative positions attained by the Sun-tracker and the Sun during a balloon flight (cf., the az-imuth angle of the payload may change by as much as 15◦, or the solar zenith angle may change from 65◦ to 95◦before the Sun-tracker looses the tracking of the so-lar disk) the incident angle and wavelength dependent reflectivity of the Sun-tracker mirrors are measured in the laboratory by the SOPRA company (Paris/France) relative to the optical axis used in the absolute calibra-tion. In fact, it is found that for the incident angles cov-ered in the present study, the mirror reflectivity changes by as less<3%, therefore it is dealt with in the error budget (Table 1).
Table 1 summarizes the absolute errors in the abso-lute calibration of the DOAS-spectrometers and the Eo(λ) -measurement (see Sect. 4.1). Arguable they are dominated by uncertainties arising from the calibration procedure (er-ror source 3). The total er(er-ror increases when going from the red into the UV-A spectral range, mostly because of the de-creasing intensity the different calibration sources emit with decreasing wavelengths. This requires longer and longer signal integration periods (up to 15 min in the UV) in or-der to obtain reasonable signal to noise ratios for light de-tection. Although previous studies indicated that the used photodiode array detectors show a highly linear response for short integration times (seconds) typical in direct Sun spec-troscopy, non-linearities, for example in the dark current, be-come more important with increasing integration time even though they are partly accounted for in the analysis (Fer-lemann et al., 2000; Platt and Stutz, 2004). Therefore, a
more accurate Eo(λ)-measurement would require more in-tense emitting standard lamps than available, in particular in the UV-A spectral range.
3.2 Absolute radiometric calibration of SCIAMACHY The absolute radiometric irradiance calibration of SCIA-MACHY is based on the knowledge of two parameters: (1) a conversion factor for the measured detector signal (counts) and the absolute irradiance (or radiance), and (2) a correc-tion factor taking into account the angular dependence of the mirror reflectivity and the Bi-directional Reflectance Distri-bution Function (BRDF) of the Elevation Scan Mechanism (ESM) diffuser. The first (throughput) factor is determined with the SCIAMACHY instrument under thermal vacuum conditions during several so-called “OPTEC” campaigns us-ing NIST-calibrated lamps as irradiance reference and a com-bination of a NIST lamp and an external calibrated spectralon diffuser as radiance reference.
Since not all angular arrangements could be measured within the OPTEC campaigns, the second (scan angle de-pendent) factor is independently determined on ‘a scanner module component level’ under ambient conditions prior the OPTEC campaigns. More details about the SCIAMACHY calibration concept can be found in Frerick et al. (1997).
First comparisons of radiances and irradiances measured by SCIAMACHY with independent measurements indicated unreasonably large errors in its absolute radiometric calibra-tion (Skupin et al., 2002). In order to resolve this prob-lem, an extensive analysis of the radiometric on-ground cal-ibration measurements of SCIAMACHY is performed, in which a new procedure is developed to recalculate some of the radiometric key data from existing end-to-end measure-ments. These calculations are primarily based on a sub-set of NASA integrated sphere measurements, performed within SCIAMACHY’s radiance and irradiance validation during the OPTEC-5 period in 1999/2000. The employed integrating sphere is a 20′′ diameter internally illuminated sphere coated with BaSO4. It has a long history of
Table 2.Compendium of LPMA/DOAS balloon-borne solar irradi-ance spectra measurements.
Date/Time Location Geophys. Cond. Instrument
23 March 2003 Kiruna high-lat. spring LPMA+
14:47–17:35 67.9◦N, 21.1◦E sunset DOAS
9 Oct. 2003 Aire-sur-l’Adour mid-lat. fall LPMA+ 15:39–17:09 43.7◦N, 0.25◦W sunset DOAS
24 March 2004 Kiruna high-lat. spring LPMA+
13:55–17:35 67.9◦N, 21.1◦E sunset DOAS
GOME absolute radiance calibration. The inferred SCIA-MACHY key data show differences to the on-ground am-bient measured and calculated BRDF key data of SCIA-MACHY’s ESM diffuser. Using these new radiometric key data in the interpretation of in-flight measurements, signifi-cant improvements in the quality of the level-1 data products is achieved. From this improvement, a better quality of the SCIAMACHY level-2 data products can also be expected.
4 Field observations
4.1 The LPMA/DOAS Eo(λ)-measurements
Prior to the balloon flights (see Table 2), the 3 balloon spec-trometers are carefully calibrated with the on-site instrumen-tation and procedure described in Sects. 2.4 and 3.1. The LPMA/DOAS calibration procedure includes direct Sun ob-servations at the ground during sunrise and sunset. These observations are used to control the optical alignment of the instruments (the Sun-tracker, and the spectrometer light in-takes) installed aboard the gondola. Moreover the solar spec-tra recorded at the ground can also be used for comparisons with the in-flight taken spectra. Comparing both sets of data may provide new insights into total atmospheric scattering and absorption. This issue is particularly important to im-prove our understanding on the atmospheric absorption of the solar radiation, a scientific problem being intensively debated in the past years (e.g., Kerr, 1995; Arking, 1996; Harrison et al., 2003). These investigations will be reported elsewhere.
In the data analysis, the raw solar spectra measured during several balloon flights at balloon float altitude are first cor-rected for the so-called offset and dark current of the diode array detectors.
Further, the measured solar spectra need small but quan-tifiable corrections to account for the residual line-of-sight (LOS) atmospheric extinction (Rayleigh scattering) and ab-sorption (O3 and NO2). Owing to the balloon’s high
float altitude (30.5–32.5 km) and moderately large solar zenith angles (in the range of 83◦–88◦), the total LOS air mass (<2.5·1024molecules/cm2) is very small compared to ground-based measurements. The corrections employed in
0.0 0.5 1.0 1.5 2.0 2.5 3.0
-0.05 0.00
ln(I( ))
+
NO2
+
NO2
+
NO2
+
NO2
+
NO2
+
NO2
+
NO2
+
O3
+
O3
= 391.40 nm
l
n
(
I
(
)
/
I
o
(
)
)
air mass [10
24
cm
-2
]
-0.10 -0.05 0.00
ln(I( ))
ln(I())
= 351.84 nm
-0.25 -0.20 -0.15 -0.10 -0.05 0.00
= 326.72 nm
Fig. 1. Measured solar irradiance ratio (ln[E(λ)/Eo(λ)]) for UV
spectrometer at 3 wavelengths (upper panel: 326.7 nm, middle panel: 351.8 nm, lower panel: 391.4 nm) inferred for the Aire-sur-l’Adour/France measurement around ∼32 km (83◦<SZA<88◦) on 9 October 2003. The data in black show the measured ln[E(λ)/Eo(λ)], the data in blue, green and red after accounting for Rayleigh scattering, O3 absorption, and NO2 absorption,
respec-tively. The open grey data are discarded in the Langley regression (for details see text) and the black lines show the regression to the Langley corrected data.
the present study rely on extrapolations to zero air mass of the calculated (Rayleigh) or DOAS-measured (for O3 and
NO2) atmospheric extinction as a function of LOS
(Lang-ley’s method) (Figs. 1 and 2).
The total LOS air masses are calculated from in-situ mea-sured pressure (p) (accuracy 0.1 mbar) and temperature (T) (accuracy 0.5 K), atmospheric model based T and p-profiles from the European Centre for Medium Range Weather Fore-cast (ECMWF) above balloon float altitude, and the Sun’s ephemeris, using a ray tracing model. The lab-owned model accounts for a fully spherical and refractive atmosphere. From comparisons of the calculated air masses, and the known uncertainties in the atmospheric T and p profiles, the total accuracy for the LOS air mass is estimated to bet-ter than±5%. Second, the measured spectra are corrected for the wavelength dependent Rayleigh scattering using the Rayleigh scattering cross section of Penndorf (1957), and the absorption of ozone and NO2inferred from DOAS LOS
ab-sorption measurements of both gases (Ferlemann et al., 1998, 2000; for details on DOAS see Platt and Stutz, 2004). The accuracies for the LOS absorption of O3and NO2are
esti-mated to±2% and±5%, respectively.
for). Further from the comparison of the Sun-tracker mir-ror reflectivity and Langley corrected irradiance data in the overlapping wavelength range of the UV and visible instru-ment (400–418 nm), it is found that for LOS air masses
<2·1024molecules/cm2the UV channel shows an unreason-able decline in the measured Eo(λ). This decline corresponds to an apparent increase in the inferred optical thickness (OD) of 1OD=0.012 for a change in LOS air mass from 1 to 2·1024molecules/cm2. This finding points to an extra low re-flectivity spot on the Sun-tracker mirrors seen by the UV tele-scope for elevation mirror incident angles larger than 47.5◦. Therefore in the further analysis, the UV data measured for LOS air masses<2·1024molecules/cm2 are discarded (the open symbols in Fig. 1). Also, since at present the reason for the remaining small curvatures in the Langley plots is not totally clear but fortunately small (maximum 1OD≤0.008 in the UV channel), the corresponding uncertainties are dealt with in the error budget of the measurement (Table 1). Fi-nally, the inferred Eo(λ)is also corrected for the varying Sun Earth distance, cf. by−0.27% for the 9 October 2003 flight. 4.2 The Eo(λ)-measurement by SCIAMACHY
Absolute Eo(λ)-measurements of SCIAMACHY are per-formed in the ESM diffuser measurement cycle, on a daily basis. After the data are transmitted to the ground, they are processed by ESA which provides so called level I prod-ucts to the users, including calibrated Eo(λ) spectra. For the present study, alternatively the SCIAMACHY Eo(λ) cal-ibration from ESA, or the re-calibrated version of the IUP-Bremen is used for the ESA verification data set product from orbit 2499 (measured on 22 August 2002 and processed in November 2003). The ESA irradiance data set is currently expected to provide the best quality of the operational data.
For comparison with the correlative data, the SCIA-MACHY Eo(λ)-measurements are scaled to the mean Sun-Earth distance. Since the SCIAMACHY instrument has proven to be radiometrically very stable over time (No¨el et al., 2003), no instrument degradation correction is applied to the data.
An additional correction is applied to the operational Eo(λ)considering the new results of the re-analysis of the on-ground calibration data performed by the IUP-Bremen (see Sect. 3.2). Using this correction, the radiometric key data used by the operational processing are essentially replaced. The quality of the IUP-Bremen correction is currently un-der investigation, and therefore the results presented here are still of ’preliminary’ nature. It is found, however, that the corrected SCIAMACHY Eo(λ)are in good agreement with the MODTRAN 3.7 Eo(λ) data in the visible channel (see below). The error of the IUP-Bremen corrected Eo(λ)is pri-marily arising from uncertainties in the on-ground calibration as indicated by consistency checks. They are expected to be in the order of 3–4% in the visible region somewhat larger in the UV.
0.0 0.5 1.0 1.5 2.0 2.5 3.0
-0.10 -0.08 -0.06 -0.04 -0.02 0.00
+
NO2
+
O3
+
O3
= 580.9 nm
l
n
(
I
(
)
/
I
o
(
)
)
air mass [10 24
cm -2
] -0.08
-0.06 -0.04 -0.02 0.00
ln(I()) ln(I())
ln(I())
+
NO2
+
O3
+
O3
+
NO2
+
O3
+
O3
= 544.6 nm -0.04
-0.02 0.00
= 451.6 nm
Fig. 2. Measured solar irradiance ratio (ln[E(λ)/Eo(λ)]) for
vis-ible spectrometer at 3 wavelengths (upper panel: 451.6 nm, mid-dle panel: 544.6 nm, lower panel: 580.9 nm) inferred for the Aire-sur-l’Adour/France measurement at∼32 km (83◦<SZA<88◦) on 9 October 2003. The data in black show the measured ln[E(λ)/Eo(λ)]. The data in blue, green and red after accounting for Rayleigh scat-tering, O3absorption, and NO2absorption, respectively. The black
lines show the regression to the Langley corrected data.
5 Results and discussion
Even though it is known that the solar activity does not greatly influence Eo(λ)in the considered wavelength ranges (e.g., Willson, 1997; IPCC, 2001), it is worthy to recall that prior to our balloon flight in early October 2003 the solar activity was low (for details see http://www.dxlc.com/solar/ history/hist2003.html), in particular when compared to the extreme solar activities reported for the year 2003 (see http:// sec.noaa.gov/ace/ACErtsw home.html). Therefore, our mea-surement on 9 October 2003 can be regarded to be performed at moderately quiet Sun.
0 1 2
Wavelength [nm]
Kurucz et al., 0
1 2
(d) (c)
S
o
l
a
r
I
r
r
a
d
i
a
n
c
e
[
W
/
m
2
/
n
m
]
SOLSPEC 0
1 2
(b)
SCIAMACHY 0
1 2
(a)
(ch1) (ch1)
(ch4) (ch3)
(ch2)
(ch4) (ch2)
(ch3)
(DOAS-vis) (DOAS-UV)
DOAS
330 360 390 420 450 480 510 540 570 600 630
0 1 2
(e)
SIM
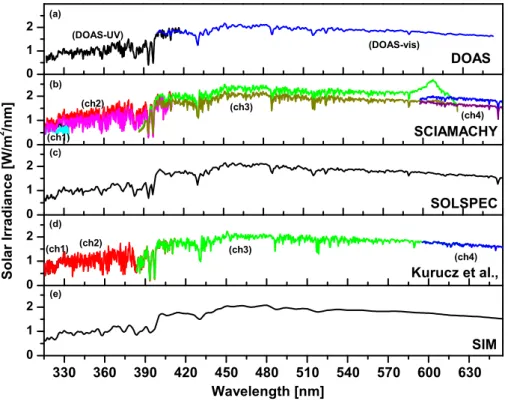
Fig. 3.Inter-comparison of measured solar irradiance spectra(a)for the DOAS measurements at Aire-sur-l’Adour at 32 km, on 9 October
2003;(b) for SCIAMACHY/ENVISAT in channel 1, 2, 3, and 4 using the present ESA SCIAMACHY calibration (upper curves) and the revised IUP-Bremen calibration (lower curves);(c)from SOLSPEC (Thuillier et al., 1997, 1998a, b); (d)from Kurucz et al. (1984) with recent updates of Fontenla et al. (1999) (MODTRAN 3.7) and convolved to the spectral resolution of SCIAMACHY in the respective channels;(e)from SORCE/SIM (Harder et al., 2000).
Therefore, in the following only those Eo(λ) -measurements are inter-compared which are apparently free from systematic errors. In the comparisons we refer all measured Eo(λ)to the high resolution measurements of Kurucz et al. (1994) with the updates given by Fontenla et al. (1999), i.e., MODTRAN 3.7, since it can be convolved to the actual spectral resolution of the former measure-ments using the WINDOAS software (M. Roozendael and C. Fayt, personal communication, 2000). Fitting two spectra to the resolution of the lower resolution spectrum (and by additional applying for λ<418 nm a 1.5 nm wide Gaussian smoothing for the balloon and SCIAMACHY Eo(λ)-measurements), however, minimizes the residuals in ratioed spectra due to slightly different line shapes of the recorded solar Fraunhofer lines while the weak wavelength dependence (baseline) is maintained (Fig. 4).
Most notably is the relative good agreement of the con-sidered solar spectra for wavelength above 415 nm, but the found departures are sometimes larger than the stated errors of the individual measurements.
In the visible spectral range (415–652 nm after the reason for the dip in the SCIAMACHY measurements at 610 nm has been identified and removed), typical departures are
<1.7% (see Table 3). For the balloon measurements, a per-fect agreement is found with the MODTRAN 3.7 spectrum
within the 415–650 nm (agreement to within 0.03%), but for the other sensors SOLPEC/ SORCE/SIM/SCIAMACHY is less good (−0.5%,−0.3%, and−0.4%), but well within the range given by the errors of the individual measurements. However, unlike in the SOLSPEC/MODTRAN 3.7, and SORCE/SIM/MODTRAN 3.7 inter-comparisons, neither in the balloon nor in the SCIAMACHY inter-comparison, the weakly wavelength dependent departure (from +2% at 450 nm to −2% at 625 nm) is observed. Overall, beside the known deficits for SCIAMACHY, the comparison im-plies that our measured Eo(λ)spectrum is largely congruent with SOLSPEC, SORCE/SIM and the MODTRAN 3.7 Ku-rucz spectra, but not with the KuKu-rucz et al. (1984) spectrum taking the Neckel and Labs (1984) calibration (for a compari-son of MODTRAN 3.7 with the Kurucz et al., 1984 spectrum using the Neckel and Labs, 1984 calibration see Harrison et al., 2003). A similar conclusion is also drawn by Harrison et al. (2003), when comparing their Eo(λ)-measurement with MODTRAN 3.7.
350 400 450 500 550 600 650 0.8
1.0
(d)
E
0
(
)
/
E
0
(
)
M
O
D
SOLSPEC 0.8
1.0
SCIAMACHY 0.8
1.0
Wavelength [nm]
(b) (a)
channel 4 channel 2
channel 3
0.8 1.0
VIS-channel UV-channel
DOAS
(c)
SIM
Fig. 4. Ratio of solar irradiance spectra (Eo(λ)/Eo(λ)MOD referenced to the solar spectrum of Kurucz et al. (1984) with recent
up-dates of Fontenla et al. (1999) (MODTRAN 3.7) with(a)the present measurement,(b) SORCE/SIM (Harder et al., 2000),(c) SCIA-MACHY/ENVISAT in channel 1, 2, 3, and 4 using the revised IUP-Bremen calibration, and(d)SOLSPEC (Thuillier et al., 1997, 1998, b). For comparison, the MODTRAN 3.7 solar spectrum is convolved to the spectral resolution of the individual instruments, using a least square fitted Gaussian instrument function as provided by the WINDOAS fitting tool. For the balloon and SCIAMACHY measurements, an additional 1.5 nm wide Gaussian smoothing is applied to the ratioed spectra (light grey and pink lines) forλ<418 nm in order to illustrate baseline effects (filled black and pink lines, respectively). The red dashed lines separate the wavelength intervals for which the individual measurements are compared in Table 3.
to 360 nm only. Taking together all these results, there exists a body of evidence that the MODTRAN 3.7 solar spectrum overestimates the UV-A solar flux by several percent.
Within the 370–415 nm interval, the comparison does not provide a totally clear picture. Overall, out of the 4 solar spectra to which MODTRAN 3.7 are referred to 2 (our ob-servation and the data rom SOLSPEC) show larger Eo(λ) (∼ +2%) (as well as the Harrison et al., 2003 spectrum) than suggested by MODTRAN 3.7, but the other 2 are smaller (−0.5%, and −1.7% for SORCE/SIM and SCIAMACHY, respectively). In distinct wavelength sub-intervals (e.g., at 370–376 nm, 381–387 nm, and 400–408), however, the de-parture of the individual spectra from MODTRAN 3.7 are larger (typically up to 10%) even though the details may dif-fer. This discrepancy may rather point to saturation effects due to strong solar Fraunhofer lines not properly accounted for when convolving the high resolution measurements of Kurucz et al. (1984) to the lower resolution balloon-borne, SORCE/SIM, SCIAMACHY and SOLSPEC measurements, than to a real discrepancy.
6 Conclusions
Our study allows the following conclusions and recommen-dations to be made:
1. We report on Eo(λ) measurements by LPMA/DOAS direct Sun observations performed at 32 km altitude. Overall our observation confirms previous Eo(λ) -measurements within the given error bars. According to the discussion given above, the error of the present measurement is dominated by errors arising from the calibration procedure. In particular the dominating er-rors are due to the (1) relatively weak emissivity of the used calibration lamps in the UV-A spectral range, and (2) errors arising from remaining optical alignment er-rors. Certainly, both identified major error sources can further be diminished by taking appropriate measures in future measurements.
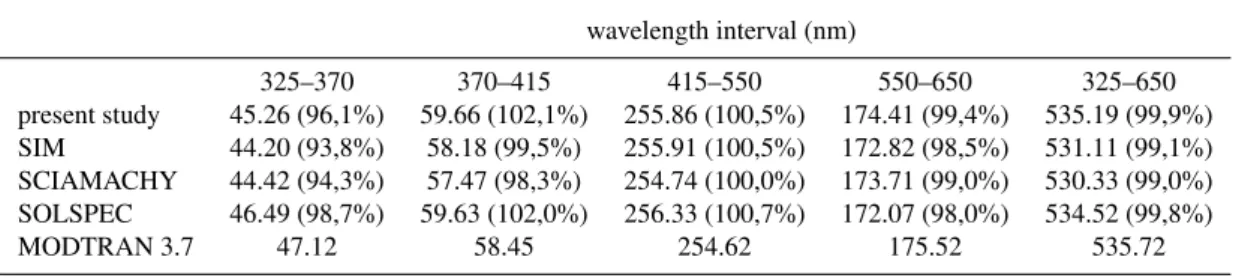
Table 3.Integrated solar irradiance (W/m2) in distinct wavelength intervals. The numbers in the brackets give the solar irradiance relative to MODTRAN 3.7 for dedicated wavelength intervals.
wavelength interval (nm)
325–370 370–415 415–550 550–650 325–650
present study 45.26 (96,1%) 59.66 (102,1%) 255.86 (100,5%) 174.41 (99,4%) 535.19 (99,9%)
SIM 44.20 (93,8%) 58.18 (99,5%) 255.91 (100,5%) 172.82 (98,5%) 531.11 (99,1%)
SCIAMACHY 44.42 (94,3%) 57.47 (98,3%) 254.74 (100,0%) 173.71 (99,0%) 530.33 (99,0%) SOLSPEC 46.49 (98,7%) 59.63 (102,0%) 256.33 (100,7%) 172.07 (98,0%) 534.52 (99,8%)
MODTRAN 3.7 47.12 58.45 254.62 175.52 535.72
interval, discrepancies among the individual spectra of up to 10% are found mostly due to saturation effects due to strong solar Fraunhofer lines not properly accounted for when convolving the high resolution measurements of Kurucz et al. (1984) to the lower resolution balloon, ENVISAT, SOLSPEC and SORCE/SIM measurements. 3. Our study also demonstrates that, the present ESA cal-ibration implemented in the SCIAMACHY level 1 data processor needs to be changed c.f., to the data suggested by the IUP-Bremen re-calibration.
4. Further our study suggests that, by considering the available Eo(λ)-measurements in the UV-A and visible wavelength interval (Table 3), the integrated Eo(λ) is uncertain by as much as∼5 W/m2. Relating this uncer-tainty in Eo(λ)in the UV-A and visible wavelength in-tervals to atmospheric absorption (aA=0.05), transmis-sion (T=0.65), and albedo (A=0.3) of the Earth (IPCC, 2001), leads to the following (estimated) uncertainties when taken on a global average: 1aA=0.065 W/m2,
1T=0.813 W/m2, and1A=0.375 W/m2.
5. Since the solar irradiance is the driving force of the at-mospheric photochemistry, the somewhat lower Eo(λ) found in the 370–410 nm wavelength interval and the systematically lower Eo(λ) in the 327–370 nm wave-lengths range are accordingly expected to lower the photolysis frequencies of some important atmospheric trace gases (e.g., NO2, BrO, OClO, IO, OIO, . . .),
with the consequence of decelerating atmospheric pho-tochemistry.
6. Finally, a better knowledge of Eo(λ) is very help-ful for the solar cell industry (for CuInSe2 or
amor-phous Si cells threshold wavelengths are λ=1378 nm andλ=720 nm, respectively) in order to (fine) adjust the wavelength dependent response of the solar cells. An ASCII version of the Eo(λ)-data is available on the www page http://www.iup.uni-heidelberg.de/institut/ institut/forschung/groups/atmosphere/stratosphere/ and a note should be sent to the authors if they are used for non-scientific purposes.
Acknowledgements. Support of the project by Bundesministerium f¨ur Bildung und Forschung (BMBF) through grant 50EE0017, and 50EE0019. Additional support came through the European Space Agency by the ESABC project (AO 146, AO 465, AO 629 and AO 694). We thank the technical team of LPMA (Y. T´e, P. Jeseck, and V. Ferreira) for the assistance given to perform successfully the balloon flights. We are also grateful to the CNES teams “l’equippe nacelles point´ees” and balloon launching team from Aire-sur-l’Adour/France without which the successful launch of the balloons would have been impossible. We also acknowledge the support given by Physikalisch-Technische Bundesanstalt (PTB) Braunschweig (A. H¨ope und P. Sperfeld) in the commissioning of the absolute radiometric standards.
Edited by: M. Dameris
References
Arking, A.: Absorption of solar energy in the atmosphere: Discrep-ancy between model and observation, Science, 273, 779–782, 1996.
B¨osch, H., Camy-Peyret, C., Chipperfield, M., Fitzenberger, R., Harder, H., Schiller, C., Schneider, M., Trautmann, T., and Pfeil-sticker, K.: Inter comparison of measured and modeled strato-spheric UV/vis actinic fluxes at large solar zenith angles, Geo-phys. Res. Lett., 28, 1179–1182, 2001.
B¨osch, H., Camy-Peyret, C., Chipperfield, M. P., Fitzenberger, R., Harder, H., Platt, U., and Pfeilsticker, K.: Upper limits of strato-spheric IO and OIO inferred from center-to-limb-darkening-corrected balloon-borne solar occultation visible spectra: Impli-cations for total gaseous iodine and stratospheric ozone, J. Geo-phys. Res., 108, D15, 4455, doi:10.1029/2002JD003078, 2003. Bovensmann, H., Burrows, J. P., Buchwitz, M., Frerick, J., No¨el,
S., Rozanov, V. V., Chance, K. V., and Goede, A. H. P.: SCIA-MACHY: Mission Objectives and Measurement Modes, J. At-mos. Sci., 56, 127–150, 1999.
Camy-Peyret, C., Flaud, J. M., Perrin, A., Rinsland, C. P., Goldman, A., and Murcray, F.: Stratospheric N2O5, CH4and N2O profiles
from IR solar occultation spectra, J. Atmos. Chem., 16, 31–40, 1993.
Eichmann, K.-U., Kaiser, J. W., von Savigny, C., Rozanov, A., Rozanov, V., Bovensmann, H., K¨onig, M., and Burrows, J. P.: SCIAMACHY limb measurements in the UV/vis spectral region: first results, Adv. Space Res., 34, 775–779, 2003.
Ferlemann, F., Camy-Peyret, C., Fitzenberger, R., Harder, H., Hawat, T., Osterkamp, H., Perner, D., Platt, U., Schneider, M., Vradelis, P., and Pfeilsticker, K.: Stratospheric BrO profiles mea-sured at different latitudes and seasons: Instrument description, spectral and profile retrieval, Geophys. Res. Lett., 25, 3847– 3850, 1998.
Ferlemann, F., Bauer, N., Fitzenberger, R., Harder, H., Osterkamp, H., Perner, D., Platt, U., Schneider, M., Vradelis, P., and Pfeil-sticker, K.: A new DOAS-instrument for stratospheric balloon-borne trace gas studies, J. Applied Optics, 39, 2377–2386, 2000. Fitzenberger, R., B¨osch, H., Camy-Peyret, C., Chipperfield, M. P., Harder, H., Platt, U., Sinnhuber, B.-M., Wagner, T., and Pfeil-sticker, K.: First Profile Measurements of Tropospheric BrO, Geophys. Res. Lett., 27, 2921–2924, 2000.
Fontenla, J., White, O. R., Fox, P. A., Avrett, E. H., and Kurucz, R. L.: Calculation of solar irradiances, I. Synthesis of the solar spectrum, Astrophys. J., 518, 480–500, 1999.
Frerick, J., Bovensmann, H., No¨el, S., Burrows, J. P., and Dobber, M.: SCIAMACHY on-ground and in-flight calibration, perfor-mance verification and monitoring concepts, edited by: Barnes, W. L., Proc. of SPIE, Earth Observing Systems II, 3117, 176– 187, 1997.
Harder, H., Camy-Peyret, C., Ferlemann, F., Fitzenberger, R., Hawat, T., Osterkamp, H., Perner, D., Platt, U., Schneider, M., Vradelis, P., and Pfeilsticker, K.: Stratospheric BrO Profiles Measured at Different Latitudes and Seasons: Atmospheric Ob-servations, Geophys. Res. Lett., 25, 3843–3846, 1998.
Harder, H., B¨osch, H., Camy-Peyret, C., Chipperfield, M., Fitzen-berger, R., Payan, S., Perner, D., Platt, U., Sinnhuber, B., and Pfeilsticker, K.: Comparison of measured and modeled strato-spheric BrO: Implications for the total amount of stratostrato-spheric bromine, Geophys. Res. Lett., 27 , 3695–3698, 2000.
Harder, J., G. Lawrence, G. Rottman, and T. Woods, The Spec-tral Irradiance Monitor (SIM) for the SORCE Mission, Proc. SPIE, 4135, pp. 204–214, see: http://lasp.colorado.edu/sorce/ presentation/SORCE Brochure 10 25 FINAL.pdf, 2000. Harrison, L., Kiedron, P., Berndt, J., and Schlemmer, J.:
Ex-traterrestrial solar spectrum 360–1050 nm from Rotating Shad-owband Spectroradiometer measurements at the Southern Great Plains (ARM) site, J. Geophys. Res., 108, D14, 4424, doi:10.1029/2001JD001311, 2003.
Hawat, T. M., Camy-Peyret, C., and Torguet, R. J.: A Suntracker for atmospheric remote sensing, Optical Engineering, 37(05), 1633– 1642, 1998.
Huguenin, D.: Design and performance of stratospheric balloon-borne platforms for infrared astrophysical observations, Infrared Phys. Techno., 35 (2/3), 195–202, 1994.
IPCC: Third Assessment Report – Climate Change 2001: WMO, Geneve, Switzerland, 2001.
Kerr, R. A.: Darker clouds promise brighter future for climate mod-els, Science, 267, 454, 1995.
Kurucz, R. L.: The solar spectrum, in: The Solar Interior and Atmo-sphere, edited by: Cox, A. N., Livingston, W. C., and Matthews, M., University of Arizona Press, Tucson, Ariz., 663–669, 1992. Kurucz, R. L., Furenhild, I., Brault, J., and Testermann, L.: Solar
flux atlas from 296 to 1300 nm, National Solar Observatory Atlas No. 1, June 1984, (ftp://ftp.noao.edu/fts/fluxatl), 1984.
Neckel, H. and Labs, D.: The solar radiation between 3300 and 12 500A◦, Sol. Phys., 90, 205–258, 1984.
No¨el, S., Wuttke, M. W., Skupin, J., Bovensmann, H., Burrows, J. P., Gottwald, M., and Krieg, E.: The SCIAMACHY instrument on ENVISAT: First performance monitoring results, Proc. of In-ternational Geoscience and Remote Sensing Symposium (IEEE-IGARSS), Learning from Earth’s shapes and colors, 21–25 July 2003, Toulouse, France, 2003.
Payan, S., Camy-Peyret, C., Lef`evre, F., Jeseck, P., Hawat, T., and Durry, G.: First direct simultaneous HCl and ClONO2
pro-file measurements in the Arctic vortex, Geophys. Res. Lett., 25, 2663–2666, 1998.
Penndorf, R.: Table of the refractive index for standard air and the Rayleigh scattering coefficient for the spectral region between 0.2 to 20.0µm and their application to atmospheric optics, J. Opt. Soc. Am. 47, 176–182, 1957.
Pfeilsticker, K., Sturges, W. T., B¨osch, H., Camy-Peyret, C., Chip-perfield, M. P., Engel, A., Fitzenberger, R., M¨uller, M., Payan, S., and Sinnhuber, B.-M.: Lower stratospheric organic and in-organic bromine budget for the arctic winter 1998/99, Geophys. Res. Lett., 27, 3305–3308, 2000.
Pfeilsticker, K., B¨osch, H., Camy-Peyret, C., Fitzenberger, R., Harder, H., and Osterkamp, H.: First Atmospheric Profile Mea-surements of UV/visible O4Absorption Band Intensities:
Impli-cations for the Spectroscopy, and the Formation Enthalpy of the O2-O2Dimer, Geophys. Res. Lett., 28 , 4595–4598, 2001.
Platt, U. and Stutz, J.: Differential optical absorption spectroscopy (DOAS), Principle and Applications, Springer Verlag Heidel-berg, ISBN 3-340-21193-4, 2004.
Rozanov, A., Rozanov, V., and Burrows, J. P.: A numerical radiative transfer model for a spherical planetary atmosphere: Combined differential-integral approach involving the Picard iterative ap-proximation, JQSRT, 69, 491–512, 2001.
Skupin, J., No¨el, S., Wuttke, M. W., Bovensmann, H., and Bur-rows, J. P.: Calibration of SCIAMACHY in-flight measured ir-radiances and ir-radiances-first results of level 1 validation, Proc. of the Envisat Validation Workshop (SP-531), ESA Publications Division, 2002.
Thuillier, G., Hers´e, M., Simon, P. C., Labs, D., Mandel, H., and Gillotay, D.: Observation of the UV solar irradiance between 200 and 350 nm during the ATLAS-1 mission by the SOLSPEC spectrometer, Sol. Phys., 171, 283–302, 1997.
Thuillier, G., Hers´e, M., Simon, P. C., Labs, D., Mandel, H., Gillotay, D., and Foujols, T.: The visible solar spectral irradiance from 350 to 850 nm as measured by the SOLSPEC spectrometer during the ATLAS-1 mission, Sol. Phys., 177, 41–61, 1998a. Thuillier, G., Hers´e, M., Simon, P. C., Labs, D., Mandel, H., and
Von Savigny, C., Rozanov, A., Bovensmann, H., Eichmann, K.-U., Kaiser, J. W., No¨el, S., Rozanov, V. V., Sinnhuber, B.-M., Weber, M., and Burrows, J. P.: The Ozone hole break-up in September 2002 as seen by SCIAMACHY on ENVISAT, J. Atmos. Sci., 62(3), 721–734, 2005a.
Von Savigny, C., Kokhanovsky, A., Bovensmann, H., Eichmann, K.-U., Kaiser, J., No¨el, S., Rozanov, A. V., Skupin, J., and Bur-rows, J. P.: NLC Detection and Particle Size Determination: First Results from SCIAMACHY on ENVISAT, Adv. Space. Res., 34(4), 851–856, 2005b.
Walker, K. D., Saunders, R. D., Jackson, J. K., and Mc Sparron, D. A.: Spectral Irradiance Calibration, NBS Special Publication, 250–20, 1987.
Wehrli, C.: Extraterrestrial solar spectrum, Publ. 615, Phys.-Meteorol. Obs., Davos and World Radiat. Cent., Davos-Dorf, Switzerland, 1985.


![Fig. 2. Measured solar irradiance ratio (ln[E(λ)/E o (λ)]) for vis- vis-ible spectrometer at 3 wavelengths (upper panel: 451.6 nm, mid-dle panel: 544.6 nm, lower panel: 580.9 nm) inferred for the Aire-sur-l’Adour/France measurement at ∼32 km (83 ◦ <SZ](https://thumb-eu.123doks.com/thumbv2/123dok_br/18398107.358349/7.892.465.820.94.354/measured-irradiance-spectrometer-wavelengths-inferred-adour-france-measurement.webp)