Adv. Sci. Res., 12, 147–155, 2015 www.adv-sci-res.net/12/147/2015/ doi:10.5194/asr-12-147-2015
© Author(s) 2015. CC Attribution 3.0 License.
EMS
Ann
ual
Meeting
&
10th
European
Conf
erence
on
Applied
Climatology
(ECA
C)
UV and global irradiance measurements and analysis
during the Marsaxlokk (Malta) campaign
J. Bilbao1, R. Román1, C. Yousif2, D. Mateos1, and A. de Miguel1
1University of Valladolid, Spain, Atmosphere & Energy Laboratory, Faculty of Sciences, Valladolid, Spain 2University of Malta, Institute for Sustainable Energy, Marsaxlokk, Malta
Correspondence to:J. Bilbao (juliab@fa1.uva.es)
Received: 14 January 2015 – Revised: 17 June 2015 – Accepted: 22 June 2015 – Published: 09 July 2015
Abstract. A solar radiation measurement campaign was performed in the south-eastern village of Marsaxlokk
(35◦50′N; 14◦33′E; 10 m a.s.l), Malta, between 15 May and 15 October 2012. Erythemal solar radiation data
(from a UVB-1 pyranometer), and total horizontal solar radiation (global and diffuse components) from two CM21 pyranometer were recorded. A comparison of atmospheric compounds from ground measurements and satellites shows that TOC (total ozone column) data from the Ozone Monitoring Instrument OMI, TOMS and DOAS algorithms correlate well with ground-based recorded data. The water vapour column and the aerosol optical depth at 550 nm show a significant correlation at the confidence level of 99 %. Parametric models for evaluating the solar UV erythemal (UVER), global (G) and diffuse (D) horizontal irradiances are calibrated, from which aerosol effects on solar irradiance are evaluated using the Aerosol Modification Factor (AMF). The AMFUVERvalues are lower than AMFG, indicating a greater aerosol effect on UVER than on global solar irradiance. In this campaign, several dust event trajectories are identified by means of the HYbrid Single-Particle Lagrangian Integrated Trajectory (HYSPLIT) model and by synoptic conditions for characterizing desert dust events. Hence, changes in the UV index due to atmospheric aerosols are described.
1 Introduction and objectives
The UV erythemal (UVER) radiation affects human health (short-term effects include erythema or sunburn and long-term effects include photo-ageing/skin cancer), damages aquatic life, and affects plants as well as the conservation and durability of materials, in addition to impacting global en-ergy balance and climate change (UNEP, 2010). Yet, not all its effects are harmful, with the synthesis of vitamin D being one of the beneficial effects of UV (Webb, 2006; Fioletov et al., 2009). Different action spectra are used to quantify these effects. McKinlay and Diffey (1987) established the erythe-mal action spectrum, which represents the spectral response of human skin to UV radiation being able to trigger erythema (or sunburn). Solar radiation weighted using this spectrum is called erythemal radiation (UVER; 280–400 nm) (Webb et al., 2011; CIE, 1998).
Various authors have proposed new models for estimat-ing solar irradiance (e.g. Mateos et al. (2010) who assessed
ultraviolet and global cloud modification factors in central Spain). The attenuation of UVER by different atmospheric components has been analysed by De Miguel et al. (2011); the results confirm that small aerosols scatter more solar UV wavelengths than larger ones.
Román et al. (2013) described the effects of a desert dust episode at Granada (Spain) on global, direct and diffuse spec-tral UV irradiance, and reported that the attenuation of direct UV was about 50 %, while the diffuse irradiance increased by up to 40 %. Authors such as Pace et al. (2006) have stud-ied the influence and identification of different aerosol types at Lampedusa Island (Central Mediterranean); their observa-tions were combined with air mass trajectories in order to identify different types of particles and to determine their mean optical properties.
Both effects contribute to cooling the Earth’s surface and si-multaneously warming the lower atmosphere (IPCC, 2007).
The aerosol radiative forcing in the Central Mediterranean has also been studied (Gómez-Amo et al., 2011); the results show the effects of different aerosols on the radiative budget during a dust event within the boundary layer. The sensitiv-ity of shortwave radiative fluxes to changes in the vertical distribution of aerosols and a case of Sahara dust layer above urban aerosols have also been studied (Gómez-Amo et al., 2010; Kaskaoutis et al., 2010a, b).
The present work seeks to explore the influence of aerosols on solar irradiance in the area of Malta. In the study, para-metric models for evaluating solar UVER, global (G) and diffuse (D) horizontal irradiances under cloudless conditions were calibrated, from which the aerosol Modification factor (AMF) was evaluated. The models are a function of the so-lar zenith angle (SZA), the total ozone column (TOC), and the aerosol optical depth at 550 nm (AOD550). The models were validated through a graphical comparison of measured and estimated data and by different statistical indices (Bil-bao et al., 2014). Atmospheric ground reference data were compared to those retrieved from satellites; the agreement was assessed. In this campaign, several dust event trajecto-ries were identified by means of the HYbrid Single-Particle Lagrangian Integrated Trajectory (HYSPLIT) model and by the synoptic conditions (Bilbao et al., 2014). Changes in the UV index due to atmospheric aerosols were thus described.
In the following sections, the site description, instrument and data collection are detailed, the methodology is ex-plained, and the observations and results are analyzed in re-lation with the influence of aerosols on UVER, G and D irra-diances.
2 Site and instrumentation
2.1 Measurement site
The Universities of Malta and Valladolid (Spain) conducted a solar radiation measurement campaign, which took place at the Institute for Sustainable Energy in the south-eastern village of Marsaxlokk (35◦50′N; 14◦33′E; 10 m a.s.l.),
Malta. Measurements were recorded between May and Oc-tober 2012. The campaign involved two European Institution Groups: the Institute for Sustainable Energy at the University of Malta, and the Atmosphere and Energy Laboratory at the University of Valladolid, Spain. Solar radiation instruments used for this study were located on the rooftop of the Insti-tute for Sustainable Energy, which had an obstruction-free horizon.
2.2 Ground-based instruments
Global and diffuse horizontal irradiance were recorded using two CM21 (Kipp & Zonen) pyranometers, one of which was equipped with a shadow-band. Diffuse solar irradiance data
were corrected following the method proposed by Batlles et al. (1995) and Perez et al. (1990) that take into account ge-ometric and atmospheric (clearness index) corrections. The sampling rate of the global and diffuse irradiance pyranome-ters was 10 s although measurements were averaged and recorded at 1 and 10 min. As a result, 10 min solar irradiance measurements were obtained. The CM21 (Kipp & Zonen) in-struments have a flat spectral response from 305 to 2800 nm and the cosine effect is below 3 % for a solar elevation above 10◦. The CM21 sensors were regularly calibrated by
com-parison with a reference sensor at the Kip & Zonen manufac-turer; the differences obtained were below 2 % (Bilbao et al., 2014).
The UVER measurements were recorded using a Yankee Environmental Systems (YES) UVB-1 radiometer, which has a spectral range between 280 and 400 nm and a spectral sensitivity which resembles the erythemal action spectrum. The UVB-1 sensor is designed to operate continuously and autonomously in the field (Esteve et al., 2009). The cosine response is greater than±5 % for solar zenith angles (SZA) below 60◦. This instrument is calibrated by the standard rules
in the National Institute for Aerospace Technology (INTA) in Spain. The calibration consists of measuring the spectral response of the sensor indoors and comparing with a Brewer MKIII spectroradiometer outdoors. After this process, a dou-ble input matrix with the calibration factors depending on SZA and the total ozone column (TOC) was obtained us-ing a radiative transfer model (Hülsen and Gröbner, 2007). The error given by the calibration matrix is below 9 % for a SZA of less than 70◦. The output-voltage signal of the
sen-sor is converted into units of erythemal irradiance (W m−2)
by multiplying the signal voltage by the calibration factor ob-tained from the matrix, taking into account the average SZA during the 10 min measure and the daily TOC. The experi-mental uncertainty of the sensor according to the results is in the 4.6–7 % range (De Miguel et al., 2012).
A Solar Light Microtops-II manual Sun photometer was used throughout the campaign to measure TOC and AOD at 1020 nm (AOD1020), and water vapour column. The Microtops-II Sun photometer is equipped with five optical collimators, with a field of view of 2.5◦, to perform
di-rect radiation measurements at the following nominal wave-lengths: 305, 312, 320, 936, and 1020 nm. The instrument is calibrated every two years at the Mauna Loa Observatory (Hawaii) by Solar Light Company (Glenside, PA), further de-tails are available in De Miguel et al. (2011). Furthermore, an inter-comparison of ozone data between the Microtops-II and the Brewer spectrometer was performed at Lampedusa island (in the Central Mediterranean) over five days. The dif-ferences observed between the TOC estimations of the two instruments were below 2 % (Mateos et al., 2014b). More details concerning solar irradiance sensors are given in De Miguel and Bilbao (2005).
10 s from which 10 min average values were computed and stored. There are 6 readings for every 10 min rintervals in an hour which were added together providing a single hourly reading. Hourly and daily irradiances were then evaluated from the 10 min average values (Bilbao and de Miguel, 2013). Data were transmitted continuously from data-logger to the Atmosphere and Energy Laboratory via web. Measure-ments were collected in Greenwich Mean Time (GMT).
2.3 Satellite-borne instruments
TOC, aerosol optical depth measured at 550 nm wavelength (AOD550), and precipitable water column (w), were retrieved from a satellite sensor (MODIS OMI). During the cam-paign, whenever the Microtops TOC measurements were not available because of cloudy conditions, data from the Ozone Monitoring Instrument (OMI; onboard Aura satel-lite) were used. If TOC from OMI was not available, data from the Global Ozone Monitoring Experiment-2 instrument (GOME-2; onboard MetOp-A satellite) were used. These satellite-based data were obtained from the Aura Validation Data Centre (AVDC: http://avdc.gsfc.nasa.gov) as overpass files. The TOC from OMI retrieved by the TOMS (OMIT-OMS) and DOAS (OMIDOAS) algorithms, and the TOC re-trieved from GOME-2 (GOME2) were compared with Mi-crotops measurements, and showed a high correlation be-tween ground based and satellite-based TOC for the three databases. OMITOMS was seen to be the most similar TOC data series to ground measurements, followed by OMIDOAS and then GOME-2. The comparison can be found in Bilbao et al. (2014). The correlations obtained between the sun pho-tometer and satellite TOC retrieved daily values are shown and compared in Bilbao et al. (2014), with RMSE values ing below 2.5 %. In addition, the correlation coefficient be-tween the OMI and Microtops-II TOC daily data of 0.95, the frequency distribution of the differences showed a standard deviation of 6 DU and also a RMSE of 2.2 % were obtained during a two month campaign in Trisaia campaign, Southern Italy (Mateos et al., 2014a).
Water-vapour column data were also obtained from noon measurements of the MODIS instrument (Moderate Resolu-tion Imaging Spectroradiometer) on board the Terra satel-lite, using MODIS infrared channels. Comparisons of this MODIS product against ground-based water-vapour mea-surements in a Mediterranean region show that the combined uncertainty of MODIS water vapour increases from 0.38 to 0.52 cm whenwrises from 0.5 to 3 cm. This may be found in Román et al. (2014).
The AOD550, was also obtained from the MODIS in-strument on board the Terra satellite and the results were considered as constant daily values. The uncertainty in the AOD550daily values from MODIS was evaluated by the ex-pression proposed by Kaufman et al. (1997). The Ångström exponent values were also observed from daily AERONET (http://aeronet.gsfc.nasa.gov/new_web/index.html) data at
the nearest Italian station of Lampedusa (35.52◦N; 12.63◦E;
45 m a.s.l.) (Meloni et al., 2003) and from MODIS. AOD1020 was calculated using the Ångström exponent and the AOD550 from MODIS. Comparisons of Microtops II AOD1020values and calculated AOD1020show a difference of 0.06 % (Bilbao et al., 2014).
The MODIS data used in this work were downloaded from the GIOVANNI application (http://disc.sci.gsfc.nasa. gov/giovanni/overview/index.html) as a spatial the average value in a 0.2◦×0.2◦ square with centre at the Institute for
Sustainable Energy, Marsaxlokk, Malta.
3 Methodology
3.1 Modelling
Parametric models for evaluating solar UVER and horizon-tal global and diffuse irradiances under cloudless condi-tions were used; they are called the UVER, Global and Dif-fuse Model, respectively. The UVER model is based on an analytical expression for clear-sky conditions proposed by Madronich (2007). The Global model was derived from the analytical relation between the horizontal global solar irradi-ance, G, and the cosine of SZA. It has been observed (Bil-bao et al., 2014) that G is a linear function of SZA, whileD shows a power function with SZA. The inputs to the UVER model consist of SZA and TOC values. The input to the Global model is SZA and to the Diffuse model the SZA and the AOD. The algorithms of the models are detailed in Ta-ble 1.
Data from 15 May to 31 July 2012 were used to estimate the model coefficients and data from 1 August to 15 October 2012 were used for model validation. Statistical indices such as the mean bias, root mean square errors, square fits and correlation coefficients, were used for model validation.
3.2 Statistical estimators used
The accuracy of the different models was assessed by means of two widely used statistics: the root mean square error (RMSE) and mean bias error (MBE). The following expres-sions for RMSE and MBE, as a percentage of the measured average value, are used:
RMSE (%)=100 xave
" n X
i=1
(xisim−ximea)2/ n #0.5
(1)
MBE (%)=100 xave
" n X
i=1
(xisim−ximea)/ n #
, (2)
wherenis the number of data points,xisimis the ith simulated
value,ximeais theith measured value, andxaveis the mean
of the measured values. The estimators were calculated for each models.
Table 1.UVER, global and diffuse solar horizontal irradiance calibrated models under cloudless conditions, calibration coefficients and their expanded uncertainty, during the period May to October 2012 at Marsaxlokk, Malta.
Clear sky models Solar irradiance Coefficients
UVER UVER=a(cosSZA)b
TOC 300
c
a=0.270±0.002 W m−2 b=2.417±0.002 c= −0.78±0.02
Global G=a(cosSZA)b a=1032±14 W m−2
b=1.279±0.002
Diffuse D=a(cosSZA)b
AOD 550 0.05
c
a=90.2±0.9 W m−2 b=0.451±0.009 c=0.274±0.006
Aerosol modification factor AMF=GGmeasured clear sky
Table 2.Estimation of solar UVER, global and diffuse irradiance values by means of linear regressions for clear-sky conditions in Marsaxlokk, Malta in the period August to October 2012.
Estimated=a×measured+b
a b(W m−2) r
UVER 0.972±0.004 0.0023±0.0004 0.995 Global 1.001±0.004 −7±4 0.995 Diffuse 1.004±0.016 13.4±1.6 0.921
desert dust. The agreement between the measured solar irra-diance data and the estimated values was also assessed by de-termining the percentages of the estimated values that agree with the ±10,±20 and ±30 % of the measured reference data, which are denoted asW10,W20 andW30(%) (Tanska-nen et al., 2007).
3.3 AMF
In order to evaluate the aerosol effect, the AMF was defined as the relation between the measured solar irradiance and the cloudless sky one under the same atmospheric conditions.
AMF= SRaerosol
SRaerosol-free, (3)
where SRaerosol and SRaerosol−freerepresent solar irradiance
under the corresponding conditions. AMF is the ratio of clear-sky solar irradiance with the atmosphere containing aerosols to that solar irradiance recorded under cloudless conditions and an atmosphere without aerosol, for the same SZA and TOC values. In this work, we compare two adjacent days that verify these conditions (26th with aerosols and 25th aerosol free).
3.4 Air mass trajectories
The HYSPLIT model http://ready.arl.noaa.gov/HYSPLIT. php was used to evaluate air mass backward trajectories in order to describe the influence of aerosols on solar irradi-ance. The input data for a backward trajectory evaluation are: measurement station, considered as the final position of the backward trajectory (35◦50′N; 14◦33′E); 72 h duration,
concluding at 12:00 UTC; the day analyzed the trajectories at three heights above sea level, 500, 1500 and 3000 m. The dates analyzed are 25, 26, 27 August 2012.
3.5 Atmospheric component correlations
Satellite atmospheric component data were compared with ground-based data; frequency histograms were generated be-fore analyzing their influence on solar irradiances. As ob-served by Koepke et al. (2002), AOD550depends on humid-ity. In this paper, the relation between AOD1020 and water-apour column was evaluated, and the correlation and its sig-nificance was also calculated. In addition, the comparison of TOC measurements from the Microtops and from the OMI-TOMS, OMI-DOAS and GOME-2 sensors was carried out and their uncertainty frequency distributions were plotted so as to verify the agreement between the two data series. The linear fit of calculated AOD1020 data from MODIS versus AOD1020data from Microtops was performed. The correla-tion coefficient value and the frequency distribucorrela-tion of the difference of its values were evaluated so as to study the agreement between MODIS and Microtops data.
3.6 UVI evaluation
cal-ibration coefficient in order to convert it to erythemal UV-B irradiance. The calibration coefficient depends on SZA and TOC, this coefficient being obtained each time by interpo-lation in a matrix calibration. Once the raw signal is con-verted into erythemal UV-B irradiance (W m−2), this amount is multiplied by 40 m2W−1in order to convert it into UVI as indicated in WHO (2002). The influence of aerosol desert dust on UVI was also studied. This evaluation also serves as an important vehicle to raise public awareness and to alert people vis-à-vis the need to adopt protective measures when exposed to UV radiation.
4 Results
After examining the campaign data series, it was observed that on cloudless days, the diffuse horizontal irradiance in-creases with increasing atmospheric water vapour. The lin-ear fit between AOD550 from MODIS andw from MODIS shows a correlation coefficient of 0.51, with a confidence in-terval of (0.160–0.751), at a 99 % confidence level, and a p value of 0.00041. In addition, w uncertainty for the Mi-crotops and MODIS data were evaluated and a standard de-viation of the residuals of 0.5 cm was obtained. The linear fit between TOC correlation coefficients between 0.95 and 0.86, while the frequency distribution of the differences is in the range from 4.5 to 7.6 DU and a standard deviation value of 6 DU was obtained; this result can be used as uncertainty of satellite-derived TOC. A similar evaluation can be found in Román et al. (2014).
4.1 Estimated vs. ground-based measurements
In this study, three different models for UVER, global and diffuse irradiance under cloudless conditions were cali-brated. The data set for the calibration models contain 10 min clear sky data for May, June and July 2012, a total of 684 10 min values. For the evaluation period (August, Septem-ber and OctoSeptem-ber), a total of 650 data points were used. The solar irradiance clear-sky model expressions and coefficient values are shown in Table 1. The UVER model fits as a SZA cosine and TOC power function. The solar global horizon-tal irradiance fits as a function of cos(SZA) cosine, and the solar diffuse horizontal irradiance is a function of cos(SZA) and AOD550. Similar results have been obtained by Bilbao et al. (2014) when studying the effects of atmospheric compo-nents on UVER and horizontal irradiances. A model relating clear sky UV-B irradiance with SZA and TOC was developed by Dubrovsky (2000) at two stations in the Czech Republic.
Model validations have been evaluated using scatterplots. Figure 1 consists of three scattered graphs, and the diago-nal line represents the ideal match between the estimated and measured values. Table 2 shows the linear regression equations and the correlation coefficient, r, between mea-sured and estimated values. It is observed that UVER and the global solar models show the highest correlation
coeffi-cients of 0.995. The diffuse model obtains a lower correlation coefficient of 0.921.
Table 3 shows the model performance, namely mean mea-sured and mean estimated values, the RMSE, MBE devi-ations and the Wi (%) variation coefficients between the
measured and the estimated values. The Wi coefficients for
UVER indicate that 86.7 % of the data exhibit a variation within±10 % in respect of the measured data, and 96.9 % of the data a variation within±20 %. From Table 3, it can be deduced that 94.6 % of the global solar data show a variation within±10 % compared to the measured data. A similar val-idation coefficient analysis was used by Mateos et al. (2013) and Tanskanen et al. (2007).
4.2 Case study: desert aerosols
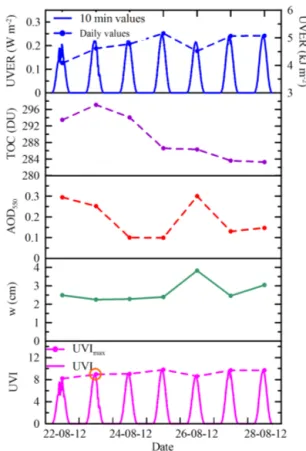
Figure 2 shows the 10 min evolution and daily value of UVER and UVI 10 min evolution and UVI daily maximum values from the 22 to 28 August 2012. 25 and 26 August were classified as cloudless days; however, recorded UVER and calculated UVI decreased on 26 August. In addition, TOC dropped from 296 to 286 DU starting with on 23 August, AOD550increased on 26 August only, and UVI increased on 25 August and decreased again on 26 August. While TOC does not show any change (< 1 DU), AOD shows a differ-ence of two units, from 0.10 on 25 to 0.3 on 26 August. Al-though 27 August was not classified as a cloudless day, it can be observed that the mean daily UVER and AOD values are similar to those for 25 August.
As regards the UVI values, 25 August shows a maxi-mum with 9.8, which drops to 8.6 on 26 August and in-creases to 9.7 on 27 August. It is also observed that cloudless days with high AOD and water vapour value of 3.8±0.5 cm coincide with a decrease in UVI and UVER, and an in-crease in daily diffuse horizontal irradiance, which value was 5.05±0.02 MJ m−2on 26 August 2012.
In addition to this, it is known (Bilbao et al., 2014) that UVER irradiance does not depend onwbecause whas no absorption bands in the UV range. It was obtained that w reduces G irradiance between −2.44 and −4.53 % cm−1, and D irradiance increasing with w between 42.15 % cm−1
and 20.30 % cm−1 from low to high SZA angles. It has
Table 3.Statistical estimators for the comparison of measured and estimated 10 min UVER, global and diffuse solar irradiance at Marsaxlokk, Malta during the period August to October 2012.
Mean (Wm−2) MBE (%) RMSE (%) W
10(%) W20(%) W30(%) Measured Estimated
UVER 0.115 0.114 0.22 6.56 86.7 96.9 100.0
Global 602.6 595.7 −0.90 4.52 94.6 98.8 99.6
Diffuse 110.6 103.7 −0.66 19 68.0 80.7 92.7
Figure 1.Comparison of 10 min measured and estimated UVER (left), global (centre) and diffuse (right) solar irradiances under cloudless conditions during the period May to October 2012 at Marsaxlokk. Red line is the regression fit. Blue line is the 1:1 line.
Figure 2.10 min and mean daily values of UVER and UVI, and TOC, AOD550andwfrom satellites at Marsaxlokk in the period 22–28 August 2012.
4.3 Air-mass trajectories
Figure 3 shows the daily backward trajectories on 25, 26 and 27 August 2012. It can be observed that on 25 August, the air masses come from the eastern Mediterranean, that the situa-tion changes on 26 August when the air masses come from the African continent. The air mass at 3000 m crosses Africa at very low altitude and might explain the high aerosol con-tent. The situation changes on 27 August when the air masses come from the Iberian Peninsula. As a result, it is concluded that 26 August was characterized by a dust event from Africa.
4.4 AMF
AMF was calculated so as to determine the impact of AOD on horizontal solar radiation. For these evaluations, mea-surements on 25 August (cloudless sky) were used as ref-erence measurements for an aerosol-free atmosphere. The AMFs were evaluated for erythemal UVER (AMFUVER), so-lar global (AMFG), and diffuse (AMFD) solar components.
An aerosol intrusion from Africa was described on 26 Au-gust 2012. In addition, we evaluate the AMF, defined pre-viously, using 25 August measurements as a reference for an aerosol-free atmosphere. In this way, erythemal UVER, global horizontal and diffuse (AMFUVER), (AMFG) and (AMFD) were calculated, respectively. First, from the data series it is observed that on 26 August, Fig. 2, the water-vapour column increases to a value of 4.0 cm and the diffuse irradiation to a value of 5.3 MJ m−2day−1 due to a desert
Figure 3.Air-mass backward trajectories at 500, 1500 and 3000 m a.g.l. obtained from NCEP/NCAR reanalysis data and HYSPLIT model at Marsaxlokk in the period 25–27 August 2012.
Figure 4. Daily evolution Aerosol Amplification Factors,
AMFUVER(purple) AMFG(blue) and AMFD(red), on 26 August 2012 at Marsaxlokk, Malta.
The AMFs were evaluated for 26 August. The influence of aerosol events on UVER, global and diffuse solar irradiances is compared in Fig. 4. The results show that AMFUVER (pur-ple) values increase from 0.8 to 0.9 after four o’clock GMT. The AMFGdoes not show changes during the day; its value is around 0.9. On 26 August, the AMFDshows high values in the morning and lower in the afternoon, and AMFDvalues are higher than one throughout the whole day. The AMFUVER shows lower values than AMFG, indicating a more important aerosol effect on erythemal than on global solar irradiance, similar result having been obtained by Bilbao et al. (2014). In the afternoon, AMFD decreases, probably due to a fall in the aerosol concentration. This result may be confirmed tak-ing into account the air mass origin in Fig. 3 (27 August). The desert dust event observed in Malta with MODIS data of AOD550 and air-mass back trajectories is also
corrobo-rated with the evolution (not shown here) of aerosol proper-ties (AOD), Ångström exponent, among others at the nearby site of Lampedusa island (e.g., Meloni et al., 2003).
5 Conclusions
A solar radiation measurement campaign was carried out in the south-eastern village of Marsaxlokk (35◦50′N; 14◦33′E;
10 m a.s.l), Malta, between 15 May and 15 October 2012. Observations of erythemal (UVER; 280–400 nm) and global and diffuse horizontal irradiances (G; D; 305–2800 nm), TOC, water-vapour column, AOD and Ångström exponent were performed during the campaign, in south-east Malta.
The agreement of satellite-derived data with ground-based measured data was studied so as to validate satellite data. The TOC daily values from OMI were compared with Microtops measurements and the results showed a high correlation coef-ficient of 0.95. The frequency distribution of the differences showed a standard deviation of 6 DU. The daily water vapour column measured by Microtops and retrieved from MODIS was compared and the frequency distribution of the differ-ences showed a standard deviation of 0.5 cm. A comparison between AOD1020from MODIS and from Microtops showed a correlation coefficient of 0.68 and an RMSE of 0.6. The fre-quency distribution of said values have a standard deviation of 0.06.
Aerosol effects have been considered as a case study of dessert aerosol influence. The AMFs were evaluated on 26 August. The influence of the aerosol events on UVER, global and diffuse solar irradiances was compared. The re-sults showed that on 26 August 2012, the AMFUVER and AMFGchanged during the day and their values were around 0.9. The AMFDshowed high values in the morning and lower in the afternoon. The AMFUVERdisplays lower values than AMFG, pointing to a more important effect of aerosols on erythemal solar irradiance than on global. A similar result was obtained by Bilbao et al. (2014). The evolution of the AMFD values was due to an increase in AOD observed by daily backward air-mass trajectories. In the afternoon, both AMFDand AMFUVERdecreased, probably due to a drop in aerosol concentration. This result may be confirmed taking into account the air-mass origin in Fig. 3 (27 August).
The Supplement related to this article is available online at doi:10.5194/asr-9-147-2015-supplement.
Acknowledgements. The authors gratefully acknowledge the
support of the Spanish Research and Economy Ministry through Projects CGL2010-25385 and CGL2010-12410-E. The authors also would like to thank the European Space Agency for satellite products, as well as the principal investigator D. Meloni for making the Lampedusa AERONET data available. The authors also thank the NOA Research Reanalysis department for the data obtained.
Edited by: M. Piringer
Reviewed by: two anonymous referees
References
Batlles, F. J., Olmo, F. J., and Alados-Arboledas, L.: On shadow-band correction methods for diffuse irradiance measurements, Sol. Energy, 54, 105–114, 1995.
Bilbao, J. and Miguel, A.: Contribution to the study of UV-B solar radiation in Central Spain, Renew. Energy, 53, 79–85, 2013. Bilbao, J., Román, R., and De Miguel, A.: Total ozone column,
wa-ter vapour and aerosol effects on erythemal total solar shortwave irradiance in Marsaxlokk, Malta, Atmos. Environ., 99, 508–518, doi:10.1016/j.atmosenv.2014.10.005, 2014.
CIE (Commission Internationale de l’ Eclairage): Erythema Refer-ence Action Spectrumand Standard Erythema Dose, CIE S007E-1998, CIE Central Bureau, Vienna, Austria, 1998.
De Miguel, A. and Bilbao, J.: Test reference year generation from meteorological and simulated solar radiation data, Sol. Energy, 78, 695–703, doi:10.1016/j.solener.2004.09.015, 2005.
De Miguel, A., Mateos, D., Bilbao, J., and Román, R.: Sensitivity analysis of ratio between ultraviolet and total shortwave solar ra-diation to cloudiness, ozone, aerosols and precipitable water, At-mos. Res., 102, 136–144, doi:10.1016/j.atmosres.2011.06.019, 2011.
De Miguel, A., Bilbao, J., Román, R., and Mateos, D.: Measure-ments and attenuation of erythemal radiation in Central Spain, Int. J. Climatol., 32, 929–940, doi:10.1002/joc.2319, 2012. Dubrovsky, M.: Analysis of UV-B irradiances measured
simultane-ously at two stations in the Czech-Republic, J. Geophys. Res., 105, 4907–4913, doi:10.1029/1999JD900374, 2000.
Esteve, A. R., Martinez-Lozano, J. A., Marin, M. J., Estelles, V., Tena, F., and Utrillas, M. P.: The influence of ozone and aerosols on the experimental values of UV erythemal radiation at ground level in Valencia, Int. J. Climatol., 29, 2171–2182, doi:10.1002/joc.1847, 2009.
Fioletov, V. E., McArthur, L. J. B., Mathews, T. W., and Marrett, L.: On the relationship between erythemal and vitamin D ac-tion spectrum weighted ultraviolet radiaac-tion, J. Photochem. Pho-tobiol. B Biol., 95, 9–16, doi:10.1016/j.jphoPho-tobiol.2008.11.014, 2009.
Gómez-Amo, J. L., DiSarra, A., Meloni, D., Cacciani, M., and Utril-las, M. P.: Sensitivity of shortwave radiative fluxes to the vertical distribution of aerosol single scattering albedo in the presence of a desert dust layer, Atmos. Environ., 44, 2787–2791, 2010. Gómez-Amo, J. L., Pinti, V., Di Iorio, T., Di Sarra, A., Meloni, D.,
Becagli, S., Bellantone, V., Cacciani, M., Fua, D., and Perrone, M. R.: The June 2007 Saharan dust event in the central Mediter-ranean: Observations and radiative effects in marine, urban, and sub-urban environments, Atmos. Environ., 45, 5385–5393, 2011. Hülsen, G. and Gröbner, J.: Characterization and calibration of ultraviolet broadband radiometers measuring erythemally weighted irradiance, Appl. Opt., 46, 5877–5886, 2007.
IPCC: Climate change 2007-the physical science basis: Working group I contribution to the fourth assessment report of the IPCC (Vol. 4), edited by: Solomon, S., Cambridge University Press, 129–235, 2007.
Kaskaoutis, D. G., Nastos, P. T., Kosmopoulos, P. G., and Kam-bezidis, H. D.: The combined use of satellite data, air-mass trajectories and model applications for monitoring dust trans-port over Athens, Greece, Int. J. Remote Sens., 31, 5089–5109, doi:10.1080/01431160903283868, 2010a.
Kaskaoutis, D. G., Kosmopoulos, P. T., Kambezidis, H. D., and Nastos, P. T.: Identification of the Aerosol Types over Athens, Greece: The Influence of Air-Mass Transport, Adv. Meteorol., 2010, 15 pp., doi:10.1155/2010/168346, 2010b.
Kaufman, Y. J., Tanré, D., Remer, L. A., Vermote, E. F., Chu, A., and Holben, B. N.: Operational remote sensing of tropospheric aerosol over land from EOS moderate resolution imaging spec-troradiometer, J. Geophys. Res., 102, 17051–17076, 1997. Koepke, P., Reuder, J., and Schwander, H.: Solar UV radiation and
its variability due to the atmospheric components, Recent Res. Dev. Photochem. Photobiol., 6, 11–34, 2002.
Madronich, S.: Analytic formula for the clear-sky UV index, Pho-tochem. Photobiol., 83, 1537–1538, 2007.
Mateos, D., De Miguel, A., and Bilbao, J.: Empirical models of UV total radiation and cloud effect study, Int. J. Climatol., 30, 1407– 1415, doi:10.1002/joc.1983, 2010.
Mateos, D., Pace, G., Meloni, D., Bilbao, J., Di Sarra, A., de Miguel, A., Casasanta, G., and Min, Q.: Observed influ-ence of liquid cloud microphysical properties on ultraviolet surface radiation, J. Geophys. Res.-Atmos., 119, 2429–2440, doi:10.1002/2013JD020309, 2014a.
Mateos, D., Di Sarra, A., Bilbao, J., Meloni, D., Pace, G., de Miguel, A., and Casasanta, G.: Spectral attenuation of global and diffuse UV irradiance and actinic flux by clouds, Q. J. Roy. Me-teorol. Soc., 141, 109–113, doi:10.1002/qj.2341, 2014b. Meloni, D., Marenco, F., and Di Sarra, A.: Ultraviolet radiation and
aerosol monitoring at Lampedusa, Italy, Ann. Geophys. Italy, 46, 373–383, 2003.
McKinlay, A. F. and Diffey, B. L.: A Reference Action Spectrum for Ultraviolet Induced Erythema in Human Skin, Commission Internationale de l’Eclairage (CIE), 6, 17–22, 1987.
Pace, G., di Sarra, A., Meloni, D., Piacentino, S., and Chamard, P.: Aerosol optical properties at Lampedusa (Central Mediter-ranean). 1. Influence of transport and identification of dif-ferent aerosol types, Atmos. Chem. Phys., 6, 697–713, doi:10.5194/acp-6-697-2006, 2006.
Perez, R., Ineichen, P., and Seals, R.: Modelling daylight availabil-ity and irradiance components from direct and global irradiance, Sol. Energy, 44, 271–289, 1990.
Román, R., Antón, M., Valenzuela, A., Gil, J. E., Lymani, H., de Miguel, A., Olmo, F. J., Bilbao, J., and Alados-Arboledas, L.: Evaluation of the desert dust effects on global, direct and diffuse spectral ultraviolet irradiance, Tellus B, 65, 19578, doi:10.3402/tellusb.v65i0.19578, 2013.
Román, R., Bilbao, J., and de Miguel, A.: Uncertainty in water vapor column, aerosol optical depth and Angström Exponent, and its effect on radiative transfer simulations in the Iberian Peninsula, Atmos. Environ., 89, 556–569, doi:10.1016/j.atmosenv.14.02.027, 2014.
Tanskanen, A., Lindfors, A., Määttä, A., Krotkov, N., Herman, J., Kaurola, J., Koskela, T., Lakkala, K., Fioletov, V., Bern-hard, G., McKenzie, R., Kondo, Y., O’Neill, M., Slaper, H., den Outer, P., Bais, A. F., and Tamminen, J.: Validation of daily ery-themal doses from Ozone Monitoring Instrument with ground-based UV measurement data, J. Geophys. Res., 5, D24S44, doi:10.1029/2007JD008830, 2007.
UNEP (United Nations Environment Programme): Environmental Effects of Ozone Depletion and its Interactions with Climate Change: 2010 Assessment, ISBN 92-807-2312-X, 2010. Webb, A. R.: Who, what, where and when-influences on cutaneous
vitamin D synthesis, Prog. Biophys. Mol. Biol., 92, 17–25, 2006. Webb, A. R., Slaper, H., Koepke, P., and Schmalwieser, A. W.: Know your standard: clarifying the CIE erythema action spec-trum, Photochem. Photobiol. 87, 483–486, 2011.