Abstract— This paper presents an automatic segmentation of brain lesions from diffusion-weighted magnetic resonance imaging (DW-MRI or DWI) using region growing approach. The lesions are acute infarction, haemorrhage, tumour and abscess. Region splitting and merging is used to detect the lesion region. Then, histogram thresholding technique is applied to automate the seeds selection. The region is iteratively grown by comparing all unallocated neighbour pixels to the seeds. The difference between pixel’s intensity value and the region’s mean is used as the similarity measure. Evaluation is made for performance comparison between automatic and manual seeds selection. Overall, automated region growing algorithm provides comparable results with the semi-automatic segmentation.
Index Terms— DWI, segmentation, region growing
I. INTRODUCTION
IFFUSION weighted magnetic resonance imaging (DW-MRI or DWI) is considered as the most sensitive technique in detecting acute infarction and is useful in giving details of the component of brain lesions [1, 2]. Detection and diagnosis of brain lesion is the key for implementing successful therapy and treatment planning. However, the diagnosis is a very challenging task and can only be performed by professional neuroradiologists. Any difficulty may necessitate more invasive examinations such as tissue biopsy [3]. Therefore, radiologists continuously seek for greater accuracy in the diagnosis of brain lesions from imaging investigations. Quantitative analysis may help radiologists to solve the problems. To assist visual interpretation of the medical images, computer-aided diagnosis (CAD) has become a major research subject in diagnostic radiology. With CAD, radiologists use the computer output as a second opinion in making the final decisions [4].
Segmentation of specific region of interest (ROI) from
Manuscript received Dec 08, 2011; revised Dec 30, 2011. This work was supported by Universiti Teknikal Malaysia Melaka (UTeM) and Ministry of Higher Education (MoHE).
N. Mohd Saad is with the Electronics and Computer Engineering department, Universiti Teknikal Malaysia Melaka, 76100, Durian Tunggal, Melaka, Malaysia (e-mail: [email protected]).
S. A. R. Abu-Bakar and M. Mokji are with the Computer, Vision, Video and Image Processing Research Lab, Faculty of Electrical Engineering, Universiti Teknologi Malaysia, 81310, Skudai, Johor, Malaysia (e-mail: [email protected], [email protected]).
Sobri Muda is with Radiology Department, Medical Faculty, Universiti Kebangsaan Malaysia, Jalan Yaacob Latif, 56000 Cheras, Kuala Lumpur, Malaysia (e-mail: [email protected]).
A. R. Abdullah is with Electrical Engineering Department, Universiti Teknikal Malaysia Melaka, 76100, Durian Tunggal, Melaka, Malaysia (e-mail: [email protected]).
MRI is an essential process for detection and diagnosis of any brain abnormalities or lesions. This process is performed visually by trained radiologists with a significant degree of precision and accuracy. Accurate segmentation is still a challenging task because of the variety of the possible shapes, locations and image intensities of various types of problems and protocols. For example, brain tumour segmentations in conventional MR images performed by experts have approximately 14–22% differences [5]. The process is time consuming and not quantitative, while certain conditions have to be calculated accurately to make the treatment decisions [6].
Computerized segmentation may help the radiologists to overcome these problems. Hence, a large number of approaches have been proposed by various researchers to deal with MRI protocols. Well known and widely used segmentation techniques are k-means clustering algorithm, Fuzzy c-means algorithm, Gaussian mixture model using Expectation Maximization (EM) algorithm, statistical classification using Gaussian Hidden Markov Random Field Model (GHMRF) and supervised method based on the k Nearest Neighbour (kNN) rule [7].
The commonly used segmentation techniques can be classified into two-broad categories: (1) region-based techniques that look for the regions satisfying a given homogeneity criteria and (2) edge-based segmentation techniques that look for edges between regions with different characteristics [8]. For the region-based segmentation category, adaptive thresholding, clustering, region growing, watershed and split and merge are the well known methods for segmentation [9].
Region growing is one of the most popular techniques for segmentation of medical images due to its simplicity and good performance. The technique groups pixels or regions that have similar properties based on predefined criteria. It starts with a set of initial seed points that represent the criteria, and grow the region. Seeds can be automatically or manually selected [10]. Their automated selection can be based on finding pixels that are of interest. For example, the highest pixel from image histogram can serve as a seed pixel. On the other hand, seeds can also be selected manually from an image. The focus of this study is to develop an automatic region growing algorithm that can accurately segment brain lesions in DWI.
This paper is organized as follows. In section II, the proposed techniques are discussed in detail. The section started with the flowchart of the proposed method, followed by the DW images used for this paper and the segmentation process. Performance assessment metrics is discussed in Section III. Experimental results of applying the algorithm is shown in Section IV. In section V, conclusion is discussed.
Automated Region Growing for Segmentation
of Brain Lesion in Diffusion-weighted MRI
N. Mohd Saad, S.A.R. Abu-Bakar, Sobri Muda, M. Mokji, A.R. Abdullah
D
Proceedings of the International MultiConference of Engineers and Computer Scientists 2012 Vol I, IMECS 2012, March 14 - 16, 2012, Hong Kong
ISBN: 978-988-19251-1-4
ISSN: 2078-0958 (Print); ISSN: 2078-0966 (Online)
II. PROPOSED METHODOLOGY
DWI
Image Pre-processing
Region Splitting and Merging
Automatic Histogram Threshold
Stop iteration ?
ROI
stop Automatic Seeds
Selection
Region Growing
Pixel’s intensity -region mean
N Y
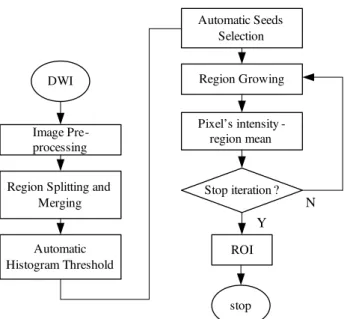
Fig. 1 Flowchart of the Proposed Method
The flowchart of the whole analysis is shown in Fig.1. The image is firstly pre-processed to normalize, remove the background and enhance the image intensity. Region splitting and merging is performed for region detection. Histogram is then calculated and an optimal threshold is acquired. Seed pixels are automatically selected from the pixels that are higher than the set optimal threshold value. After that, region growing is performed. The region is iteratively grown by comparing all unallocated neighbouring pixels to the region. The difference between the pixel's intensity value and the region’s mean is used as a measure of similarity. This process stops when the intensity difference become larger than the difference between region’s mean and optimal threshold.
A. Diffusion-weighted MRI Samples
The DW images have been acquired from the General Hospital of Kuala Lumpur using 1.5T MRI scanners Siemens Magnetom Avanto. Acquisition parameters used were time echo (TE), 94 ms; time repetition (TR), 3200 ms; pixel resolutions, 256 x 256; slice thickness, 5 mm; gap between each slice, 6.5 mm; intensity of diffusion weighting known as b value, 1000 s/mm2 and total number of slices, 19. All samples have medical records which have been confirmed by at least 2 neuroradiologists. Images were encoded in 12-bit DICOM (Digital Imaging and Communications in Medicine) format. Fig. 2 shows DWI for normal and hyperintense lesions.
(a) (b) (c)
Fig. 2 Diffusion-weighted MRI: (a) normal (b) acute infarction (c) haemorrhage
B. Region Splitting and Merging
Split and merge segmentation process [11] subdivides an image into a set of partition regions based on predefined homogeneity criteria. The whole image is split into quad-tree structure partition regions. The selected regions are then merged if they satisfy the homogeneity criteria. Statistical features are calculated to find the homogeneity criteria. The regions that are homogenous to the criteria are then merged to form a lesion region. Fig. 3 shows the process which is outlined by specific colours. The first partition level is outlined by yellow, the second level is by green and the last level is specified by white. The merged level is outlined by a thick box in red colour. Detail descriptions about the pre-processing stage and the process of region splitting and merging can be found in [12].
Fig. 3 Example of the split and merge segmentation process. The red box shows the merged segmentation region
C. Region Growing Segmentation Process
Region growing is a procedure that groups pixels or sub regions into larger regions based on predefined criteria. Seeded region growing requires seeds as additional input. The basic approach is to start with a set of seed points and grow the regions by appending to each seed’s neighbouring pixels that have similar properties to the seed.
The region growing algorithm applied in this study is summarized as follows:
1. Histogram: calculate histogram of the merged segmentation region.
2. Automatic thresholding: calculate divergence measure using Eq. (1), where P(i) is histogram from step 1.
) ( )
( Pi
dx dy i
div (1)
3. Set optimal threshold at the first nearest to zero value after divergence’s maximum peak.
4. Automatic Seeds selection: Select pixels that are higher than the optimal threshold as seeds.
5. Region Growing: select the 1st seed pixel as the first region mean. Grow the region by comparing with neighbouring pixels to this region.
6. Measure the difference between the pixel’s intensity with the region’s mean. The growing process is stopped when this intensity difference is larger than the difference between region’s mean and optimal threshold, shows in Eq. (2) and (3).
T y x
I( , ) (2) optimal
T
T (3)
7. Repeat step 4 to 6 until there are no more seed pixel that does not belong to any segmented region. Proceedings of the International MultiConference of Engineers and Computer Scientists 2012 Vol I,
IMECS 2012, March 14 - 16, 2012, Hong Kong
ISBN: 978-988-19251-1-4
ISSN: 2078-0958 (Print); ISSN: 2078-0966 (Online)
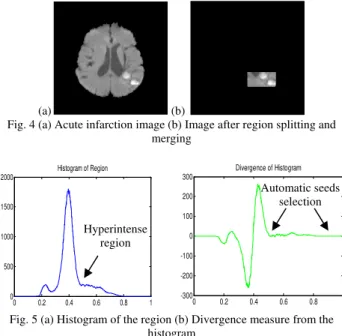
Fig. 4 illustrates the DWI of acute infarction. Fig. 4 (a) shows the pre-processed image. The lesion after splitting and merging process is shown is Fig. 4 (b). As for automatic seeds selection, histogram from the lesion region is calculated (shown in Fig. 5(a). Optimal threshold value is acquired by measuring divergence from its histogram. The divergence reaches its maximum when the histogram is at the greatest rate of change. The optimal threshold is set at the first nearest to zero value after the maximum peak. Each pixel higher than this value is assigned as seeds. The signal of divergence measure is shown in Fig. 5 (b).
Once the seed point is selected, region growing process is started. When the growth of one region stops, it will choose another seed pixel which does not yet belong to any segmented region and the process will start again. The iterations stop when all seeds have been used for the region growth.
(a) (b)
Fig. 4 (a) Acute infarction image (b) Image after region splitting and merging
Fig. 5 (a) Histogram of the region (b) Divergence measure from the histogram
III. PERFORMANCE ASSESSMENT METRICS
Performance assessment of the segmentation results is done by comparing the ROI results obtained from the analysis with the manual segmentation which has been visually inspected by neuroradiologist. Area overlap (AO), false positive rate (FPR), false negative rate (FNR) and misclassified area (MA) are used as the performance metrics. These metrics are computed as follows [13]
100
2 1
2 1
S S
S S AO
c
(4)
100
2 1
2 1
S S
S S FPR
c
(5)
100
2 1
2 1
S S
S S FNR
c
(6)
1
FNR FPR
AO MA
(7)
where S1represents the segmentation results obtained by the algorithm and S2represents the manual segmentation. AO computes the segmented similarity by comparing the overlap region between the manual and the automatic segmentation. FPR and FNR are used to quantify over-segmentation and under-over-segmentation respectively. High AO, and low FPR and FNR showed low error, i.e. high accuracy of the measurement. MA must be low to provide better segmentation accuracy.
Mean absolute percentage error (MAPE) was used as index for misclassified index for mean and number of pixels value in the segmentation area, while pixel absolute error ratio (rerr) was for misclassified pixels for normal control. MAPE is an index that measures the difference between actual and measured value and is expressed as
1
| 2 1 | 100
S S S
MAPE
(8) Besides MAPE, absolute error ratio, rerr was also applied to quantify the accuracy of the segmentation for normal image. rerr is defined as the ratio between the absolute difference in the number of over segmented pixels between the actual and the proposed segmentation method, ndiff, and the total number of pixels, N, of an image. Normal image should result in 0 number of pixel in the segmented image. Otherwise the result is over segmented.
% 100
N n r diff
err (9)
Low MA, MAPE and rerrshow low error, which is high similarity with respect to neuroradiologist. The testing dataset consists of 3 abscess, 4 haemorrhage, 11 acute infarction, and 2 tumour cases. In total, 20 lesions and 23 normal sample slices are used for evaluation.
IV. RESULTS
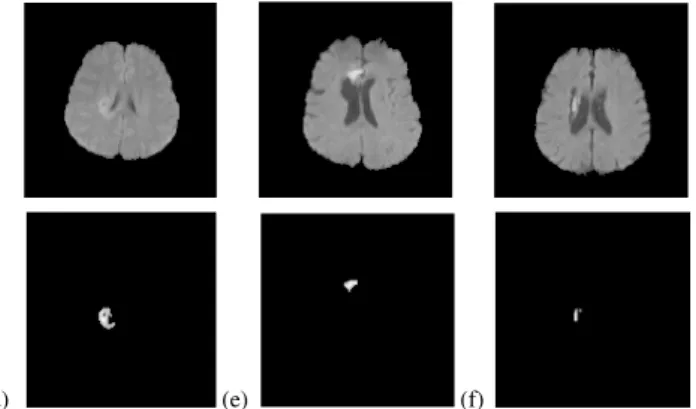
The proposed method has been tested on our dataset, as discussed in section II. Fig. 6 shows segmentation results for 4 types of lesions. The figures show that the proposed method has successfully segmented the hyperintense lesions.
(a) (b) (c)
0 0.2 0.4 0.6 0.8 1
0 500 1000 1500 2000
Histogram of Region
0 0.2 0.4 0.6 0.8 1
-300 -200 -100 0 100 200 300
Divergence of Histogram
Automatic seeds selection
Hyperintense region
Proceedings of the International MultiConference of Engineers and Computer Scientists 2012 Vol I, IMECS 2012, March 14 - 16, 2012, Hong Kong
ISBN: 978-988-19251-1-4
ISSN: 2078-0958 (Print); ISSN: 2078-0966 (Online)
(d) (e) (f)
Fig. 6 Hyperintense lesions and their segmentation results: (a) acute infarction, (b) haemorrhage, (c) abscess, (d) tumour, (e) acute infarction,
(f) haemorrhage
Fig. 7 shows average segmentation performance of the proposed automatic region growing method with comparison of local semi-automatic region growing. Semi-automatic region growing provides lower misclassified error which means better similarity to manual segmentation. This is expected because semi-automatic segmentation is usually applied if automatic segmentation is not accurate enough. In this analysis, the misclassified error of the proposed automatic method is comparable with the semi-automatic segmentation and provides almost similar performance compared to the semi-automatic. On the other hand, the automatic segmentation provides better mean absolute percentage error (MAPE) compared to the manual segmentation results. For normal control, the misclassified pixels error (rerr) is very small. Overall, the automatic region growing provides comparable results with the semi-automatic segmentation.
Fig. 7 Average performance of the algorithm
V. CONCLUSION
This paper has described segmentation of brain lesion in diffusion-weighted imaging (DWI) using automated region growing. It used clinical DWI lesions such as acute infarction, haemorrhage, tumour and abscess. Region splitting and merging was carried out to obtain the lesion region. Histogram thresholding was used to find the optimal intensity threshold value and to obtain automatic seeds selection. The results have shown that the automatic region growing provides comparable results with the semi-automatic segmentation.
ACKNOWLEDGEMENT
The authors would like to thank Universiti Teknikal Malaysia Melaka (UTeM) and Ministry of Higher Education (MoHE) for the financial support. We also thank Universiti Teknologi Malaysia (UTM) and Universiti Kebangsaan Malaysia Medical Centre (UKMMC) for the resources of this research work.
REFERENCES
[1] S.K. Mukherji, T.L. Chenevert, M.Castillo, “State of the Art: Diffusion-weighted Magnetic Resonance Imaging” J
Neuro-Ophtalmol 2002,vol.22, pp. 118-122.
[2] Magnetom Maestro Class, “Diffusion weighted MRI of the brain” Brochure Siemens Medical Solutions that helps.
[3] M. Barnathan, J. Zhang, E. Miranda, V. Megalooikonomou, “A texture-based for identifying tissue type in magnetic resonance images” IEEE International Symposium on Biomedical Imaging
(ISBI): from Nano to Macro, pp.464-467, 2008.
[4] K. Doi, “Computer-aided diagnosis in medical imaging: Historical review, current status and future potential” Computerized Medical
Imaging and Graphics, vol.31, pp. 198–211, 2007.
[5] I. Guler, A. Demirhan, R. Karakis, “Interpretation of MR images using self-organizing maps and knowledge based expert systems”
Elsevier J. Digital Signal Processing, vol.19, pp.668-677, 2009.
[6] Wieslaw L. Nowinski, Guoyu Qian, K.N. Bhanu Prakash, Ihar Volkau, et al. “Stroke Cad: Cad Systems for Acute Ischemic Stroke, Hemorrhagic Stroke, and Stroke in ER” MIMI 2007, LNCS 4987, pp.277-386, 2008.
[7] Rubens Cardenes, Rodrigo de Luis-Garcia, Meritxell Bach-Cuadra, “A multidimensional segmentation evaluation for medical image data” J. Computer Methods and Programs in Medicine, vol.96, pp.108-124, 2009.
[8] I.N. Bankman, “Handbook of medical imaging: processing and analysis eleventh edition” Academic Press, 2000.
[9] William K. Pratt, “Digital Image Processing, 3rd Edition” John Wiley
& Sons Inc., 2001.
[10] R. B. Dubey, M. Hanmandlu, S. K. Gupta, S. K. Gupta, “Region growing for MRI brain tumour volume analysis” Indian Journal of Science and Technology, Vol.2 No. 9, 2009, pp.26-31.
[11] S.L. Horowitz, T. Pavlidis, “Picture segmentation by a tree transversal algorithm” J. Assoc. for Computing Machinery, vol. 23, 1976, pp.368-388.
[12] Norhashimah Mohd Saad, S. A. R. Abu-Bakar, Sobri Muda, Musa Mokji, “Automated Segmentation of Brain Lesion based on Diffusion-Weighted MRI using a Split and Merge Approach”, Proceedings of 2010 IEEE-EMBS Conference on Biomedical Engineering & Sciences (IECBES 2010), 30th – 2nd Dec. 2010, Kuala
Lumpur, Malaysia, 2010.
[13] J.G. Park, C. Lee, “Skull Stripping based on region growing for magnetic resonance images”, J. NeuroImage, vol.47, 2009, pp. 1394-1407.
0.0000 0.0500 0.1000 0.1500 0.2000 0.2500 0.3000
Misclassified Error
MAPE rerr
0.2911
0.1353
0.0094 0.2623
0.1534
0.00 Automatic
Semi‐Automatic
Proceedings of the International MultiConference of Engineers and Computer Scientists 2012 Vol I, IMECS 2012, March 14 - 16, 2012, Hong Kong
ISBN: 978-988-19251-1-4
ISSN: 2078-0958 (Print); ISSN: 2078-0966 (Online)