Fábio R. L. Dotto
[email protected] Universidade Estadual Paulista - UNESP Faculdade de Engenharia Departamento de Engenharia Elétrica 17033-360 Bauru, SP. BrazilPaulo Roberto de Aguiar
[email protected]Rogério Thomazella
[email protected]Eduardo Carlos Bianchi
Senior Member, ABCM [email protected] Universidade Estadual Paulista - UNESP Faculdade de Engenharia Departamento de Engenharia Mecânica 17033-360 Bauru, SP. Brazil
Methodology for Automatic Selection
of Passes in Surface Grinding
The main purpose of this work is the development of computational tools in order to assist the on-line automatic detection of burn in the surface grinding process. Most of the parameters currently employed in the burning recognition (DPO, FKS, DPKS, DIFP, among others) do not incorporate routines for automatic selection of the grinding passes, therefore, requiring the user’s interference for the choice of the active region. Several methods were employed in the passes extraction; however, those with the best results are presented in this article. Tests carried out in a surface-grinding machine have shown the success of the algorithms developed for pass extraction.
Keywords: grinding process, computational tools, burning, acoustic emission, power signal
Introduction
There are several types of grinding processes and the most usual ones are internal, external, surface and centerless, where superabrasives or conventional abrasives are employed. According to King (1986), all types operate in a similar way. When a moving abrasive surface is in contact with the workpiece, the material is removed from the workpiece and the grinding wheel gets worn out. The surface grinding process is also based upon such a principle.1
According to Junior (1996), the implementation viability of monitoring systems in grinding machines, therefore, could allow an improvement of the operation reliability as well as an improvement of quality and costs reduction. This occurs whenever a monitoring system works as a dedicated operator, which observes with accuracy each machined workpiece’s cycle. The grinding operations with functions monitored by systems capable of deciding corrective actions are called Intelligent Grinding Operations or simply I.G. The acoustic emission technique implementation is employed in several I.G. functions, such as contact detection and dressing (SOARES & OLIVEIRA, 2002).
The intelligent grinding concept is also applied to burning detection, where several parameters are studied and implemented.
Several new parameters for burning detection in the grinding processes have been developed in the last few years. Some of them are based on the root mean square value of the acoustic emission signals (RMS) and the electric power of the grinding wheel’s motor drive. The DPO (Aguiar, 2002a) and FKS (Aguiar, 2002b) parameters employ both signals. Also, Pansanato et. al. (2002) has looked at acoustic emission and grinding wheel speed in order to find out new parameters for burning detection. Still, according to Pansanato et al. (2002), the raw acoustic emission signal shows higher flexibility in the monitoring, since it has all the RMS acoustic emission signal advantages and holds information that are usually
Paper accepted November, 2006. Technical Editor: Atila P. Silva Freire.
ignored, when only the RMS acoustic emission signal is obtained. This way, other researches are ongoing with the purpose of finding parameters, which employ the raw acoustic emission signal instead of the RMS signal. Wang et al (2001) and Aguiar (2003) showed parameters for burning detection employing the raw acoustic emission signal such as CFAR, ROP and MVD statistics.
Despite the development of many parameters for burning detection, there is no reliable method for passes extraction while the process is running. Also, the contact detection is, for instance, extremely useful for the grinding process automation, since the RMS acoustic emission signal tends to increase when the grinding wheel touches the workpiece (SOARES & OLIVEIRA, 2002; WANG et al. 1999). On the other hand, the problem gets worse when the acquirement of two signals simultaneously becomes necessary for selection of one single active region and calculation of only one parameter.
In order to overcome the existing limitation in burning detection, which used to require good judgment of the user for the choice of one active region, two algorithms for automatic selection of grinding passes were developed: one of them for detection of passes in the electric power signals and the other one for detection of passes in the acoustic emission signals. The computer acquires both signals through a data acquisition board, which will be processed in order for the passes to be extracted and the parameters calculated without user interference. Thus, on-line automatic systems for burn detection in the surface grinding process can be built and applied to practical situations.
Dotto et al. (2006). DIFP is the product of the maximum value of electric power, the average value of the acoustic emission and the sine of the angle formed between the crescent line on the pass extraction of the electric power signal and the horizontal axis. DPKS parameter is defined by the standard deviation of the acoustic emission multiplied by the sum of the difference, raised by four units, between the electric power and its standard deviation.
Automatic Detection of Grinding Wheel Passes
The pass automatic detection system allows the detection and selection of the grinding wheel passes without user interference. The signals commonly collected from the sensors and employed in the burning detection in surface grinding process are: the acoustic emission and the electric power of the grinding wheel’s motor drive. Starting from this principle, algorithms capable of analyzing such signals and obtaining information from the concerned passes have been developed. The following paragraphs show the signal treatment given to the acoustic emission and electric power signals, separately.
Automatic Detection of Grinding Passes in the Electric Power Signals
In order to understand the pass detection algorithm, we should previously analyze the electric power signal shape. Figure 1 shows the wave shape from the electric power signal.
Figure 1. Wave shape from the electric power signal.
One can observe that the most important parameters involved in the electric power signal are: TPOT, which is the power signal’s
effective time during a valid pass; Tpot is the elapsed time during a
valid pass; APOT is the maximum magnitude during one valid pass; ASPK is the maximum magnitude during the spark-out; and Tspk is
the elapsed time during the spark-out. Such shape of wave repeats during the grinding process until all material is removed from the workpiece. For each valid pass, there is a grinding table return, where the grinding wheel no longer moves forward on the workpiece (spark-out), and therefore, for every valid pass, there is its corresponding spark-out.
In order to develop a pass detection algorithm, it is necessary to know the moment in which the valid pass starts and the moment it ends. One of the possible ways to achieve it, is defining a threshold, in which once the power signal reaches it, it would show the beginning of such pass, and when the power signal drops to values under this threshold, it would show the end of such pass. Such procedure may seem initially interesting, however, one observes that
defining such flatness point could become more complex than what was expected. It has been observed that the power signal could change and the definition of a threshold could compromise part of the signal that belonged to the pass.
It was possible to notice, through the study of the signal variation, that the power signal increases up to a maximum value, then decreases down to a minimum value, keeping such sequence during all grinding cycle. In this purpose, an algorithm which could verify the increase or decrease trend, simply through the drawing of a trend line, was developed.
Figure 2. Algorithm functioning principle.
Let the point 0 be the algorithm’s starting point as shown in Figure 2. It compares the magnitude variation of this point in relation to the next, and so on. When it finds a deviation of around 5% the beginning of a trend line is set up. As an example, when comparing the point 0 with the point I a positive trend can be noticed. The same analysis is done over again, this time with point I with point II and the algorithm perceives that such trend is kept the same.
When the analysis is done with the points III and IV, the software perceives the trend turns around, in other words, the trend starts being negative instead of positive. Thus, the software builds a straight line valid only between 0 and III, changes its tendency to a decline trend and keeps on searching for a new change in trend. The next change in trend will occur between points VI and VII, where a new trend inversion occurs, so the new straight line is built between points III and VI. At this point, the current trend starts being positive and it also starts searching for a new trend inversion (trend to decline or negative).
For a better understanding, a simplified flowchart for the algorithm of pass detection was developed. Figure 3 shows the flowchart for the construction of the trend lines.
The algorithm should be analyzed taking into account that different situations will not occur because the routines for errors processing were not included in the flowchart. It is also important noticing that the variables not initialized have 0 as standard value.
The variables included in the flowchart are:
•TrendCurrent: shows the current trend of the straight line; •Pos: shows the cursor location, it is employed as an indicator, which goes through the electric power graphic points;
•End: is equal to the number of points from the electric power graphic;
•y (pos) and y (current): it is the electric power signal magnitude as a function of the time coordinate (discrete form);
•dy: it is the variation between the current and the test position; •i: is a variable employed in incrementing and counting; •Trend(): is a dynamically trend line object as a vector, containing all straight lines found in the electric power signal.
Figure 3. Flowchart of the algorithm for passes extraction of the power signals.
The flowchart of Figure 3 has an output routine called Optimize. The main function of such routine is to optimize all straight lines created (trend lines), since during the algorithm of trend lines extraction, small variations may be understood as straight lines, and that is not true.
The principle employed in the optimization routine consists of keeping an alternation, in other words, after a crescent line there should always be a decrescent one, establishing a type of triangle, which bounds the pass. There should never be a straight line shorter than 5 points, which would mean a noise rather than a trend. That was verified empirically on the tests.
In order to optimize the lines created by the trend line algorithm, an optimization algorithm was developed, as shown in Figure 4.
The main purpose of this algorithm is the removal of the non-valid grinding pass. To achieve that goal a checking is made on all the grinding passes extracted in order to verify whether some of them has size less than 0.5 seconds. If this is true, the grinding pass is automatically extracted and disregarded.
Figure 5 shows the passes that have been detected. The rectangles show the upper and lower limits of the passes. The passes are always composed by two trend lines, with the first line crescent, and the second line decrescent. Another important matter to be considered is that after one valid pass there is always a spark-out; therefore, it is important to know whether or not the acquisition starts with the spark-out or with a valid pass, since from that information all the further sequencies of aquisition can be known.
In order to solve this problem, a simple comparison of magnitudes between passes near each other is performed, easily allowing detecting whether or not the pass concerns the spark-out.
Figure 4. Optimization algorithm flowchart in the power signals passes extraction.
Figure 5. Result from the passes extraction algorithm of the power signals.
Automatic Detection of Grinding Passes in the Acoustic Emission Signals
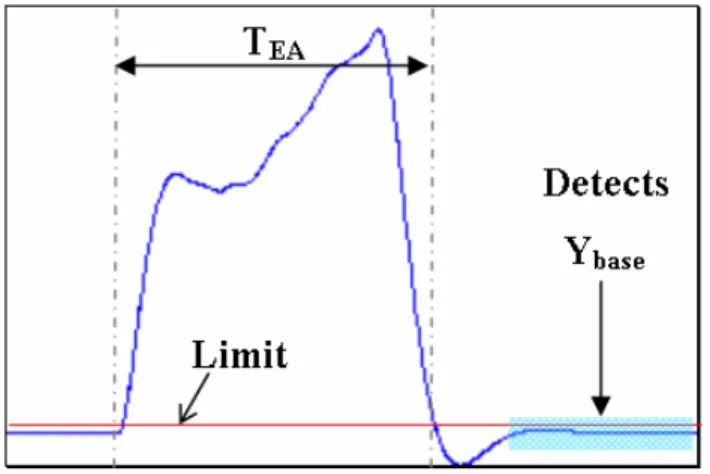
In order to understand the passes detection algorithm, we should analyze the shape of the RMS acoustic emission signal beforehand. Figure 6 shows the main parameters of the acoustic emission signal related to the passes detection.
It is well known that acoustic emission signal has been studied in the most important research centers worldwide, and therefore, the number of information that may be obtained from that signal is quite large. This work takes into consideration no more than two parameters: TEA and TSPK as shown in Figure 6.
TEA is defined as the time the acoustic emission signal is seen
during a valid pass, in other words, the period of time in which the grinding wheel removes the material from the workpiece that is being ground. TSPK is defined as the spark-out time, whose value is
usually equal to TEA, since the size of the workpiece is fixed and the
table’s velocity is constant.
During the analyses performed, it was noticed that the acoustic emission signal has its value near 0 when the grinding wheel is not in touch with the workpiece, and the average value greater than 0 when the grinding wheel touches the workpiece. The parameter TEA
also shows the time in which the grinding wheel keeps in touch with the workpiece, since there is practically no delay from the sensor response. The size of the pass to be extracted should be equal to TEA
e TSPK, repeating this cycle during the entire grinding process.
For the passes detection, a procedure quite simpler than that employed in the extraction of passes of the electric power signal was implemented. Figure 7 shows the functioning of the passes extraction algorithm.
Figure 7. Algorithm functioning principle.
Before analyzing the algorithm, one should notice that the employed acoustic emission signal is previously filtered, since noises might contaminate the signal.
At first, the algorithm basically attempts to find a constant region in the acoustic emission graphic. Such region is required in order to find the acoustic emission signal threshold when the grinding wheel does not touch the workpiece. Such region is marked with a rectangle in Figure 7. The algorithm actually searches for a set of points where the acoustic emission signal is nearly constant. Through tests performed, it could be concluded that such number of points should be nearly equal to the sampling rate divided by 2, which represents 0.5 seconds, in other words, it has been searching
for a region where the acoustic emission signal remains constant for at least 0.5 seconds.
When such region is found, a parameter called Ybase is defined,
which is equal to the approximate value of the acoustic emission when the grinding wheel does not touch the workpiece, in other words, the reference value which will be compared in order to find out when the pass starts or ends. Such value is required, since every time a signal is filtered out, its magnitude changes, and therefore, Ybase has to be always defined before the passes are extracted.
Through Ybase, the upper limit equal to Ybase + 1% is defined.
Such value is represented in Figure 7 by a horizontal line. Next, each point of the channel (acquired through the data acquisition board) is compared with that limit. When the point value is higher than the pre-established limit, the pass starts and when the point value is lower than such limit, the pass ends.
It can be noticed that a small loss of points may occur at the beginning and at the end of the pass due to that pre-established limit, however, without compromising the burning detection result.
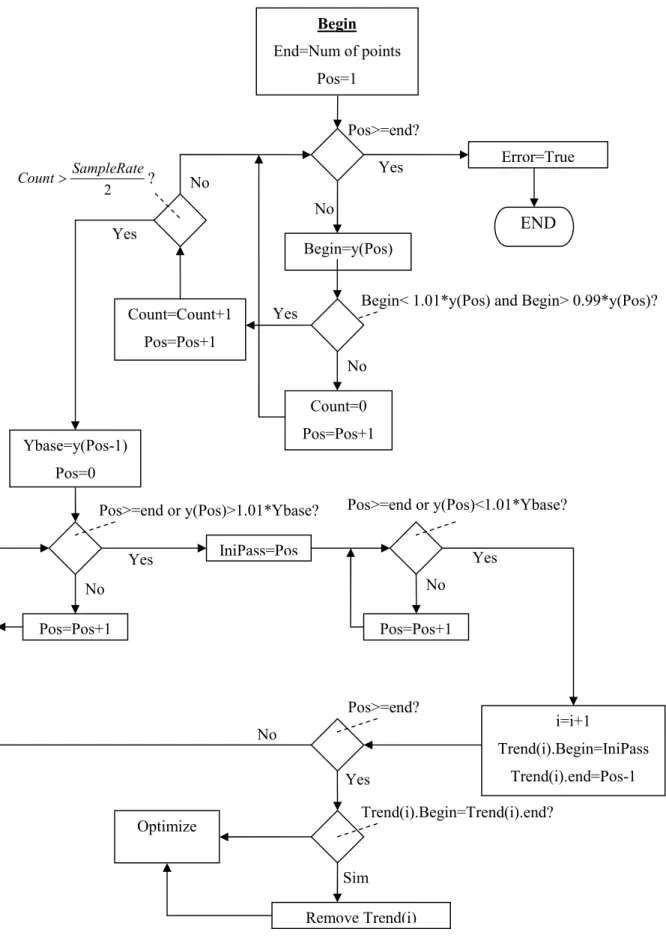
Figure 8 shows the flowchart of the algorithm for pass extraction of the acoustic emission signals. The variables in the flowchart are quite the same as the variables of the flowchart for pass detection of the electric power signal.
The variables which are different from those described for the algorithm for pass extraction of the electric power signal are:
•IniPass: Represents the beginning position of the pass. •Count: is a counter, which helps finding out a region where the extraction of the parameter Ybase might occur.
•Error: It is true when there is no constant region for extracting the parameter Ybase.
•Beginning: Auxiliary variable employed in the storage of the beginning of the search position of the region for extracting Ybase
parameter.
The object employed in the storage of the extracted passes is just the same employed in the extraction of passes of the electric power signal, however, the TrendLine property is not employed.
Since signals obtained through analog sensors were manipulated by circuits, such signals are also vulnerable to interferences, which may be considered as valid passes, when actually they are not. In order to solve such problems, a pass optimization algorithm also becomes necessary for the acoustic emission signals.
Figure 9 shows the optimization algorithm flowchart further employed in the pass extraction algorithm.
The main function of this optimization algorithm is the non-valid pass removal. In that purpose, the checking is done in all extracted passes in order to verify if the size of any of them is smaller than 0.5 second. In case it occurs, the pass is automatically removed and disregarded. Figure 10 shows a magnified view of the passes extraction of the acoustic emission signal.
It is noticed from this figure that the passes are defined as a rectangle. The rectangle’s lines define the regions of beginning and end of the passes.
Figure 8. Flowchart of the algorithm for pass extraction of the acoustic emission signals.
2
SampleRate
Count
>
?
No
No
Yes
Begin< 1.01*y(Pos) and Begin> 0.99*y(Pos)?
No
Yes
Pos>=end?
Pos>=end or y(Pos)>1.01*Ybase?
Pos>=end or y(Pos)<1.01*Ybase?
Trend(i).Begin=Trend(i).end?
Sim
No
No
Pos>=end?
Yes
Begin
End=Num of points
Pos=1
Begin=y(Pos)
Count=Count+1
Pos=Pos+1
Yes
Count=0
Pos=Pos+1
Ybase=y(Pos-1)
Pos=0
Pos=Pos+1
Yes
IniPass=Pos
Pos=Pos+1
Yes
i=i+1
Trend(i).Begin=IniPass
Trend(i).end=Pos-1
Optimize
Remove Trend(i)
Error=True
END
Figure 9. Flowchart of the algorithm for pass optimization of the acoustic emission signal.
Figure 10. Magnified view of the pass extraction of the acoustic emission signal.
Results
In order to validate the process of automatic selection of passes, the experimental setup shown in figure 11 was carried out.
As one could see from Figure 11, the power signals are acquired through the electric power unit, which is connected to the frequency inverter that controls the grinding wheel’s motor drive velocity. Such module collects current and voltage information and accomplishes the multiplication of these variables in order to obtain the instantaneous electric power. The power signal is then transferred to the signal module which filters out and amplifies it.
Figure 12 shows a view of the position of the acoustic emission sensor on the workpiece holder.
The acoustic emission unit (SENSIS – BM12) collects the acoustic emission signals emitted by the contact of the grinding wheel with the workpiece. Such module calculates the RMS value and transfers the signals to the BNC block, which is a set of connectors used to receive and send signals to the acquisition board within the computer.
The data acquisition board from National Instruments, model PCI 6035E, was employed in this work. The sampling rate used in the tests was 10.000 samples per second.
A software written in Visual Basic collects and processes such information from the acquisition board, employing the algorithm previously described.
Figure 11. Experimental setup.
Figure 12. Magnified view of the grinding process.
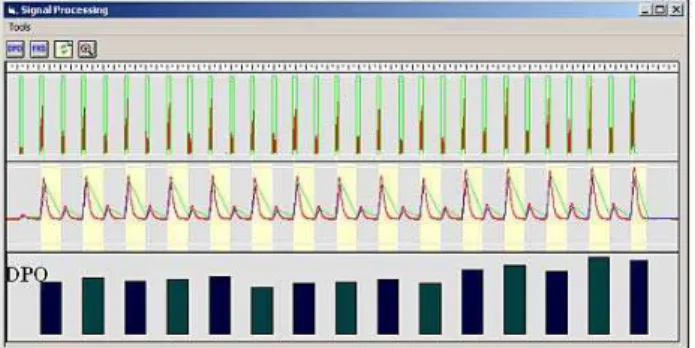
Figure 13 shows the acoustic emission and electric power signals acquired from the data acquisition board without any signal processing. It can be seen in this figure that the acoustic emission is shown on the upper part of the window, the electric power in the middle, and the burning parameter on the lower part. Figures 14 and 15 show the automatic detection of passes during the entire grinding process, where the acoustic emission and electric power signals can be seen in both figures, with DPKS parameter processed in Figure 14 and DPO parameter in Figure 15. The passes are automatically selected followed by burning parameter calculation.
Figure 14. Signal processing and DPKS parameter calculation.
Figure 15. Signal processing and DPO parameter calculation without spark-out.
Conclusions
Based upon the results obtained from this work, it becomes possible to assure that the developed algorithms for the automatic extraction of grinding passes represent a turning point on the burning on-line processing in the surface grinding process, since through such algorithms, a new research branch may be established, allowing grinding burn to be detected while the process is ongoing in industry. Such practical phase was hard to be implemented in the past, since the signal processing algorithms would not allow real applications, but only simulations in specific software, such as Matlab, for instance.
Besides allowing on-line burning parameter calculation, other employments involving the pass automatic extraction may be easily implemented, once the involved routines are incorporated into control system through dynamic libraries (DLL’s) previously generated.
The routines have fulfilled about 100% of cases so far, however, the gain controls must be kept constant for both acoustic emission and electric power modules employed during the signal acquisition process.
Additional tests have been performed and they also confirmed that even without the acoustic emission signal filtering, the passes extraction and selection can be successfully obtained, since the final algorithm does not depend on the signal variation and, this way, it does not compromise the pass selection analysis employed in the algorithm.
Acknowledgement
The authors want to express their appreciation and gratefullness to The State of São Paulo Research Foundation – FAPESP, for the financial support that allowed the accomplishment of this work.
References
Aguiar, P. R., Bianchi, E. C., Oliveira, J. F. G., 2002a, “A Method for Burning Detection in Grinding Process Using Acoustic Emission and Effective Electrical Power Signals”, CIRP Journal of Manufacturing Systems, Paris, Vol. 31, No. 3, p. 253-257.
Aguiar, P. R., Bagagli, R. P., Bianchi, E. C., Monici, R. D., 2002b, “The Surface Integrity Of The Workpiece Monitored by Acoustic Emission and Electric Power Signals In Grinding (In Portuguese). In: 8as Jornadas Portuguesa de Tribologia, Aveiro, Portugal, p. 245-249.
Aguiar, P. R., 2003, “Automatic control of Thermal Damages in Grinding Process through the Processing of Acoustic Emission and Electric Power“ (in Portuguese), Associate Professor Thesis presented at Sao Paulo State University, UNESP, Bauru Campus.
Dotto, F. R. L., Aguiar, P. R., Bianchi, E. C., Serni, P. J. A. & Thomazella R., 2006, “Automatic System for Thermal Damage Detection in Manufacturing Process with Internet Monitoring“, J. of Braz. Soc. of Mech. Sci. & Eng., Vol. 28, No. 2, p. 153-160.
Junior, J. F., 1996, “Implementation of Intelligent Grinding Functions by Acoustic Emission“, (in Portuguese), Ph.D. Thesis presented at School of Engineering of Sao Carlos - EESC, USP, 1996.
King, R. I. & Hahn, R. S., 1986, “Handbook Of Modern Technology“, New York, Chapman and Hall.
Pansanato, L., Aguiar, P. R., Bianchi, E. C., Mori, A. K., 2002, “The Processing of the Raw Acoustic Emission and Grinding Wheel Speed Signals on Detection of Thermal Damage in Surface Grinding“, (in Portuguese), SAE Brazil Conference, pp. 1-6, No. 276, São Paulo.
Soares, D. D., Oliveira, F. G., 2002, “Diagnosis of Grinding Process by Signal Processing“, (in Portuguese), Maquinas e Metais Magazine, pp.140-157.