Annales
Geophysicae
Source location of chorus emissions observed by Cluster
M. Parrot1, O. Santol´ık2, N. Cornilleau-Wehrlin3, M. Maksimovic4, and C. C Harvey5
1LPCE/CNRS, 3A Avenue de la Recherche, Orl´eans, 45071 France 2Charles University, V Holesovickach 2, Praha 8, 18000 Czech Republic 3CETP/UVSQ, 10/12 Avenue de l’Europe, Velizy, 78140 France 4LESIA, Place Jules Janssen, Meudon, 92195 France
5CESR, 9 Av. Colonel Roche, Toulouse, 31029 France
Received: 4 July 2002 – Revised: 3 October 2002 – Accepted: 18 October 2002
Abstract. One of the objectives of the Cluster mission is
to study sources of various electromagnetic waves using the four satellites. This paper describes the methods we have ap-plied to data recorded from the STAFF spectrum analyser. This instrument provides the cross spectral matrix of three magnetic and two electric field components. This spectral matrix is analysed to determine, for each satellite, the di-rection of the wave normal relative to the Earth’s magnetic field as a function of frequency and of time. Due to the Cluster orbit, chorus emissions are often observed close to perigee, and the data analysis determines the direction of these waves. Three events observed during different levels of magnetic activity are reported. It is shown that the com-ponent of the Poynting vector parallel to the magnetic field changes its sense when the satellites cross the magnetic equa-tor, which indicates that the chorus waves propagate away from the equator. Detailed analysis indicates that the source is located in close vicinity of the plane of the geomagnetic equator.
Key words. Magnetospheric physics (plasma waves and
in-stabilities; storms and substorms); Space plasma physics (waves and instabilities)
1 Introduction
Chorus emissions are one of the most intense, naturally oc-curring electromagnetic signals detected in the outer magne-tosphere. These waves occur at frequencies between a few hundred Hz and a few kHz. They consist of discrete ele-ments of short duration (<1 s). Near the magnetic equator, two different bands of chorus elements, separated by a gap at one-half of the local electron gyro frequency, are often observed (see, for example, Tsurutani and Smith, 1974, and Cornilleau-Wehrlin et al., 1978). Chorus waves have been studied extensively in the past (see the review by Sazhin and
Correspondence to:M. Parrot
Hayakawa, 1992, and references therein). They are gener-ated by the injection of substorm electrons (Tsurutani et al., 1979; Tsurutani and Smith, 1974) through the loss cone in-stability (Kennel and Petschek, 1966). There is a cyclotron resonance between electrons and chorus waves causing pitch angle scattering into the loss cone and the simultaneous gen-eration of waves in the interaction region. The theory of the loss cone instability indicates that the wave growth is maxi-mum where the magnetic field is minimaxi-mum, i.e. at the mag-netic equator. It has been indirectly shown (Dunkel and Hel-liwell, 1969; Burtis and HelHel-liwell, 1969; Burton and Holzer, 1974; Tsurutani and Smith, 1977) that chorus emissions are generated near the magnetic equator. This was confirmed by Nagano et al. (1996) using GEOTAIL data. More re-cently, using POLAR data, LeDocq et al. (1998) have shown that the source of the emissions is located within a few de-grees of the magnetic equator. The purpose of this paper is to analyse chorus emissions using the Cluster satellites that follow an orbit which crosses the frontiers between the so-lar wind and the Earth’s magnetosphere. Their tetrahedral configuration allows for the separation of spatial and tem-poral variations with the parameters measured. This paper presents the propagation characteristics of chorus waves ob-served close to perigee, and determines their source location. Section 2 will briefly describe the STAFF (Spatio-Temporal Analysis of Field Fluctuations) experiment on board Clus-ter and the dedicated software PRASSADCO (PRopagation Analysis of STAFF-SA Data with COherency tests) is pre-sented in Sect. 3. Three chorus events recorded by all four Cluster satellites near the magnetic equator are described in Sect. 4. Discussion and conclusions are given in Sect. 5.
2 The wave experiment
UT: 0700 0720 0740 0800 0820
R (RE): 4.07 4.02 4.07
MLat (deg): -6.69 5.85 18.34
MLT (h): 22.19 22.05 21.90
XGSE (RE): -3.55 -3.51 -3.36
YGSE (RE): 1.53 1.92 2.24
ZGSE (RE): -1.29 -0.41 0.47
CLUSTER 2 SUM OF THE THREE MAGNETIC POWER-SPECTRAL DENSITIES
CLUSTER 2 SUM OF THE TWO ELECTRIC POWER-SPECTRAL DENSITIES CLUSTER 2 DEGREE OF POLARIZATION FROM EIGENVALUES CLUSTER 2 INDICATOR OF THE SENSE OF POLARIZATION POS: RIGHT NEG: LEFT CLUSTER 2 ELLIPTICITY OF POLARIZATION
(Samson and Olson, 1980)
CLUSTER 2 POLAR ANGLE THETA (Means, 1972) CLUSTER 2 AZIMUTHAL ANGLE PHI (Means, 1972) CLUSTER 2 NORMALIZED Z-COMPONENT OF THE POYNTING VECTOR FROM E1 & E2
CLUSTER 2 PHASE BETWEEN E1 & E2 AND Bp
CLUSTER 2 REFRACTIVE INDEX FROM E1 & E2
CLUSTER 2 PHASE SHIFT FROM E1 & E2
4.19 4.40 30.21 41.02 21.72 21.50 -3.10 -2.74 2.49 2.66 1.34 2.17
CLUSTER STAFF-SA 2001-03-31 06:44:08.228 - 2001-03-31 08:28:59.979
10-10 10-8 10-6 10-4 B (nT 2/Hz) 10 100 1000 f (Hz) 10-10 10-8 10-6 10-4 E (mV 2/m 2/Hz) 10 100 1000 f (Hz) 0.4 0.6 0.8 1.0 E1 /(E 1 +E 2 +E 3 ) 10 100 1000 f (Hz) -2 -1 0 1 2 CB 10 100 1000 f (Hz) -1.0 -0.5 0.0 0.5 1.0 E 10 100 1000 f (Hz) 0 20 40 60 80 Theta (deg) 10 100 1000 f (Hz) -180 -90 0 90 180 Phi (deg) 10 100 1000 f (Hz) -2 -1 0 1 2 PZ / sigma 10 100 1000 f (Hz) -100 0 100 E1 & E 2 -B p (deg) 10 100 1000 f (Hz) 1 10 100 1000 N 10 100 1000 f (Hz) -100 0 100 Phase (deg) 10 100 1000 f (Hz)
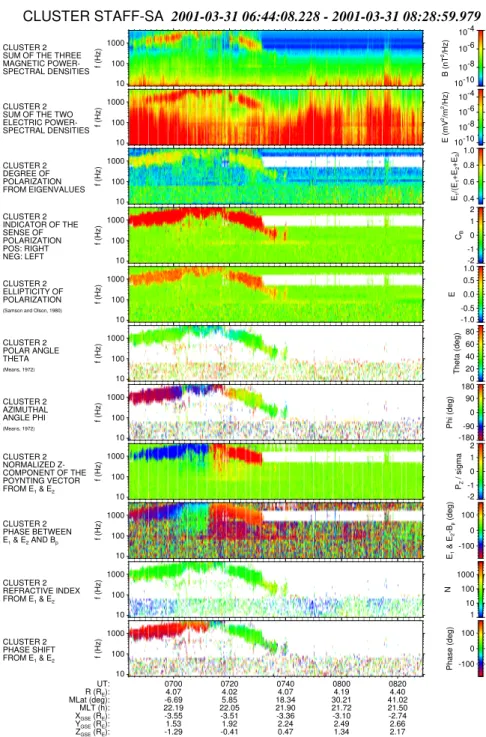
Fig. 1.Wave propagation parameters of the chorus event recorded on 31 March 2001 between 06:44 and 08:29 UT. Detailed explanations of each panel are in the text.
to a processing unit. The processing unit has two parts, the waveform analyser which measures the waveform of each magnetic field component at frequencies up to 10 Hz (180 Hz in the burst mode), and the Spectrum Analyser (SA) which derives the Hermitian spectral matrix of five components of the electromagnetic field in the frequency range 8 Hz to 4 kHz; for this, it uses the two components of the electric field obtained from the sensors of the Electric Field and Wave experiment, EFW (Gustafsson et al., 1997). The SA part will be used in what follows. The 5·5 cross spectral matrix is de-rived at 27 frequencies distributed logarithmically between
8 Hz and 4 kHz. The time resolution varies between 125 ms and 4 s, depending on the mode.
3 The data processing software
CLUSTER STAFF-SA 2001-03-31 06:59:56.217 - 2001-03-31 07:20:02.266
UT: 0700 0703 0706 0709 0712 0715 0718
R (RE): 4.05 4.03 4.02 4.02 4.01 4.01 4.01
MLat (deg): -5.85 -3.97 -2.08 -0.18 1.72 3.63 5.54
MLT (h): 22.22 22.20 22.18 22.16 22.14 22.12 22.10
CLUSTER 1 NORMALIZED Z-COMPONENT OF THE POYNTING VECTOR
FROM E1 & E2
-2 -1 0 1 2
PZ
/ sigma
10 100 1000
f (Hz)
CLUSTER 1 MAG LATITUDE OF CLUSTER 4 IN DEGREES
-6 -4
-20
2 4 6
CLUSTER 1 ELECTRON GYROFREQUENCY
10
fCE
(kHz)
CLUSTER 2 NORMALIZED Z-COMPONENT OF THE POYNTING VECTOR
FROM E1 & E2
-2 -1 0 1 2
PZ
/ sigma
10 100 1000
f (Hz)
CLUSTER 2 MAG LATITUDE OF CLUSTER 4 IN DEGREES
-6 -4
-20
2 4 6
CLUSTER 2 ELECTRON GYROFREQUENCY
10
fCE
(kHz)
CLUSTER 3 NORMALIZED Z-COMPONENT OF THE POYNTING VECTOR
FROM E1 & E2
-2 -1 0 1 2
PZ
/ sigma
10 100 1000
f (Hz)
CLUSTER 3 MAG LATITUDE OF CLUSTER 4 IN DEGREES
-6 -4
-20
2 4 6
CLUSTER 3 ELECTRON GYROFREQUENCY
10
fCE
(kHz)
CLUSTER 4 NORMALIZED Z-COMPONENT OF THE POYNTING VECTOR
FROM E1 & E2
-2 -1 0 1 2
PZ
/ sigma
10 100 1000
f (Hz)
CLUSTER 4 MAG LATITUDE OF CLUSTER 4 IN DEGREES
-6 -4
-20
2 4 6
CLUSTER 4 ELECTRON GYROFREQUENCY
10
fCE
(kHz)
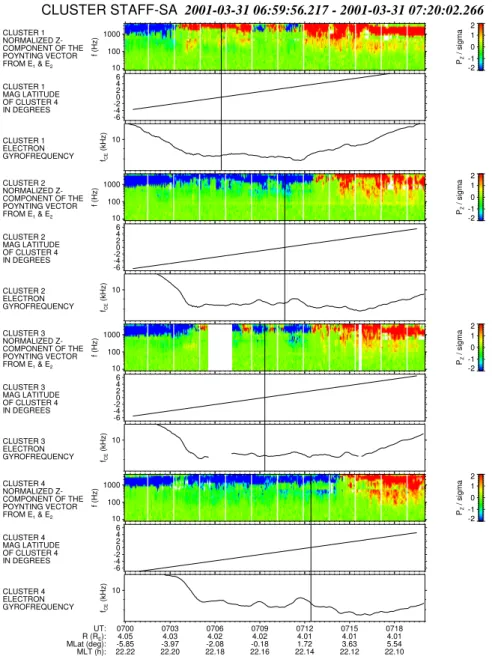
Fig. 2.For each SC, Poynting vector, magnetic latitude, and electron gyrofrequency plots of the event of Fig. 1 between 07:00 and 07:20 UT. The black vertical lines correspond to the magnetic equator crossing for each SC according to a model.
sense of rotation and axes of the (magnetic) polarisation el-lipse, the wave vector direction, the Poynting vector, and the refractive index (Santol´ık, 2001; Santol´ık et al., 2001a). The main purpose of PRASSADCO is to facilitate the scientific analysis of the spectral matrix obtained by the STAFF-SA instruments aboard the four spacecraft. The input to this pro-gramme is obtained from the so-called Raw Data Medium, which are CD-ROMs produced by ESA containing the time-ordered raw Cluster data organised by spacecraft and by in-strument, the CSDS (Cluster Science Data System) Prime Parameters (PP) of FGM (Fluxgate Magnetometer, Balogh et al., 1997), and the CSDS Summary Parameters (SP) of the auxiliary data. The results can be represented in different vi-sual and numerical formats. A similar program has been used to analyse data of earlier spacecraft (Santol´ık et al., 2001a,
2001b).
4 Detailed analysis of three events recorded by Cluster
4.1 31 March 2001
Figure 1 represents data recorded by Spacecraft 2 (SC2) on 31 March 2001 between 06:44 and 08:29 UT (MLT =∼ 22.1 hr). The satellite was near perigee at 07:20 UT and crossed the magnetic equator at 07:10 UT. This event takes place between 07:00 and 07:20 UT (Dstis equal to−258 nT,
Kp=9 at 07:00 UT), during the main phase of a great storm
(Dst minimum of −358 nT at 09:00 UT), according to the
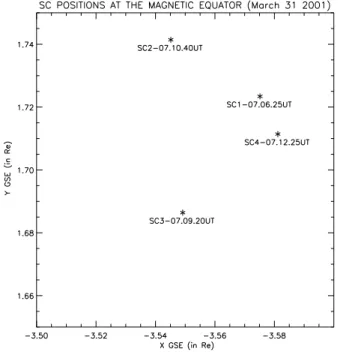
Fig. 3.The stars indicate the SC relative positions when they cross the magnetic equator on 31 March 2001. Their respective crossing times are indicated in UT.
The first and second panels of Fig. 1 show the magnetic and electric power spectral densities; these are, respectively, the average values of the three magnetic and two electric components. The thin vertical white lines in the electric spectrograms are due to changes in the WEC experiment mode which temporarily inhibit the observation of natural waves during WHISPER sounding (D´ecr´eau et al., 1997). Intense electrostatic noise is observed at low frequencies (< 200 Hz), nevertheless, weaker close to the equator. A banded electromagnetic emission of chorus type is seen be-tween 1 kHz and 3 kHz, with the maximum frequency oc-curring close to the perigee. It has been shown by Dunkel and Helliwell (1969) and Burtis and Helliwell (1969) that the chorus emission frequency is related to the equatorial cy-clotron frequency on the magnetic field line passing through the point of observation.
The following panels present polarisation characteristics which are colour-coded and presented in the format of spec-trograms. The third panel shows the degree of polarisation obtained from the eigenvalues of the magnetic spectral ma-trix ; a value close to 1.0 corresponds to the presence of a single plane wave. The value for the banded emission is be-tween 0.8 and 0.9. This high value permits one to have confi-dence in the results of the wave polarisation and propagation parameters given in the following panels. The fourth panel indicates, with a level of confidence, the sense of polarisa-tion with respect to the local magnetic field. Values below −1 mean a left-hand polarised field, values above+1 corre-spond to the right-hand polarisation, and values between−1 and+1 indicate a low confidence level; thus, it takes one of three values, right (red), left (blue) or unpolarised (green).
The banded emission is right-hand polarised, which is con-sistent with previous studies and expectations for this type of wave. The fifth panel represents the ellipticity of polari-sation, that is, the ratio of the circular to the linear compo-nent of the polarisation. The sixth and seventh panels rep-resent, respectively, the polar and the azimuthal angles of the wave normal direction relative to the Earth’s magnetic fieldBo (as given by the FGM PP); the azimuthal angle is
measured from the plane containing the local nadir. These angles are derived from the magnetic spectral matrix by the method of Means (1972). It is seen that the wave propa-gates with an angle≤40◦ relative to the magnetic field, be-ing smaller close to the equator. This is in agreement with previous works by Hayakawa et al. (1984) who found, in the lower frequency range below half the electron gyrofre-quency, wave normals with extremely small angles (5◦–20◦)
relative toBofor chorus observed at the geostationary orbit.
The eighth panel gives a parameter which is related to the sign of thez-component of the Poynting vector. This param-eter is obtained from real parts of the cross spectra between the electric signal and two perpendicular magnetic compo-nents (Santol´ık et al., 2001a). Its absolute value indicates the reliability of the result. The ninth presents a phase shift be-tween the electric signal and a magnetic component which is constructed in order to be perpendicular to both the elec-tric antenna and thez-axis of the coordinate system (Santol´ık and Parrot, 1999). A phase shift near±180◦corresponds to a positivez-component of the Poynting vector. A value near 0◦ corresponds to a negativez-component. These two last pan-els give similar information about the direction of the emis-sion relative to the Earth’s magnetic fieldBo. The tenth panel
gives an estimation of the refractive index (Santol´ık, 2001), assuming that the effective length of the electric antenna is equal to its physical length. Comparison with the theoretical value of the refractive index for whistler mode waves with the same frequency and direction of propagation allows for the evaluation of the transfer function between the plasma and the electric antenna, and the eleventh (last) panel repre-sents the phase shift due to this transfer function. This value also gives the sign of thez-component of the wave normal direction (Santol´ık et al., 2001a, 2001b), and it is observed that the values agree with those in the panels 8 and 9. The pa-rameters displayed in the last four panels are obtained using the EFW sensors and, therefore, they present the same time gaps as in panel 2. The coordinates of SC2 are displayed at the bottom of Fig. 1: the geocentric distance and the GSE (Geocentric Solar Ecliptic) coordinates of the spacecraft are in Earth radii, the magnetic latitude in degrees, and the mag-netic local time in decimal hours.
UT: 2310 2320 2330 2340 2350 0000 0010 0020 0030 R (RE):
MLat (deg): MLT (h): CLUSTER 1
NORMALIZED Z-COMPONENT OF THE POYNTING VECTOR FROM E1 & E2
CLUSTER 1 MAG LATITUDE
CLUSTER 1 ELECTRON GYROFREQUENCY
CLUSTER 2 NORMALIZED Z-COMPONENT OF THE POYNTING VECTOR FROM E1 & E2
CLUSTER 2 MAG LATITUDE
CLUSTER 2 ELECTRON GYROFREQUENCY
CLUSTER 3 NORMALIZED Z-COMPONENT OF THE POYNTING VECTOR FROM E1 & E2
CLUSTER 3 MAG LATITUDE
CLUSTER 3 ELECTRON GYROFREQUENCY
CLUSTER 4 NORMALIZED Z-COMPONENT OF THE POYNTING VECTOR FROM E1 & E2
CLUSTER 4 MAG LATITUDE
CLUSTER 4 ELECTRON GYROFREQUENCY
4.51 -32.04
9.09
4.51 4.43 4.36 4.30 4.27
-32.04 -26.70 -21.12 -15.35 -9.43
9.09 9.03 8.98 8.94 8.91
4.26 4.28
2.63 8.66
8.87 8.85
CLUSTER STAFF-SA 2001-10-21 23:00:00.395 - 2001-10-22 00:29:58.772
-2 -1 0 1 2
PZ
/ sigma
10 100 1000
f (Hz)
-6 -4 -20 2 4 6
10
fCE
(kHz)
-2 -1 0 1 2
PZ
/ sigma
10 100 1000
f (Hz)
-6 -4 -20 2 4 6
10
fCE
(kHz)
-2 -1 0 1 2
PZ
/ sigma
10 100 1000
f (Hz)
-6 -4 -20 2 4 6
10
fCE
(kHz)
-2 -1 0 1 2
PZ
/ sigma
10 100 1000
f (Hz)
-6 -4 -20 2 4 6
10
fCE
(kHz)
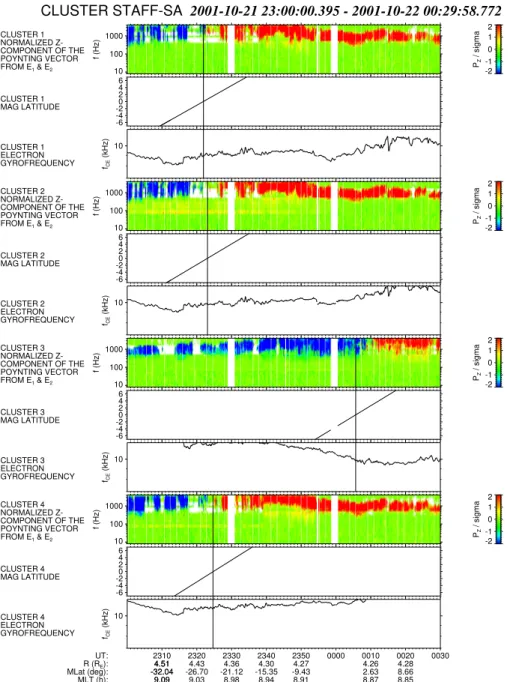
Fig. 4.Same as Fig. 2 for the event recorded on 21–22 October 2001 between 23:00 and 00:30 UT. The black vertical lines correspond to the magnetic equator crossing for each SC according to a model.
the reference SC. In the Poynting vector panels, red indicates that the wave vector is in the direction of the Earth’s mag-netic fieldBo, i.e. towards the north, and blue towards the
south. The electron gyrofrequency is obtained from the FGM CSDS parameters, and its minimum value occurs close to the magnetic equator. Although the electron gyrofrequency does not present a clear minimum for each SC, it does show that the change of direction of propagation occurs close to the magnetic equator. Furthermore, the colour changes in-dicate that the waves propagate away from the equator, and this determines the location of the source. A well localised change of propagation direction is observed on SC2 and SC4, whereas SC1 and SC3 show a much less clearly defined
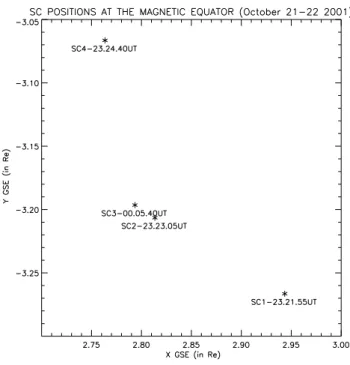
Fig. 5.Same as Fig. 3 for the 21–22 October 2001 event.
chorus source is located at a magnetic latitude of∼ +1.5◦, which is not expected because there is no physical reason to have such a shift. Then it must be admitted that, during this great storm, the magnetic field model used fails to indicate the true location of the magnetic equator.
4.2 21–22 October 2001
Figure 4 represents data from a second event recorded close to perigee. This second event takes place between 21 Oc-tober 2001 at 23:00 UT and 22 OcOc-tober 2001 at 00:30 UT (MLT=∼9 hr), during a period of intense magnetic activity (Dst = −158 nT,Kp =7 at 23:00 UT on 21 October 2001)
just after the main phase of a strong storm (Dst minimum of
−166 nt at 22:00 UT on 21 October 2001). The panels are as in Fig. 2, and again, the geophysical parameters (at the bot-tom) refer to SC3 which lags behind the three other SC by about 45 min. As before,Bohas a minimum value which is
not clear located. The positions of the SC in the(XY )GSE plane when they cross the magnetic equator (as determined by the magnetic latitude equal to zero) are represented in Fig. 5. For each SC, magnetic power-spectral densities of this event (not shown) indicate banded chorus emission with maximum frequency occurring near to the perigee of each SC. Despite some gaps in the chorus elements, all Poynt-ing vector panels of Fig. 4 show a clear separation between southgoing and northgoing waves. We note that SC1, SC2, and SC4, which are close together in space and in time when they cross the magnetic equator (the distance between SC1 and SC4 is 1720 km), present similar features concerning the wave emissions and their Poynting vector directions. Since these three spacecraft cross the magnetic equator at about the same time, the observations thus give a rough indication on
the minimum source size of the chorus emission. For SC3, which crosses the equator some 45 min later, the structure is different and this can be attributed to a temporal effect. For all four SC it is obvious that the position of the source as determined by the change in direction of propagation is not located at the magnetic equator, as identified by the minimum ofBo.
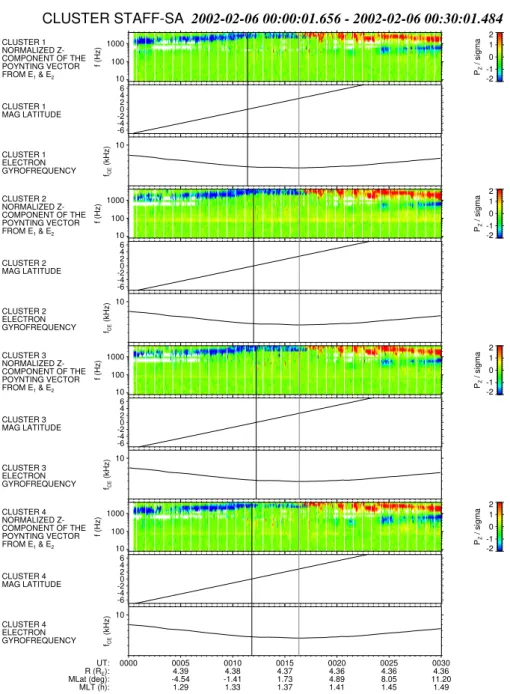
4.3 6 February 2002
A third event is shown in Fig. 6, using the same format as for Figs. 2 and 4. This third event takes place between 00:00 and 00:30 UT(MLT =∼1.4 hr)on 6 February 2002 (Dst = −62 nT,Kp = 3 at 00:00 UT), during the
recov-ery phase of a moderate storm (Dst minimum of−81 nt at
21:00 UT on 5 February). The electron gyrofrequency ob-served on each SC presents a minimum which does not cor-respond to the magnetic equator crossing, as indicated by the magnetic latitude. The Poynting vector panels for each SC show clear separations between southgoing and northgoing chorus waves which, within the limits of experimental error, occur exactly at the minimum ofBo. The chorus source is
cated at the magnetic equator for this event. The equator lo-cation, as determined from the magnetic field measurements, is reliable during this moderate storm.
5 Discussion and conclusions
Due to the upper frequency limit (4 kHz) of the STAFF-SA experiment, it is possible to observe separation between southgoing and northgoing chorus waves in the vicinity of the magnetic equator only under disturbed conditions. Oth-erwise, this separation is observed at much higher frequen-cies. A consequence of this frequency limit is that we ob-serve the chorus part which is below one-half of the local electron gyrofrequency during the three events shown in this paper. These events are associated with disturbed conditions during a great, a strong, and a moderate geomagnetic storm, respectively. Under these conditions the correlation is not good between the position of the magnetic equator, as de-termined from the minimum value ofBomeasured by FGM
and the magnetic latitude obtained from a model. Calcula-tion of the magnetic latitude is done with the CSDS parame-ters which use the coefficients of the IGRF2000 model (Daly, 2002). The model clearly failed during all three storms and is not adapted to determine the true magnetic equator.
However, it is observed during a moderate storm that the chorus source is exactly located at the magnetic equator de-termined by the in-situBomeasurement. This is determined
CLUSTER STAFF-SA 2002-02-06 00:00:01.656 - 2002-02-06 00:30:01.484
UT: 0000 0005 0010 0015 0020 0025 0030
R (RE): 4.39 4.38 4.37 4.36 4.36 4.36
MLat (deg): -4.54 -1.41 1.73 4.89 8.05 11.20
MLT (h): 1.29 1.33 1.37 1.41 1.45 1.49
CLUSTER 1 NORMALIZED Z-COMPONENT OF THE POYNTING VECTOR FROM E1 & E2
-2 -1 0 1 2
PZ
/ sigma
10 100 1000
f (Hz)
CLUSTER 1 MAG LATITUDE
-6 -4 -20 2 4 6
CLUSTER 1 ELECTRON GYROFREQUENCY
10
fCE
(kHz)
CLUSTER 2 NORMALIZED Z-COMPONENT OF THE POYNTING VECTOR FROM E1 & E2
-2 -1 0 1 2
PZ
/ sigma
10 100 1000
f (Hz)
CLUSTER 2 MAG LATITUDE
-6 -4 -20 2 4 6
CLUSTER 2 ELECTRON GYROFREQUENCY
10
fCE
(kHz)
CLUSTER 3 NORMALIZED Z-COMPONENT OF THE POYNTING VECTOR FROM E1 & E2
-2 -1 0 1 2
PZ
/ sigma
10 100 1000
f (Hz)
CLUSTER 3 MAG LATITUDE
-6 -4 -20 2 4 6
CLUSTER 3 ELECTRON GYROFREQUENCY
10
fCE
(kHz)
CLUSTER 4 NORMALIZED Z-COMPONENT OF THE POYNTING VECTOR FROM E1 & E2
-2 -1 0 1 2
PZ
/ sigma
10 100 1000
f (Hz)
CLUSTER 4 MAG LATITUDE
-6 -4 -20 2 4 6
CLUSTER 4 ELECTRON GYROFREQUENCY
10
fCE
(kHz)
Fig. 6. Same as Figs. 2 and 4 for the event recorded on 6 February 2002 between 00:00 and 00:30 UT. The black and grey vertical lines correspond to the magnetic equator crossing for each SC according to a model, and to the minimum of the local gyrofrequency, respectively.
et al., 2001). Moreover, the second point is that, during the great magnetic storm of 31 March 2001, rapid changes in the direction of the chorus waves are also shown on SC1 and SC3 around the magnetic equator. This could correspond either to a rapid change in the source position or more probably, to a larger extension of the source in the transverse direc-tion. The duration of these fluctuations is almost similar on the two spacecraft (∼8 min), and considering their velocities, it corresponds to a transverse length of the source equal to ∼2000 km. This is in agreement with Helliwell (1967), who predicted that the length of the source parallel to the field line should be of the order of 1000–3000 km.
Future work will extensively study the source dimension
of these chorus waves in the vicinity of the magnetic equator (the source region), only a rough estimate of the minimum size of this region being given in the case of the first and sec-ond events. A forthcoming paper will also consider south-ward propagating waves in the Northern Hemisphere, as it is observed in Fig. 6 after 00:24 UT at frequencies between 700 and 1000 Hz.
Acknowledgements. This work has benefited by a Tsurutani’s com-ment about the use of the magnetic field during a Cluster workshop. Thanks are due to the Pis of the FGM (A. Balogh) and EFW (M. Andr´e) experiments for the use of their data, and to the Hungar-ian Cluster Data Center which provides auxiliary data.Dstindices
Univer-sity. ESA and CNES are thanked for their support for the STAFF experiment.
The Editor in Chief thanks N. Meredith and another referee for their help in evaluating this paper.
References
Balogh, A., Dunlop, M. W., Cowley, S. W. H., Southwood, D. J., Thomlinson, J. G., Glassmeier, K. H., Musmann, G., L¨uhr, H., Buchert, S., Acu˜na, M. H., Fairfield, D. H., Slavin, J. A., Riedler, W., Schwingenschuh, K., Kivelson, M. G., and the Cluster mag-netometer team: The Cluster magnetic field investigation, Space Science Rev., 79, 65–91, 1997.
Burtis, W. J. and Helliwell, R. A.: Banded chorus: A new type of VLF radiation observed in the magnetosphere by OGO-1 and OGO-3, J. Geophys. Res., 74, 3002–3010, 1969.
Burton, R. K. and Holzer, R. E.: The origin and propagation of chorus in the outer magnetosphere, J. Geophys. Res., 79, 1014– 1023, 1974.
Cornilleau-Wehrlin, N., Gendrin, R., Lefeuvre, F., Parrot, M., Grard, R., Jones, D., Bahnsen, A., Ungstrup, E., and Gibbons, W.: VLF electromagnetic waves observed onboard GEOS-1, Space Science Rev., 22, 371–382, 1978.
Cornilleau-Wehrlin, N., Chauveau, P., Louis, S., Meyer, A., Nappa, J. M., Perraut, S., Rezeau, L., Robert, P., Roux, A., de Villedary, C., de Conchy, Y., Friel, L., Harvey, C. C., Hubert, D., Lacombe, C., Manning, R., Wouters, F., Lefeuvre, F., Parrot, M., Pinc¸on, J. L., Poirier, B., Kofman, W., Louarn, P., and the STAFF inves-tigator team: The Cluster STAFF experiment (Spatio Temporal Analysis of Field Fluctuations Experiment), Space Science Rev., 79, 107–136, 1997.
Cornilleau-Wehrlin, N., Chanteur, G., Rezeau, L., Parrot, M., Pinc¸on, J. L., and STAFF team: The Cluster STAFF experi-ment specific multi-point analysis, Proc. Cluster-II Workshop on Multiscale/Multipoint Plasma Measurements, London, 22–24 September 1999, ESA SP-449, February 2000.
Cornilleau-Wehrlin, N., Chanteur, G., Perraut, S., Pinc¸on, J. L., Rezeau, L., Robert, P., Roux, A., de Villedary, C., Canu, P., Mak-simovic, M., de Conchy, Y., Hubert, D., Lacombe, C., Lefeu-vre, F., Parrot, M., Pinc¸on, J. L., D´ecr´eau, P. M. E., Harvey, C. C., Louarn, Ph., Kofman, W., Santol´ık, O., Alleyne, H. St. C., Roth, M., and STAFF team: First results obtained by the Cluster STAFF experiment, Ann. Geophysicae, 21, this issue, 437–456, 2003.
Daly, P. W.: Users Guide to the Cluster Science Data Sys-tem, DS-MPA-TN-0015, ftp://ftp.estec.esa.nl/pub/csds/task for/ users guide/csds guide.html, 19 April 2002.
D´ecr´eau, P. M. E., Fergeau, P., Krasnosels’kikh, V., L´evˆeque, M., Martin, Ph., Randriamboarison, O., Sen´e, F. X., Trotignon, J. G., Canu, P.: M¨ogensen, P.B., and the Whisper experimenters: Whisper, a resonance sounder and wave analyser: performances and perspectives for the Cluster mission, Space Sci. Rev., 79, 157–193, 1997.
Dunkel, N. and Helliwell, R.: Whistler mode emissions in the OGO 1 satellite, J. Geophys. Res., 74, 6371–6385, 1969.
Gustafsson, G., Bostr¨om, R., Holback, B., Holmgren, G., Lundgren, A., Stasiewicz, K., Ahl´en, L., Mozer, F. S., Pankow, D., Harvey, P., Berg, P., Ulrich, R., Pedersen, A., Schmidt, R., Butler, A.,
Fransen, A. W. C., Klinge, D., Thomsen, M., F¨althammar, C. G., Lindqvist, P.-A., Christenson, S., Holtet, J., Lybekk, B., Sten, T. A., Tanskanen, P., Lappalainen, K., and Wygant, J.: The electric field and wave experiment for the Cluster mission, Space Sci. Rev., 79, 137–156, 1997.
Hayakawa, M., Yamanaka, Y., Parrot, M., and Lefeuvre, F.: The wave normals of magnetospheric chorus emission observed on-board GEOS-2, J. Geophys. Res., 89, A5, 2811–2821, 1984. Helliwell, R. A.: A theory of discrete emissions from the
magneto-sphere, J. Geophys. Res., 72, 4773–4790, 1967.
Kennel, C. F. and Petschek, H. E.: Limit on stably particle fluxes, J. Geophys. Res., 71, 1–28, 1966.
LeDocq, M. J., Gurnett, D. A., and Hospodarsky, G. B.: Chorus source locations from VLF Poynting flux measurements with the Polar spacecraft, Geophys. Res. Lett., 25 (21), 4063, 1998. Loewe, C. A. and Pr¨olss, G. W.: Classification and mean behavior
of magnetic storms, J. Geophys. Res., 102, 14 209–14 213, 1997. Means, J. D.: Use of the three-dimensional covariance matrix in analyzing the polarization properties of plane waves, J. Geophys. Res., 77, 5551–5559, 1972.
Meredith, N. P., Horne, R. B., and Anderson, R. R.: Substorm de-pendence of chorus amplitudes: implications for the accelera-tion of electrons to relativistic energies, J. Geophys. Res., 106, 13 165–13 178, 2001.
Nagano, I., Yagitani, S., Kojima, H., and Matsumoto, H.: Analysis of wave normal and Poynting vectors of the chorus emissions observed by Geotail, J. Geomagn. Geoelectr., 48, 299–307, 1996. Pedersen, A., Cornilleau-Wehrlin, N., de la Porte, B., Roux, A., Bouabdellah, A., D´ecr´eau, P. M. E., Lefeuvre, F., Sen´e, F. X., Gurnett, D., Huff, R., Gustafsson, G., Holmgren, G., Woollis-croft, L. J. C., Thompson, J. A., and Davies, P. H. N.: The Wave Experiment Consortium (WEC), Space Sci. Rev., 79, 93–106, 1997.
Santol´ık, O. and Parrot, M.: Case studies on the wave propagation and polarization of ELF emissions observed by Freja around the local proton gyrofrequency, J. Geophys. Res., 104, 2459–2575, 1999.
Santol´ık, O.: Propagation Analysis of Staff-SA Data with Co-herency Tests, LPCE/NTS/073.C, Lab. Phys. Chimie Envi-ron./CNRS, Orl´eans, France, 2001.
Santol´ık, O., Lefeuvre, F., Parrot, M., and Rauch, J. L.: Complete wave-vector directions of electromagnetic emissions: Applica-tions to INTERBALL-2 measurements in the night-side auroral zone, J. Geophys. Res., 106, 13 191–13 201, 2001a.
Santol´ık, O., Lefeuvre, F., Parrot, M., and Rauch, J. L.: Propagation ofZ-mode and whistler-mode emissions observed by Interball 2 in the nightside auroral region, J. Geophys. Res., 106, 21 137– 21 146, 2001b.
Sazhin, S. S. and Hayakawa, M.: Magnetospheric chorus emissions: A review , Planet. Space Sci., 40, 681–697, 1992.
Tsurutani, B. T. and Smith, E. J.: Postmidnight chorus: a substorm phenomenon, J. Geophys. Res., 79, 118–127, 1974.
Tsurutani, B. T. and Smith, E. J.: Two types of magnetospheric ELF chorus and their substorm dependences, J. Geophys. Res., 82, 5112–5128, 1977.