Reveal Post-F1 Status of a Pilot Whale
Laura Miralles1*, Santiago Lens2, Antonio Rodrı´guez-Folgar3, Manuel Carrillo4, Vidal Martı´n5, Bjarni Mikkelsen6, Eva Garcia-Vazquez1
1Department of Functional Biology, University of Oviedo, Oviedo, Asturias, Spain,2Instituto Espan˜ol de Oceanografı´a, Vigo, Galicia, Spain,3G.R.E.M.MAR Dolphin Rescue and Research Group of Marine Mammals, Ca´mpelo Parroquia de San Juan de Poio, Galicia, Spain,4Canarias Conservacio´n Cetacean Research Society, La Laguna, Canary Islands, Spain,5Sociedad para el Estudio de los Ceta´ceos en el Archipie´lago Canario (SECAC), Yaiza, Canary Islands, Spain,6Faroese Museum of Natural History, To´rshavn, Faroe Islands
Abstract
Visual species identification of cetacean strandings is difficult, especially when dead specimens are degraded and/or species are morphologically similar. The two recognised pilot whale species (Globicephala melasandGlobicephala macrorhynchus) are sympatric in the North Atlantic Ocean. These species are very similar in external appearance and their morphometric characteristics partially overlap; thus visual identification is not always reliable. Genetic species identification ensures correct identification of specimens. Here we have employed one mitochondrial (D-Loop region) and eight nuclear loci (microsatellites) as genetic markers to identify six stranded pilot whales found in Galicia (Northwest Spain), one of them of ambiguous phenotype. DNA analyses yielded positive amplification of all loci and enabled species identification. Nuclear microsatellite DNA genotypes revealed mixed ancestry for one individual, identified as a post-F1 interspecific hybrid employing two different Bayesian methods. From the mitochondrial sequence the maternal species wasGlobicephala melas. This is the first hybrid documented between Globicephala melas and G. macrorhynchus, and the first post-F1 hybrid genetically identified between cetaceans, revealing interspecific genetic introgression in marine mammals. We propose to add nuclear loci to genetic databases for cetacean species identification in order to detect hybrid individuals.
Citation:Miralles L, Lens S, Rodrı´guez-Folgar A, Carrillo M, Martı´n V, et al. (2013) Interspecific Introgression in Cetaceans: DNA Markers Reveal Post-F1 Status of a Pilot Whale. PLoS ONE 8(8): e69511. doi:10.1371/journal.pone.0069511
Editor:Tom Gilbert, Natural History Museum of Denmark, Denmark
ReceivedApril 19, 2013;AcceptedJune 11, 2013;PublishedAugust 19, 2013
Copyright:ß2013 Miralles et al. This is an open-access article distributed under the terms of the Creative Commons Attribution License, which permits unrestricted use, distribution, and reproduction in any medium, provided the original author and source are credited.
Funding:Laura Miralles holds a PCTI Grant from the Asturias Regional Government, referenced BP 10-004. The funders had no role in study design, data collection and analysis, decision to publish, or preparation of the manuscript.
Competing Interests:The authors have declared that no competing interests exist.
* E-mail: [email protected]
Introduction
In a progressively threatened oceanic environment where large species are more and more endangered, cetacean monitoring is increasingly important for estimating population censuses and early detecting signals of species depletion [1]. However, visual species identification is not always accurate. Some species are morphologically similar and their distribution ranges overlap. A correct taxonomic identification is indeed important for practical issues of management and conservation of cetacean species.
The two recognised pilot whale species,Globicephala melasandG. macrorhynchus, are cetaceans of charismatic behaviour. They are highly social and exhibit post-reproductive female care. They are sympatric across a North Atlantic latitudinal area from American to European coasts [2], [3]. Based on their osteology, Van Bree [4] demonstrated that they are two clearly distinct species; however, their external appearance is similar and the morphometric characteristics employed to visual species discrimination partially overlap [5]. Therefore species identification based on external morphology may be difficult and in some cases impossible [6]. Moreover, dead stranded individuals are sometimes highly degraded and their distinctive traits may be lost. For these reasons, as in other forensic zoological studies, DNA-based identification is necessary [7], [8].
Genetic species identification in cetaceans is generally based on maternally inherited mitochondrial DNA (mtDNA). A cetacean sequence database, DNA Surveillance [8], has been created to help in this purpose. It contains reference sequences for all known cetacean species. In addition, other databases like for example GenBank [9] have also reference sequences for cetaceans –and many other organisms. Although mtDNA is more frequently used for cetacean identification [7], [8] nuclear markers may be also needed for this purpose. Some species naturally hybridizee.g.[10], [11], [12]. Hybrids may exhibit morphologically ambiguous phenotypese.g. [13] and therefore nuclear (biparentally inherited) genetic markers are needed for accurate identification of pure species and their hybrids [14]. Nuclear markers are also recommended in cases of PCR contamination [14],e.g. bacterial contamination of cetacean tissues. In this study, we have used mitochondrial and nuclear genetic markers to determine the species of stranded individuals and to investigate the possible existence of some genetic mixture between the two pilot whale species found in waters off northern Spain.
Materials and Methods
melas from Faroe Islands (donated by the Faroese Museum of Natural History) were analysed (Figure 1). All animal samples were obtained from dead specimens: dead strandings and museum collection. We obtained the CITES permit (ESBI00001/12I) and all the permissions from the Faroese Museum of Natural History to analyse the Faroese samples. No one animal suffered nor was injured or killed for this study. The protocol employed was approved by the Committee on the Ethics of Animal Experiments of the University of Oviedo.
DNA was extracted with a Chelex-based protocol [15]. The mitochondrial control region (D-loop) was amplified following Oremuset al.[16]. Sequences were edited with BioEdit Sequence Alignment Editor [17]. NCBI-BLAST [18] and DNA Surveillance [8] online software were employed for species identification. The number of haplotypes, haplotypic and nucleotidic diversities were calculated with DNAsp v5 [19]. A Neighbour-Joining tree with 1 000 bootstrap re-sampling was reconstructed from sequences with PHYLIP v.3.69 [20].
Eight microsatellite loci (EV37MN; EV94MN; 199/200; 415/ 416, 417/418, 409/470; 468/469 and 464/465) were amplified as in Fullard et al. [21] and genotyped employing GeneMapperH Software. A multi-tube method [22] was employed to validate the allele scores. Each microsatellite locus was individually amplified four times in three different thermal cycler machines (Applied Biosystems 2720 Thermal Cycler). Scoring errors, large allele dropout and null alleles were checked with MICROCHECKER [23]. Linkage disequilibrium tests were performed with GENE-POP version 4.2 [24]. Variation parameters (number of alleles; allele richness; minimum, maximum and mean allele length; expected and observed heterozygosities; FIS) and distances
between genotypes for populations (Nei distances) and individuals (Fuzzy set similarity distances) were calculated with Microsatellite Analyser MSA 4.05 [25]. FST distances were calculated with
Arlequin v.3.5.1.3 [26] with 1 023 permutations and 0.05 significance level. Neighbour-Joining trees based on genetic distances and bootstrap (1 000 bootstrapping) were reconstructed with PHYLIP v. 3.69 [20]. Species assignment was done using three different methods widely employed for microsatellites e.g. [27]. The likelihood-based Bayesian method of Rannala and Mountain [28] was performed with GeneClass2 [29] with 0.05 score threshold. Two fully Bayesian methods were also employed: one with the program STRUCTURE 2.3.1 [30] (under the ‘‘Admixture model’’ which assumes that individuals may have mixed ancestry; burn-in period of 100 000 steps followed by 1 000 000 Markov Chain Monte Carlo (MCMC) iterations and five runs for k = 2 -two species), and other with NewHybrids 1.0 [31] software (with 500 000 sweeps after a burn-in period of
100 000 MCMC iterations) that identifies first and second generations hybrids and backcrosses.
Results and Discussion
The markers employed exhibited sufficient variation for discriminating between the two pilot whale species in reference samples. The mitochondrial D-loop haplotypes were clearly species-specific, as expected [12]. Intraspecific polymorphism was found for the two species, with seven and two haplotypes for G. macrorhynchus and G. melas respectively (Table 2). Eight microsatellite loci were assayed, from which two (EV94MN and 468/469) exhibited possible null alleles in our dataset (detected with MICROCHECKER) and were discarded from further analyses. For the six remaining microsatellite loci, null alleles and linkage disequilibrium were found to be non-significant, allowing their use for genetic assignment. Allelic frequencies of the six selected microsatellite loci were deposited in LabArchives, LLC
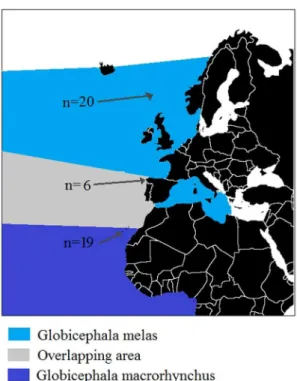
Figure 1. Pilot whale NE Atlantic distribution and sampling areas.Faroe Islands (n = 20), Galicia region (n = 6) and Canary Islands (n = 19).
doi:10.1371/journal.pone.0069511.g001
Table 1.Stranded pilot whale samples analyzed.
Reference Visu P Sex Size Date Location
Galicia01 69/85 G. melas 2 F 450 22/05/1996 42u349420N 09u059070W
Galicia02 72/77 G. melas 3 M 496 14/12/1995 42u169390N 08u299500W
Galicia03 74/84 G. melas 2 F 450 17/05/1996 42u539330N 09u159510W
Galicia04 75/103 G. macrorhynchus 3 F 391 9/09/1998 43u449000N 07u409190W
Galicia05 77/N Not possible 4 M 553 20/03/2005
-Galicia06 78/G G. melas 2 F 360 8/12/2011 42u23.429N 08u49.894W
Visual identification done by experts in cetaceans. P: State of preservation proposed by the European Cetacean Society (ECS) ranged from 2 (freshly dead) to 4 (highly degraded); M: male; F: Female; -: unknown location (accidental capture by-catch).
(DOI: 10.6070/H43F4MHJ) as well as all genotypes (DOI: 10.6070/H4765C78). The number of alleles per locus ranged from 2 to10 (Table 2). No significant differences between expected and observed heterozygosities and low FIS values were found
(Table 2). Highly significant FST-values between species (0.2957,
P,0.00001) confirmed enough resolution for species discrimina-tion.
The six stranded pilot whale here analysed yielded positive amplification at the D-Loop sequence and the six microsatellite
loci considered (Table 3); except for two loci that failed to amplify in one specimen (Galicia01). Genetic assignment was coincident with visual species identification when available (Table 4), and consistent for nuclear and mitochondrial markers. The male of ambiguous phenotype Galicia05 exhibited private alleles of the two parental species for 4 loci (Table 3 and Figures S1, S2, S3, S4, S5, S6): one exclusive allele ofG. melasfor EV37MN and 199/200, one exclusive allele ofG. macrorhynchusat 464/465 locus and two alleles ofG. macrorhynchusat 415/416 locus. These are
unambig-Table 2.Mitochondrial and nuclear variability of reference samples.
DNA marker G. melas G. macrorhynchus All
D-loop AN KC542368 KC542369 KC542370 to KC542376 KC542368 to KC542376
Nh 2 7 9
Hd 0.105 0.692 0.681
P 0.00018 0.00209 0.01243
EV37NM A 6 7 8
AR 5.916 6.640 7.168
Ho 0.750 0.722 0.713
He 0.700 0.722 0.740
FIS 20.046 0.029
199/200 A 2 9 10
AR 2.000 8.473 7.483
Ho 0.150 0.333 0.365
He 0.219 0.417 0.517
FIS 0.337 0.286
415/416 A 4 6 9
AR 3.987 5.810 7.916
Ho 0.800 0.667 0.767
He 0.648 0.792 0.776
FIS 20.211 20.039
417/418 A 2 4 4
AR 2.000 3.989 3.795
Ho 0.350 0.400 0.466
He 0.499 0.480 0.568
FIS 0.321 20.011
409/470 A 7 10 11
AR 6.678 10.000 8.819
Ho 0.750 0.800 0.850
He 0.789 0.560 0.761
FIS 0.075 20.173
464/465 A 7 8 11
AR 6.742 8.000 8.595
Ho 0.789 0.667 0.752
He 0.792 0.639 0.792
FIS 0.031 0.067
All loci A 28 44 53
Ho 0.598 0.769 0.652
He 0.608 0.768 0.692
FIS 0.041 0.109 0.029
For the mitochondrial control region: AN, accession numbers in the GenBank; Nh, number of haplotypes; Hd, Haplotype diversity;P, Nucleotide diversity. For the microsatellite loci: A, number of alleles; AR, mean allelic richness; Ho and He, observed and expected heterozygosity respectively per locus and population; FIS, FIS-value per locus and population. P-values were not significant in any case.
uous signals of post-F1 status. This individual was assigned with NewHybrids to a cross between F2 andG. melas(Table 4). The STRUCTURE software also revealed mixed ancestry for Galicia05 (57% membership of G. melas, 43% G. macrorhynchus; Figure 2). From the mitochondrial DNA its maternal species was G. melas. As in other studies [27], the two fully Bayesian methods (STRUCTURE and NewHybrids software) performed better than partially Bayesian assignment tests (GeneClass), which did not assign Galicia05 significantly to any species. The hybrid status of this individual is clearly visualized in the NJ tree reconstructed from nuclear markers (Figure 3): in the microsatellite-based tree,
Galicia05 appears in the middle of the two species. Its clustering with a reference G. melas individual was not supported by bootstrapping, which was very low. In contrast the tree exhibited high bootstrapping in the rest of the nodes. These results therefore identify the first known hybrid between the two pilot whale species. These two species join the pairs blue whales and fin whales; Dall’s and harbour porpoises; narwhals and belugas, and Risso’s and bottle-nosed dolphins in the short list of sympatric cetaceans that hybridize [32]. A post-F1 hybrid foetus was described between blue and fin whales [13], but this is the first post-F1 adult cetacean documented until now and strongly suggests the possibility of
Figure 2. Individual membership of pilot whale samples from the considered regions estimated with STRUCTURE software.Each
vertical bar represents one individual. Membership toG. macrorhynchusin dark blue and toG. melasin light blue. The numbers identifying stranded individuals are indicated above the corresponding vertical bars; the Post-F1 hybrid is in red.
doi:10.1371/journal.pone.0069511.g002
Table 3.DNA markers of the stranded pilot whales analyzed.
GenBank AN Mitochondrial DNA EV37MN 199/200 415/416 417/418 409/470 464/465
Galicia01 KC542377 G. melas 184 , 184 114 , 114 236 , 236 - - 150 , 152
Galicia02 KC542368 G. melas 186 , 186 114 , 114 234 , 236 187 , 187 180 , 188 150 , 152
Galicia03 KC542378 G. melas 184, 196 114,114 234 , 236 187 , 187 180 , 188 150 , 150
Galicia04 KC542370 G. macrorhynchus 192 , 196 126 , 142 228,232 183 , 183 188 , 190 142 , 152
Galicia05 KC542368 G. melas 184, 186 114, 132 226,232 183 , 187 188 , 190 146, 150
Galicia06 KC542368 G. melas 184, 196 114,114 230 , 230 183 , 187 188 , 188 152 , 152
GenBank AN, accession number of the D-Loop sequence obtained for each whale, available at http://www.ncbi.nlm.nih.gov/genbank/ Exclusive alleles ofG. melasand G. macrorhynchusare marked in italics and bold respectively. Results were confirmed with a multi-tube method to validate the allele scores. The suspected hybrid (Galicia05) has private alleles of both species.
doi:10.1371/journal.pone.0069511.t003
Table 4.Species assignment of stranded pilot whales based on genetic markers.
Mitochondrial DNA Nuclear microsatellite loci
NCBI-BLAST DNA-Surveillance GC2 STRUCTURE NewHybrids
Galicia01 G. melas G. melas G. melas G. melas(0.99) G. melas
Galicia02 G. melas G. melas G. melas G. melas(0.99) G. melas
Galicia03 G. melas G. melas G. melas G. melas(0.99) G. melas
Galicia04 G. macrorhynchus G. macrorhynchus G. macrorhynchus G. macrorhynchus(0.98) G. macrorhynchus
Galicia05 G. melas G. melas Not significant G. melas(0.57)
G. macrorhynchus(0.43)
F26G. melas
Galicia06 G. melas G. melas G. melas G. melas(0.99) G. melas
From mitochondrial D-Loop: online assignation with NCBI-BLAST [17] and DNA-Surveillance [8] software. From nuclear microsatellite loci: NewHybrids [28], GC2 GeneClass2 [26], STRUCTURE 2.3.1 [27] (membership to a species in parenthesis).
interspecific introgression in marine mammals, a good example of Darwinian continuum between varieties and species [32].
Finally, the present results emphasize the need of including nuclear markers in reference databases aimed at identifying cetacean species [8]. SNPs and nuclear sequence data, as well as hypervariable microsatellite loci, can be used for this purpose. As proposed long time ago by Palumbi and Cipriano [14], nuclear markers will help to understand the extent of interspecific hybridization in these marine mammals and its implications for conservation.
Supporting Information
Figure S1 EV37MN microsatellite chromatograms.First graphGlobicephala melas, secondGlobicephala macrorhynchus, and third sample Galicia 05.
(TIF)
Figure S2 199/200 microsatellite chromatograms. Graph order as in Figure S1.
(TIF)
Figure S3 415/416 microsatellite chromatograms. Graph order as in Figure S1.
(TIF)
Figure S4 417/418 microsatellite chromatograms. Graph order as in Figure S1.
(TIF)
Figure S5 409/470 microsatellite chromatograms. Graph order as in Figure S1.
(TIF)
Figure S6 464/465 microsatellite chromatograms. Graph order as in Figure S1.
(TIF)
Author Contributions
Conceived and designed the experiments: EGV SL. Performed the experiments: LM. Analyzed the data: LM. Contributed reagents/ materials/analysis tools: SL ARF MC VM BM. Wrote the paper: LM EGV.
Figure 3. Mitochondrial and nuclear phylogenetic trees of the analyzed samples.Neighbour Joining trees reconstructed based on: A) mitochondrial D-Loop haplotypes; B) microsatellite loci genotypes.G. macrorhynchusis represented in dark blue andG. melasin light blue. Galician strandings are in black except the Post-F1 hybrid (Galicia05) that is in red. Bootstrapping is given for each node.
References
1. Pierce GJ, Caldas M, Cedeira J, Santos MB, Llavona A, et al. (2010) Trends in cetacean sightings along the Galician coast, north-west Spain, 2003–2007, and inferences about cetacean habitat preferences. J Mar Biol Ass UK 90(8): 1547– 1560.
2. Nores C, Pe´rez C (1988) Overlapping range between Globicephala macro-rhynchus and Globicephala melaena in the northeastern Atlantic. Mammalia 52 (1): 51–55.
3. Olson PA, Reilly SB (2002) Pilot whales. In: Perrin WF, Wu¨rsig B, Thewissen JGM, eds. Encyclopedia of Marine Mammals. San Diego, CA: Academic Press, 898–903.
4. Van Bree PHJ (1971) OnGlobicephala sieboldiiGray, 1846, and other species of pilot whales (Notes on Cetacea, Delphinidoidea III). Beaufortia 19 (249): 79–87. 5. Bloch D, Zachariassen M, Zachariassen P (1993) Some external characters of the long-finned pilot whale off the Faroe Islands and a comparison with the short-finned pilot whales. In: Biology of northern Hemisphere pilot whales. A collection of papers. Edited by: G. P. Donovan, C. H. Lockyer and A. R. Martin. Report of the International Whaling Commission. Special Issue 14. 117–135 pp.
6. ICES (2010) Report of the Working Group on Marine Mammal Ecology (WGMME), 12–15 April 2010, Horta, The Azores. ICES CM 2010/ACOM: 24. 212 pp. http://www.ices.dk/reports/ACOM/2010/WGMME/wgmme_ final_2010.pdf
7. Dalebout ML, Van Helden A, Van Waerebeek K, Baker CS (1998) Molecular genetic identification of southern hemisphere beaked whales (Cetacea: Ziphiidae). Mol Ecol 7: 687–694.
8. Ross HA, Lento GM, Dalebout ML, Goode M, Ewing G, et al. (2003) DNA Surveillance: Web-Based Molecular Identification of Whales, Dolphins and Porpoises. J Hered 94(2): 111–114.
9. Benson DA, Cavanaugh M, Clark K, Karsch-Mizrachi I, Lipman DJ, et al. (2013) Genbank. Nucleic Acids Res 41: 36–43.
10. Berube M, Aguilar A (1998) A new hybrid between a blue whale Balaenoptera musculus and a fin whale B. physalus: frecuency and implications of hybridization. Mar Mammal Sci 14: 82–98.
11. Willis PM, Crespi BJ, Dill LM, Baird RW, Bradley Hanson M (2004) Natural hybridization between Dall’s porpoises (Phocoenoides dalli) and harbour porpoises (Phocoena phocoena). Can J of Zoo 82(5): 828–834.
12. Sylvestre JP, Tasaka S (1985) On the intergeneric hybrids in cetaceans. Aquat Mammals 11(3): 101–108.
13. Spilliaert R, Vikingsson G, Arnason U, Palsdottir A, Sigurjonsson J, et al. (1991) Species Hybridization between a Female Blue Whale (Balaenoptera musculus) and a Male Fin Whale (B. physalus): Molecular and Morphological Documentation. J Hered 82 (4): 269–274.
14. Palumbi SR, Cipriano F (1998) Species Identification Using Genetic Tools: The Value of Nuclear and Mitochondrial Gene Sequences in Whale Conservation. J Hered 89(5):459–464.
15. Estoup A, Largiader CR, Perrot E, Chourrout D (1996) Rapid one-tube DNA extraction for reliable PCR detection of fish polymorphic markers and transgenes. Mol Mar Biol Biotech 5: 295–298.
16. Oremus M, Gales R, Dalebout ML, Funahashi N, Endo T, et al. (2009) Worldwide mitochondrial DNA diversity and phylogeography of pilot whales (Globicephala spp.) Biol J Linnean Soc 98: 729–744.
17. Hall TA (1999) BioEdit: a user friendly biological sequence alignment editor and analysis program for Windows 95/98/NT. Nucleic Acids Symp Ser 41: 95–98. 18. Altschul SF, Gish W, Miller W, Myers EW, Lipman DJ (1990) Basic local
alignment search tool. J Mol Biol 215: 403–410.
19. Librado P, Rozas J (2009) DnaSP v5: A software for comprehensive analysis of DNA polymorphism data. Bioinformatics 25: 1451–1452.
20. Felsenstein J (2005) PHYLIP v. 3.6. Department of Genome Sciences, Washington University, Seattle. http://evolution.genetics.washington.edu/ phylip/getme.html.
21. Fullard KJ, Early G, Heide-Jorgensen MP, Bloch D, Rosing-Asvid A, et al. (2000) Population structure of long-finned pilot whales in the North Atlantic: a correlation with sea surface temperature? Mol Ecol 9: 949–958.
22. Allentoft ME, Oskam C, Houston J, Hale ML, Gilbert MTP, et al. (2011) Profiling the Dead: Generating Microsatellite Data from Fossil Bones of Extinct Megafauna—Protocols, Problems, and Prospects. PLoS ONE 6(1): 16670. 23. Van Oosterhout C, Hutchinson WF, Wills DP, Shipley P (2004) MICRO–
CHECKER: software for identifying and correcting genotyping errors in microsatellite data. Mol Ecol Notes 4: 535–538.
24. Raymond M, Rousset F (1995) GENEPOP (version 1.2) population genetics software for exact test and ecumenicism. J Hered 86: 248–249.
25. Dieringer D, Schlsˇtterer C (2003) Microsatellite analyser (MSA): a platform independent analysis tool for large microsatellite data sets. Mol Ecol Notes 3 (1), 167–169.
26. Excoffier L, Lischer HEL (2010) Arlequin suite ver 3.5: A new series of programs to perform population genetics analyses under Linux and Windows. Mol Ecol Res 10: 564–567.
27. Sanz N, Araguas RN, Fernandez R, Vera M, Garcia-Marin J-L (2009) Efficiency of markers and methods for detecting hybrids and introgression in stocked populations. Cons Genet 10(1): 225–236.
28. Rannala B, Mountain JL (1997) Detecting immigration by using multilocus genotypes. Proc Natl Acad Sci USA 94: 9197–9221.
29. Piry S, Alapetite A, Cornuet JM, Paetkau D, Baudouin L, et al. (2004) GENECLASS2: A Software for Genetic Assignment and First-Generation Migrant Detection. J Hered 95(6): 536–539.
30. Pritchard JK, Stephens M, Donnelly P (2000) Inference of population structure using multilocus genotype data. Genetics 155: 945–959.
31. Anderson EC, Thompson EA (2002) A model-based method for identifying species hybrids using multilocus genetic data. Genetics 160: 1217–1229. 32. Mallet J (2008) Hybridization, ecological races and the nature of species:
![Figure 2). From the mitochondrial DNA its maternal species was G. melas. As in other studies [27], the two fully Bayesian methods (STRUCTURE and NewHybrids software) performed better than partially Bayesian assignment tests (GeneClass), which did not assig](https://thumb-eu.123doks.com/thumbv2/123dok_br/16444430.197032/4.918.103.756.92.273/mitochondrial-structure-newhybrids-performed-partially-bayesian-assignment-geneclass.webp)
