547 DOI: 10.1590/1982-0224-20150015
Genetic structuring of
Salminus hilarii
Valenciennes, 1850
(Teleostei: Characiformes) in the rio Paraná basin as revealed by
microsatellite and mitochondrial DNA markers
Juliana Viana da Silva
1, Eric M. Hallerman
2,
Laura Helena Orfão
3and
Alexandre Wagner Silva Hilsdorf
1Genetic variation of Salminus hilarii was assessed by screening microsatellite loci and mitochondrial D-loop DNA across four sampling in the upper rio Paraná basin of Brazil. Genetic diversity – measured as mean expected heterozygosity (0.904) and mean number of alleles across populations (13.7) – was reasonably high. Differentiation of microsatellite allele frequencies among populations was shown to be low but significant by AMOVA ΦST (0.0192), and high by DEST (0.185). D-loop
variation was high, with haplotypic diversity of 0.950 and nucleotide diversity of 0.011. Mitochondrial DNA-based estimates for population differentiation were high, with an overall ΦST of 0.173. The results of tests of nuclear and mitochondrial
variation yielded no unequivocal inference of historical demographic bottleneck or expansion. Genetic differentiation observed among S. hilarii populations in the rio Grande may be caused by a combination of historical differentiation and recent gene-flow disruption caused by the dams followed by reproduction of isolated spawning assemblages in mid-sized tributaries of the respective reservoirs. We present spatially more intensive sampling of S. hilarii populations across the rio Paraná basin in order to more effectively distinguish between historical and contemporary differentiation.
A variabilidade genética de Salminus hilarii foi avaliada por lócus microssatélites e sequências D-Loop do DNA mitocondrial em quatro populações da região da bacia do Alto Paraná. A diversidade genética – medida pela heterozigosidade média (0,904) e número de alelos médios das populações (13,7) – foi razoavelmente alta. A diferenciação das frequências alélicas entre as populações foi baixa, mas significativa pela AMOVA ΦST (0,0192), e alta pelo DEST (0,185). A variação mitocondrial
foi alta com uma diversidade haplotípica de 0,950 e uma diversidade nucleotídica de 0,011. Estimativas de diferenciação populacional baseadas no DNA mitocondrial foram altas, com um valor global de ΦST de 0,173. Os resultados dos testes da
variação nuclear e mitocondrial demonstram nenhuma inequívoca inferência histórica de contração e expansão demográfica. A diferenciação genética observada entre as populações de S. hilarii no rio Grande pode ter sido causada pela combinação de diferenciação histórica e interrupção recente do fluxo gênico causada pela construção de barragens seguida por um isolamento reprodutivo de populações em tributários de médio porte dos respectivos reservatórios. Nós apresentamos uma amostragem mais ampla e intensiva de populações de S. hilarii ao longo da bacia do alto rio Paraná para se efetivamente distinguir se a diferenciação genética das populações encontrada é histórica ou contemporânea.
Keywords: D-loop, River disruption, STR, Tabarana.
1Núcleo Integrado de Biotecnologia, Universidade de Mogi das Cruzes, Caixa Postal 411, 08780-911 Mogi das Cruzes, SP,
Brazil. (JVS) [email protected], (AWSH) [email protected] (corresponding author)
2Department of Fish and Wildlife Conservation, Virginia Polytechnic Institute and State University Blacksburg, VA 24061,
USA. [email protected]
3Faculdade de Agronomia, Universidade José do Rosário Vellano, Rodovia MG 179, Km 0, 37130-000 Alfenas, MG, Brazil.
Introduction
Salminus hilarii (Characiformes: Bryconidae) is one of five species of its genus, and is widely distributed in the Paraná, Paraguay and São Francisco rivers basins in Argentina, Brazil, Paraguay and Uruguay (Langeani et al., 2007; Lima & Britski, 2007). Salminus hilarii is commonly known as tabarana or dourado branco in Portuguese, and as dorado, plateado, or sábalo in Spanish.
Due to its migratory life history and the broad distribution of S. hilarii across the sub-basins of the upper rio Paraná basin, populations presumably were connected before any anthropogenic impacts affected their current population genetic structure. Using microsatellite DNA markers and mitochondrial D-loop DNA sequences, we assessed the genetic diversity and population differentiation of S. hilarii at four locations in the upper rio Paraná basin against the null hypothesis of no population structure. Because short-distance migration could give rise to differentiation across space, we also tested our data against an alternative hypothesis of simple isolation by distance.
Material and Methods
Sample collection and DNA extraction. A total of 151 S. hilarii individuals were sampled between 2008 and 2009 from three rivers located within the upper rio Paraná basin: the upper rio Tietê - UTR (n = 56) at 23º34’36’’S 45º58’26’’W, the rio Paranapanema - PAR (n = 19) at 23º10’17’’S 49°24’57’’W; and two sites along the rio Grande: Igarapava - GRI (n = 39) at 19º59’08’’S 47º46’08’’W and Lavras - GRL (n = 37) at 21º08’34’’S 45º02’74’’W that are separated by four dams (Fig. 1). Fin clips were taken from each individual and stored in 95% ethanol at -20°C. Total genomic DNA was extracted following the protocol described by Taggart et al. (1992), with the exception of the use of STE (0.1 M NaCl; 0.05 M Tris-HCl; 0.01 M EDTA).
Microsatellite amplification and data analysis. The genetic diversity at microsatellite loci was screened using five primer sets (Sh01, Sh05, Sh10, Sh12 and Sh16) designed for S. hilarii (Silva & Hilsdorf, 2011). DNA amplifications were performed in a PTC-100 thermocycler (MJ Research, Waltham, MA, USA) with 10 x buffer (100 mM Tris–HCL pH 8.8, 500 mM KCl), 1.5–2.5 mM MgCl2, 2.5 mM dNTPs, 10 µM of each primer, 5 U of Taq DNA polymerase (Fermentas Life Sciences, SP, Brazil), 80 ng of template DNA, and sterile water to a final volume of 10 µL. The PCR parameters were as follow: 3 min of denaturation at 94°C; followed by 35 cycles of 94°C for 40 seconds, annealing (at temperatures previously published) for 30 seconds, and 72°C for 1 minute and 30 seconds; and a final extension at 72°C for 8 min. The PCR products were subjected to electrophoresis through a 9% polyacrylamide gel at 6,000 W for 3 h. The DNA fragments were visualized by standard silver staining techniques (Bassam et al., 1991). Microsatellite allele sizing for every individual was estimated manually by two independent individuals who compared the mobility of amplicon bands to those of molecular weight standards (10 bp ladder, Invitrogen) and also to the amplicon of each microsatellite insert as a control using the Alpha Index 6.5 program (AlphaImagerTM, Alpha Innotech Corporation).
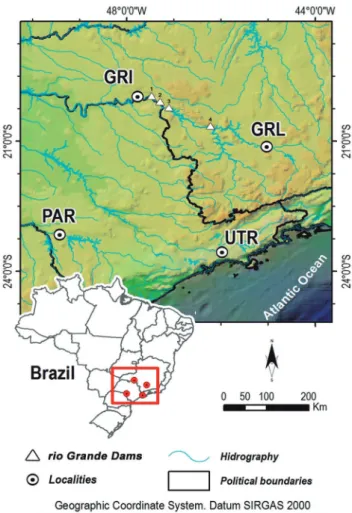
Fig. 1. Sampling sites of Salminus hilarii in the upper rio Paraná basin: rio Grande – Igarapava (GRI); rio Grande– Lavras (GRL); upper rio Tietê (UTR); rio Paranapanema (PAR). Power plants dams in the rio Grande: (1) Jaguara (built in 1971, height 71m), (2) Estreito (built in 1969, height 92 m), (3) Marechal Mascarenhas de Moraes (built in 1957, height 69 m), (4) Furnas (built in 1963, 127 m).
used to infer the causes of any possible departures from HWE for null alleles due to misscoring and large-allele dropout. Linkage disequilibrium was examined using the log likelihood ratio statistic (G-test) calculated using GENEPOP, version 4.2 (Rousset, 2008) with 10,000 dememorizations, 100 batches, and 5,000 iterations per batch.
Interpopulation genetic differentiation of mitochondrial D-loop DNA sequences was quantified by analysis of molecular variance (AMOVA; Excoffier et al., 1992) with ΦST (Weir & Cockerham, 1984) as the differentiation
parameter and 10,000 permutations using Arlequin, version 3.5.1.3 (Excoffier & Lischer, 2010). A sequential Bonferroni adjustment was used to determine the significance levels for simultaneous comparisons (Rice, 1989). Microsatellite genetic differentiation was estimated using the DEST index (Jost, 2008), which quantifies differentiation based on the effective number of alleles rather than on the expected diversity. This estimator improves upon the G’ST method (Gregorius et al., 2007) and produces a maximum of unity when populations are entirely differentiated (i.e., they share no alleles) and a minimum of zero when no differentiation exists (i.e., when populations share all alleles at the same frequencies). DEST was calculated using DEMEtics, version 0.8.7 (Gerlach et al., 2010) using harmonic mean estimate and statistical testing by bootstrapping with 10,000 permutations. DEST genetic distanceswere used to perform a Mantel test to assess the correlation between geographic and genetic distances between populations using the Isolation by Distance Web Service, version 3.23 (Jensen et al., 2005) with 10,000 randomizations.
BOTTLENECK 1.2.02 (Cornuet & Luikart, 1997) was used to assess the possibility of recent reduction in effective population size in each population using the Wilcoxon test (Luikart et al., 1998) under the infinite alleles (IAM), stepwise mutation (SMM), and two-phase (TPM) models of mutation. The Wilcoxon test provides relatively high power and can be applied to data sets with few polymorphic loci. For the TPM, a variance of 30, probability of 90% and 1,000 interactions were assumed.
DNA mitochondrial amplification and data analysis. For mitochondrial D-loop DNA sequences, 79 of the samples were amplified and sequenced using the primers: D-Loop L - 5`-AGAGCGTCGGTCTTGTAAACC-3` (Cronin et al., 1993) and H16498 - 5`- CCTGAAGTAGGAACCAGATG-3` (Meyer et al., 1990). Polymerase chain reaction (PCR) was performed with 3 mM MgCl2, 0.25 mM of each dNTP, 1.0 μM of each primer, 0.5 U of Taq polymerase (Fermentas), 3.5 μL of 10× buffer (Fermentas Life Sciences, SP, Brazil), 80 ng of DNA template, and sterile water to achieve a final volume of 25 μL. PCR parameters included: 3 min of denaturation at 94 °C; followed by 30 cycles of 1 min of denaturation at 94 °C, 1 min of annealing at 56 °C, and 1 min of elongation at 72 °C; and a final elongation step of 10 min at 72 °C. The PCR products were confirmed using electrophoresis in 1% agarose gels, and subsequently were purified using a GFX™
kit (GE Healthcare, São Paulo, Brazil). DNA sequences were analyzed on an ABI Prism™ 3730 DNA Analyzer (Applied Biosystems) using the BigDye® Terminator v3.1. The quality of the sequences was verified using CodonCode Aligner software, version 3.7.1 (http://www.codoncode.com/ aligner/) to generate a consensus sequence. All consensus sequences were aligned using Clustal X, version 2.0 (Larkin et al., 2007) and optimized by eye using Bioedit, version 7.0.9.0 (Hall, 1999).
Genetic variability was quantified as nucleotide diversity (p, Nei, 1987), haplotype diversity (Hd, Nei & Tajima 1981) and the number of polymorphic sites (S) by DnaSP, version 5.10 (Rozas et al., 2003). Tajima’s (1989) D and Fu’s (1997) Fs statistics were calculated to test the null hypothesis of selective neutrality of mtDNA sequences (Rozas et al., 2003) and also to evaluate whether negative, but non-significant values of the D and Fs parameters might indicate population expansion. A haplotype network was built using NETWORK, version 4.1.1.2 (Fluxus Technology, Ltd.) based on the median joining algorithm (Bandelt et al., 1999) with a binary matrix of haplotypes.
The DNA sequence mismatch distribution was calculated using Arlequin, version 3.5.1.3 (Excoffier & Lischer, 2010) to compare the distribution of the observed number of differences between pairs of haplotypes to that expected and thereby to assess the possibility of population expansion. A population that has recently undergone rapid demographic growth exhibits as a unimodal mismatch distribution, while a population at demographic equilibrium exhibits a multimodal distribution (Rogers & Harpending, 1992). Additionally, ΦST
(Weir & Cockerham, 1984) was calculated by the analysis of molecular variance (AMOVA; Excoffier et al., 1992). To assess genetic structure across the populations evaluated, 10,000 permutations were used to test the significance of the hierarchical differentiation using Arlequin, version 3.5.1.3 (Excoffier & Lischer, 2010). The ΦST values found
by Arlequin were used to implement a Mantel test using the Isolation by Distance Web Service, version 3.14 (Jensen et al., 2005) with 10,000 randomizations.
Results
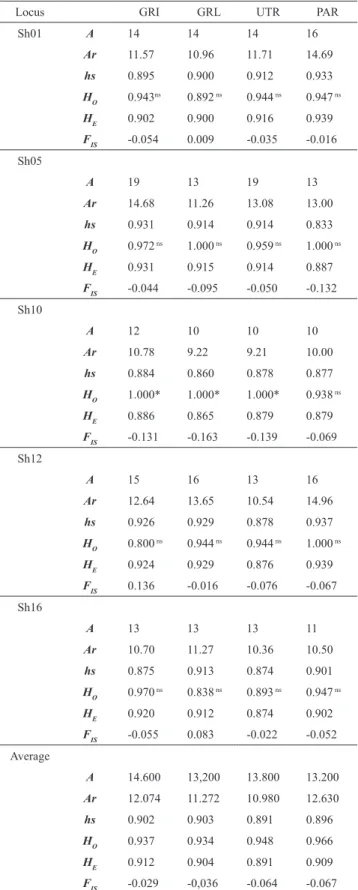
Table 1. Summary statistics for genetic diversity at five microsatellite loci of Salminus hilarii: (A) number of alleles; (Ar) allelic richness; (hs) Nei´s genetic diversity; (Ho) observed heterozygosity; (HE) expected heterozygosity; (FIS) inbreeding cœfficient. ns - Not significant, *Significant (P <
0.0125) after Bonferroni adjustment (nominal α = 0.05).
Locus GRI GRL UTR PAR
Sh01 A 14 14 14 16
Ar 11.57 10.96 11.71 14.69
hs 0.895 0.900 0.912 0.933
H
O 0.943
ns 0.892 ns 0.944 ns 0.947 ns
H
E 0.902 0.900 0.916 0.939
F
IS -0.054 0.009 -0.035 -0.016
Sh05
A 19 13 19 13
Ar 14.68 11.26 13.08 13.00
hs 0.931 0.914 0.914 0.833
H
O 0.972
ns 1.000 ns 0.959 ns 1.000 ns
H
E 0.931 0.915 0.914 0.887
F
IS -0.044 -0.095 -0.050 -0.132
Sh10
A 12 10 10 10
Ar 10.78 9.22 9.21 10.00
hs 0.884 0.860 0.878 0.877
H
O 1.000* 1.000* 1.000* 0.938
ns
H
E 0.886 0.865 0.879 0.879
F
IS -0.131 -0.163 -0.139 -0.069
Sh12
A 15 16 13 16
Ar 12.64 13.65 10.54 14.96
hs 0.926 0.929 0.878 0.937
H
O 0.800
ns 0.944 ns 0.944 ns 1.000 ns
H
E 0.924 0.929 0.876 0.939
F
IS 0.136 -0.016 -0.076 -0.067
Sh16
A 13 13 13 11
Ar 10.70 11.27 10.36 10.50
hs 0.875 0.913 0.874 0.901
H
O 0.970
ns 0.838 ns 0.893 ns 0.947 ns
H
E 0.920 0.912 0.874 0.902
F
IS -0.055 0.083 -0.022 -0.052
Average
A 14.600 13,200 13.800 13.200
Ar 12.074 11.272 10.980 12.630
hs 0.902 0.903 0.891 0.896
H
O 0.937 0.934 0.948 0.966
H
E 0.912 0.904 0.891 0.909
F
IS -0.029 -0,036 -0.064 -0.067
Heterozygote excess (i.e., a negative FIS value) was found for all loci within the respective populations, except for loci Sh01 and Sh16 in the upstream collection from the rio Grande at Lavras (Table 1). Notably, the populations did not depart significantly from HWE expectations after sequential Bonferroni correction (P < 0.0125), with the exception of the Sh10 locus in the rio Grande at both Igarapava and Lavras, and in the upper rio Tietê (Table 1). Results of Micro-Checker tests showed no evidence for stuttering due to amplification or scoring error, large allele dropouts, or null alleles. Tests for linkage disequilibrium yielded significant values (P < 0.05) for but 2 of 40 locus pairs, indicating that allelic variation at all loci segregated independently. The two significant values were observed for different pairs of loci, indicating that these values are not a result of physical linkage between the loci.
Differentiation of microsatellite allele frequencies among populations was low but significant by AMOVA ΦST (0.0192).
The overall Jost’s (2008) DEST estimate was 0.18548 (P = 0.001), ranging from 0.1269 to 0.2676, which demonstrated moderate to high genetic differentiation among the four local populations (Table 3). Results of the Mantel test for association between Jost´s DEST values and geographic distances indicated no significant isolation-by-distance effect (P = 0.292) among the four local S. hilarii populations.
Analyses using Bottleneck 1.2.02 showed significant values (P<0.05) for the upstream rio Grande - Lavras population for all mutational models. Results for the populations from rio Grande – Igarapava and upper rio Tietê were significant only for the infinite alleles and two-phase models, while those for the population from rio Paranapanema were not significant for any of the models. These results suggested that of all the S. hilarii populations screened, only the population from the upstream rio Grande at Lavras may have undergone a recent population reduction.
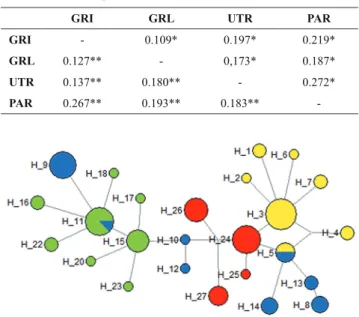
Table 3. Pairwise DEST indices between parenthesis (below diagonal) using microsatellites and mtDNA (above diagonal) between four Salminus hillari samples. Statistical significance of ΦST value was tested based on the exact test based on 10,000 permutations, *P < 0.05, **P < 0.01.
GRI GRL UTR PAR
GRI - 0.109* 0.197* 0.219*
GRL 0.127** - 0,173* 0.187*
UTR 0.137** 0.180** - 0.272*
PAR 0.267** 0.193** 0.183**
-Fig. 2. Unrooted haplotype network for mitochondrial D-loop sequences of Salminus hilarii generated by NETWORK 4.1.1.2 based on the median joining algorithm. Sizes of the circled areas are proportional to the frequencies of the haplotypes at issue. Blue circles: rio Grande -Igarapava (GRI); Green circles: rio Grande -Lavras (GRL); Yellow circles: upper rio Tietê (UTR), and Red circles: rio Parapanema (PAR).
Overall genetic variability expressed as haplotype diversity (Hd) was 0.950 (± 0.009) (Table 2), and nucleotide diversity (p) was 0.011 (± 0.01) for all regions. Genetic differentiation among the four S. hilarii populations was quantified with a global FST of 0.1730 (P = 0.000), and all pairwise comparisons showed high population differentiation among the four populations (Table 3). No significant correlation between FST mtDNAvalues and geographic distance was observed (P = 0.173).
Results of Tajima’s D and Fu’s Fs tests showed no significant deviations from the null hypothesis of selective neutrality for the rio Grande – Igarapava and rio Paranapanema populations. Mitochondrial DNA
sequence variation in the UTR population did not depart significantly from neutrality based on the Fu´s Fs test, but did for Tajima´s D. The rio Grande – Lavras population was the only one to show a significant departure from the hypothesis of selective neutrality for both tests.
The overall mitochondrial DNA sequence mismatch distribution for S. hilarii populations fit the multimodal model, which indicates that the populations collectively have not experienced recent demographic fluctuation and are at demographic equilibrium. However, Fu’s Fs test for demographic expansion within each local population showed significantly negative values for the rio Grande – Lavras and upper rio Tietê populations, suggesting rapid demographic expansion in these populations (Table 2).
Discussion
Within-population genetic variability. Genetic variability at microsatellite DNA markers in four populations of S. hilarii was relatively high; mean HE values of 90.2% and an average of 13.8 alleles per locus were higher than mean values found among 13 freshwater species by DeWoody & Avise (2000). The mean mitochondrial haplotype diversity (h) in the four populations (0.955) suggests that there has been a long time for divergence from ancestral haplotypes of the populations evaluated. The nucleotide divergence (1.1%) was lower than the average value of 2.7% among freshwater fishes of the northern hemisphere (Billington & Hebert, 1991) and lower than the average value of 1.5% for 21 Neotropical freshwater fishes (Hilsdorf, 2013). High levels of heterozygosity and genetic variation are the basis for adaptation and survival of fish populations in changing environments (Lieutenant-Gosselin & Bernatchez, 2006; Mitton & Grant, 1984; Wang et al., 2002); the microsatellite and mitochondrial variability for these four populations of S. hilarii seems sufficient to support ongoing local adaptation.
Populations that have experienced a recent genetic bottleneck exhibit a temporary excess of heterozygosity (Luikart et al., 1998), and rare alleles tend to be observed in heterozygotes much more frequently than in homozygotes, such that heterozygosity may not be lost as fast as allelic diversity (Hartl & Clark, 1997). Results of microsatellite-based bottleneck tests suggested that the rio Grande at Lavras population underwent a recent Table 2. Mitochondrial DNA sampling and descriptive statistics for Salminus hilarii. (N) = number of sequenced individuals; (S) = number of polymorphic sites; (Hd) haplotype diversity; (π) nucleotide diversity; (s.d.) standard deviation.
Sampling N haplotypes S Hd ± s.d. π ± s.d. Tajima D Fu´s Fs
GRI 20 8 15 0.847 ± 0.059 0.011 ± 0.001 1.5925 (P=0.9553) 1.410 (P=0.7635)
GRL 20 10 14 0.911 ± 0.040 0.004 ± 0.001 -1.5277 (P=0.0494) -4.087 (P=0.0043)
UTR 20 7 8 0.742 ± 0.095 0.002 ± 0.004 -1.2857 (P=0.0930) -2.356 (P= 0.0410)
PAR 19 4 5 0.713 ± 0.058 0.003 ± 0.001 0.7802 (P=0.7922) 1.385 (P=0.1300)
population bottleneck. At the same time, this population also showed significant deviation from the null hypothesis of selective neutrality, which may have been caused by different evolutionary forces, such as selective sweep, population bottleneck or recent population growth. The two rio Grande sampling sites (Lavras and Igarapava) are separated by four hydroelectric dams that started operating between 1957 and 1971. None of these dams have fish passage infrastructure, breaking population connectivity for S. hilarii and other migratory fishes in this river. Assuming a two-year age-at-maturity (based on our experience breeding the species), the 21-29 generations of S. hilarii since construction of the dams may have been too short a time for the signatures of demographic processes (population contraction or expansion) or genetic differentiation (due to selection or drift) to become apparent in molecular genetic data sets. This was the case also for bronze gudgeon Coreius heterodon populations separated by dams in the Yangtze River in China (Cheng et al., 2013).
The significantly negative values of Fu’s Fs test of mitochondrial DNA variation in the rio Grande – Lavras and upper rio Tietê populations suggest recent demographic expansion. Indicators of different demographic growth patterns observed for the upper rio Tietê population (i.e., demographic contraction apparent from nuclear markers, expansion from mitochondrial markers) may be explained by differences in the rates of mutation for mitochondrial and nuclear DNA, or contrasting sex-specific demographic processes (Pilkington et al., 2008). Alternatively, the population may have fluctuated demographically. Changing environmental conditions in the upper rio Tietê region, which is toward the headwaters, may explain the low genetic variability and inferred demographic fluctuations in this population. The persistence of S. hilarii populations in this region speaks to the resilience of the species, as rivers and tributaries in this region have undergone many man-made environmental changes, including construction of dams for water supply, removal of riparian vegetation and urban and agricultural pollution (Barrella & Petrere Jr., 2003).
Genetic differentiation among populations. Population genetic analyses revealed genetic structure among the populations of S. hilarii assessed in this study. Jost’s estimator of divergence (DEST) for microsatellites was 0.1858 (P = 0.001). Population divergence measured as DEST was high in part because this index captures the fraction of allelic variation that occurs among populations; i.e., DEST directly measures the divergence of allelic frequencies among populations regardless of the marker’s mutational model or the migration pattern of the species. Thus, the outcomes from DEST suggest that the allele frequency divergence observed would reflect historical genetic structuring of the four populations assessed here, plus any additional effects of recent anthropogenic isolation.
The results generated by comparing the D-loop mitochondrial sequences between the four populations tend corroborate the DEST results. That is, the global FST
value for mtDNA of 0.1730 was high (P = 0.000). All comparisons among the populations using both marker types were high and significant (Table 3). The haplotype network (median-joining haplotype network) shown in Figure 2 reflects the results of historical mtDNA population differentiation; the haplotype network does not have a star-like shape typical of populations that have both low geographic structure and population expansion (Crandall & Templeton, 1993; Castelloe & Templeton, 1994; Avise, 2000).
The geographic distribution of haplotypes in Figure 2 corroborates the high level of population genetic differentiation of mtDNA haplotypes, as well as differences in allele frequencies at microsatellite loci quantified in the DEST indices. Having found genetic structuring in the rio Paraná system, we recommend surveys of the species across its range.
Conservation implications of genetic structuring. In Neotropical freshwater ecosystems lacking anthropogenic influences, different patterns of distribution of interpopulation genetic variability can occur. Migratory fish species in large ecosystems, such as the Pantanal in the State of Mato Grosso, Brazil, may be under the influence of hydrological factors, such as seasonal flood pulses, that genetically homogenize populations, thereby bringing them close to panmixia (as in pacu Piaractus mesopotamicus, Calcagnotto & DeSalle, 2009; Iervorlino et al., 2010). In other cases, non-migratory species or those species making but short migrations tend to show more significant levels of population genetic structure (as in Tietê tetra Brycon insignis- Matsumoto & Hilsdorf (2009); and spotted sorubim catfish Pseudoplatystoma corruscans- Pereira et al. (2009); Carvalho et al. (2012)). Here, S. hilarii populations showed genetic structure among four locations within the rio Paraná basin. While we first expected that contemporary genetic structuring might be the result of isolation by distance (Wright, 1938), no significant correlation between genetic distance and geographic distance was found using either microsatellite or mitochondrial markers. Thus, geographic distance did not explain the current genetic differentiation among the population, suggesting that a stepping stone model of migration (Kimura & Weiss, 1964) may explain the population structure of the four S. hilarii populations. More intensive sampling within the upper rio Paraná basinwill be needed to test this hypothesis.
The authors suggested that lack of connection between up- and downstream populations due to damming led to population fragmentation of S. hilarii in the area studied. Similarly, we found strong genetic differentiation (for mtDNA, FST = 0.109; for microsatellites, DEST = 0.1269) between the Igarapava and Lavras populations on the rio Grande, separated from each other by 422 river km and four hydroelectric dams. The genetic differentiation we observed among S. hilarii populations in the rio Grande may be a combination of historical differentiation and recent effects of gene-flow disruption caused by the dams followed by reproduction of isolated spawning assemblages in mid-sized tributaries of the respective reservoirs. The contribution of contemporary lack of gene flow to historical differentiation is difficult to assess, although we note that the mean value for the mitochondrial FST value (0.192) was slightly greater than that for the corresponding nuclear metric, DEST (0.181). We suggest spatially more intensive sampling of S. hilarii populations across the rio Paraná system in order to more effectively distinguish between historical and contemporary differentiation. Our data set also provides the basis for future studies of temporal variation in genetic variation of S. hilarii in the system. Similar studies of S. hilarii might be undertaken in other river systems, prioritizing those were dams have been or might be constructed.
The case that dams may have imposed fragmentation upon S. hilarii in the upper rio Paraná basin is strengthened by reference to a growing body of literature on the disruptive effects of dams upon gene flow in other riverine fishes. For example, Yamamoto et al. (2004) observed reduced genetic diversity (in terms of numbers of alleles and expected heterozygosity) and highly significant genetic differentiation (expressed as FST) for white-spotted charr Salvelinus leucomaenis isolated by 11 dams in Japan; genetic differentiation was negatively related to the habitat available and positively related to the period of isolation of populations above and below the dams. Roberts et al. (2013) investigated the range-wide population genetic structure of Roanoke logperch Percina rex, a stream fish of the southeastern United States, and found that in the absence of hydrological barriers, gene flow was extensive throughout watersheds. FST was positively related to the spatial distance and degree of hydrological alteration between sites and negatively related to genetic diversity within sites. While the effect of reservoirs was equivocal, dams strongly influenced differentiation: the effect of a dam on FST was comparable to that of a between-site distance of over 1200 km of unimpounded river. Accelerated genetic differentiation of fish populations following disruption of a riverine connection has been observed for blue sucker Cycleptus elongates (Bessert & Ortí, 2008), three-spined stickleback Gasterosteus aculeatus (Raeymaekers et al., 2008), bullhead Cottus gobio (Junker et al., 2012) and
Yazoo darter Etheostoma raneyi (Sterling et al., 2012). Dams are common features of riverine landscapes, and with continuing economic development, their prevalence is expected to increase. The adaptive consequences of the resulting anthropogenically induced divergence are only beginning to be investigated (Waples et al., 2007), and warrant additional research.
Populations of S. hilarii in the upper rio Paraná system have but limited if any contemporary gene flow and therefore may be considered “management units” (MUs) (Moritz, 1994). Management units (MUs) are defined as populations that are demographically independent of one another (Allendorf & Luikart 2007), meaning that their population dynamics depend mostly on local birth and death rates, and not on genetically effective migration from other spawning assemblages. Identification of MUs is useful for designing and implementing fishery management actions, such as managing habitat, setting harvest rates, and monitoring population status. MUs generally do not show long-term independent evolution or strong adaptive variation. At an operational level, Moritz (1994) suggested that MUs are populations that have substantially divergent allele frequencies at many loci. The respective populations of S. hilarii clearly meet this definition.
In our context, recognition of MUs for S. hilarii is critical for establishment of management strategies for monitoring and conserving these populations. Mitigating actions to maintain connectivity among populations upstream and downstream of the dams by fish passage systems has been considered; however, such action has aroused critical discussions on the preservation of the riverine system within the Neotropical region (Pelicice & Agostinho, 2008). Maintenance of genetic diversity in local populations formed after isolation will depend on the conservation of tributaries and environmental integrity to provide effective feeding and reproductive opportunities for the respective demographic units. These measures will contribute to the continued evolution of these populations and the preservation of their genetic resources (Feist et al., 2003).
Acknowledgements
References
Allendorf, F. W. & G. Luikart. 2007. Conservation and the genetics of populations. Malden, MA, Blackwell Publishing, 642p. Andrade, D. R., A. L. Godinho, H. P. Godinho & E. Shimoda.
2004. Biologia reprodutiva da tabarana Salminus hilarii
(osteichthyes, characidae) na represa de Três Marias. Revista Brasileira de Ciência Veterinária, 11: 123-128.
Avise, J. C. 2000. Phylogeography: the history and formation of species. Cambridge, MA, Harvard University Press.
Bandelt, H. -J., P. Forster & A. Röhl. 1999. Median-joining networks for inferring intraspecific phylogenies. Molecular Biology and Evolution, 16: 37-48.
Barrella, W. & M. Petrere Jr. 2003. Fish community alterations due to pollution and damming in Tietê and Paranapanema Rivers (Brazil). River Research and Applications, 19: 59-76. Bassam, B. J., G. Caetano-Anollés & P. M. Gresshoff. 1991. Fast
and sensitive silver staining of DNA in polyacrylamide gels. Analytical Biochemistry, 196: 80-83.
Bessert, M. L. & G. Ortí. 2008. Genetic effects of habitat fragmentation on blue sucker populations in the upper Missouri River (Cycleptus elongates Lesueur, 1918). Conservation Genetics, 9: 821-832.
Billington, N. & P. D. N. Hebert. 1991. Mitochondrial DNA diversity in fishes and its implications for introductions. Canadian Journal of Fisheries and Aquatic Sciences, 48, suppl. 1: 80-94.
Calcagnotto, D. & R. DeSalle. 2009. Population genetic structuring in pacu (Piaractus mesopotamicus) across the Paraná-Paraguay basin: evidence from microsatellites. Neotropical Ichthyology, 7: 607-616.
Carvalho, D. C., D. A. A. Oliveira, L. B. Behegaray & R. A. Torres. 2012. Hidden genetic diversity and distinct evolutionarily significant units in an commercially important Neotropical apex predator, the catfish Pseudoplatystoma corruscans. Conservation Genetics, 13: 1671-1675.
Castelloe, J. & A. R. Templeton. 1994. Root probabilities for intraspecific gene trees under neutral coalescent theory. Molecular Phylogenetics and Evolution, 3: 102-113.
Cheng, F., W. Li, Q. Wu, E. Hallerman & S. Xie. 2013. Microsatellite DNA variation among samples of bronze gudgeon, Coreius heterodon, in the mainsteam of the Yangtze River, China. Ichthyological Research, 60: 165-171.
Cornuet, J. M. & G. Luikart. 1996. Description and power analysis of two tests for detecting recent population bottlenecks from allele frequency data. Genetics, 144: 2001-2014.
Crandall, K. A. & A. R. Templeton. 1993. Empirical tests of some predictions from coalescent theory with applications to intraspecific phylogeny reconstruction. Genetics, 134: 959-969.
Cronin, M. A., W. J. Spearman, R. L. Wilmot, J. C. Patton & J. W. Bickham. 1993. Mitochondrial DNA variation in chinook (Oncorhynchus tshawytscha) and chum salmon (O. keta) detected by restriction enzyme analysis of polymerase chain reaction (PCR) products. Canadian Journal of Fisheries and Aquatic Sciences, 50: 708-715.
DeWoody, J. A. & J.C. Avise. 2000. Microsatellite variation in marine, freshwater and anadromous fishes compared with other animals. Journal of Fish Biology, 56: 461-473.
El Mousadik, A. & R. J. Petit. 1996. Chloroplast DNA phylogeography of the argan tree of Morocco. Molecular Ecology, 5: 547-555.
Esguícero, A. L. H. & M. S. Arcifa. 2010. Fragmentation of a Neotropical migratory fish population by a century-old dam. Hydrobiologia, 638: 41-53.
Excoffier, L. & H. E. L. Lischer. 2010. Arlequin suite ver 3.5: a new series of programs to perform population genetics analyses under Linux and Windows. Molecular Ecology Resources, 10: 564-567.
Excoffier, L. G., P.E. Smouse & J. M. Quattro. 1992. Analysis of molecular variance inferred from metric distances among DNA haplotypes: application to human mitochondrial DNA restriction data. Genetics, 131: 479-491.
Feist, B. E., E. A. Steel, G. R. Pess & R. E. Bilby. 2003. The influence of scale on salmon habitat restoration priorities. Animal Conservation, 6: 271-282.
Fu, Y.-X. 1997. Statistical tests of neutrality of mutations against population growth, hitchhiking and background selection. Genetics, 147: 915-925.
Gerlach, G., A. Jueterbock, P. Kraemer, J. Deppermann & P. Harmand. 2010. Calculations of population differentiation based on GST and D: forget GST but not all of statistics! Molecular Ecology, 19: 3845-3852.
Goudet, J. 1995. FSTAT (version 1.2): a Computer program to Calculate F-statistics. Journal of Heredity, 86: 485-486. Graça, W. J. & C. S. Pavanelli. 2007. Peixes da planície de
inundação do alto rio Paraná e áreas adjacentes. Maringá, Eduem, 241p.
Gregorius, H. R., B. Degen & A. Koenig. 2007. Problems in the analysis of genetic differentiation among populations – a case study in Quercus robur. Silvae Genetica, 56: 190-199. Guo, S. W. & E. A. Thompson. 1992. Performing the exact test of
Hardy-Weinberg proportion for multiple alleles. Biometrics, 48: 361-372.
Hall, T. A. 1999. BioEdit: a user-friendly biological sequence alignment editor and analysis program for Windows 95/98/ NT. Nucleic Acids Symposium Series, 41: 95-98.
Hartl, D. L. & A. G. Clark. 1997. Principles of population genetics. Sunderland, MA, Sinauer Associates, 542p.
Hilsdorf, A. W. S. 2013. Marcadores moleculares e a caracterização dos recursos genéticos de peixes: desenvolvimento sustentável da Aquicultura e da pesca de espécies nativas de água doce no Brasil. Unpublished Livre Docência Thesis, Faculdade de Zootecnia e Engenharia de Alimentos, Universidade de São Paulo, Pirassununga, Brazil, 159p.
Honji, R. M., A. M. Narciso, M. I. Borella, E. Ramagosa & R. G. Moreira. 2008. Patterns of oocyte development in natural habitat and captive Salminus hilarii Valenciennes, 1850 (Teleostei: Characidae). Fish Physiology and Biochemistry, 35: 109-123.
Iervolino, F., E. K. Resende & A. W. S. Hilsdorf. 2010. The lack of genetic differentiation of pacu (Piaractus mesopotamicus) populations in the Upper-Paraguay Basin revealed by the mitochondrial DNA D-loop region: implications for fishery management. Fisheries Research, 101: 27-31.
Jensen, J. L., A. J. Bohonak & S. T. Kelley. 2005. Isolation by distance, web service.BMC Genetics, 6: 13(p. 1-6).
Jost, L. 2008. GST and its relatives do not measure differentiation. Molecular Ecology, 17: 4015-4026.
Kalinowski, S. T. 2006. HW-QUICKCHECK: an easy-to-use computer program for checking genotypes for agreement with Hardy-Weinberg expectations. Molecular Ecology Notes, 6: 974-979.
Kimura, M. & G. H. Weiss. 1964. The stepping stone model of population structure and the decrease of genetic correlation with distance. Genetics, 49: 561-576.
Langeani, F., R. M. C. Castro, O. T. Oyakawa, O. A. Shibatta, C. S. Pavanelli & L. Casatti. 2007. Diversidade da ictiofauna do alto rio Paraná: composição atual e perspectivas futuras. Biota Neotropica, 7: 181-197.
Larkin, M. A., G. Blackshields, N. P. Brown, R. Chenna, P. A. McGettigan, H. McWilliam, F. Valentin, I. M. Wallace, A. Wilm, R. Lopez, J. D. Thompson, T. J. Gibson & D. G. Higgins. 2007. Clustal W and Clustal X version 2.0. Bioinformatics, 23: 2947-2948.
Lieutenant-Gosselin, M. & L. Bernatchez. 2006. Local heterozygosity-fitness correlations with global positive effects on fitness in threespine stickleback. Evolution, 60: 1658-1668.
Lima, F. C. T. & H. A. Britski. 2007.Salminus franciscanus, a new species from the rio São Francisco basin, Brazil (Ostariophysi: Characiformes: Characidae). Neotropical Ichthyology, 5: 237-244.
Luikart, G., F. W. Allendorf, J. -M. Cornuet & W. B. Sherwin. 1998. Distortion of allele frequency distributions provided a test for recent population bottlenecks. Journal of Heredity, 89: 238-247.
Luz-Agostinho, K. D. G., L. M. Bini, R. Fugi, A. A. Agostinho & H. F. Júlio Jr. 2006. Food spectrum and trophic structure of the ichthyofauna of Corumbá reservoir, Paraná river basin, Brazil. Neotropical Ichthyology, 4: 61-68.
Matsumoto, C. K. & A. W. S. Hilsdorf. 2009. Microsatellite variation and population genetic structure of a neotropical endangered Bryconinae species Brycon insignis Steindachner, 1877: implications for its conservation and sustainable management. Neotropical Ichthyology, 7: 395-402.
Meyer, A., T. D. Kocher, P. Basasibwaki & A. C. Wilson. 1990. Monophyletic origin of Lake Victoria cichlid fishes suggested by mitochondrial DNA sequences. Nature, 347: 550-553. Mitton, J. B. & M. C. Grant. 1984. Associations among protein
heterozygosity, growth rate, and developmental homeostasis. Annual Review of Ecology and Systematics, 15: 479-499. Moritz, C. 1994. Defining ‘Evolutionarily Significant Units’ for
conservation. Trends in Ecology and Evolution, 9: 373-375. Nei, M. 1987. Molecular evolutionary genetics. New York,
Columbia University Press, 512p.
Nei, M. & F. Tajima. 1981. DNA polymorphism detectable by restriction endonucleases. Genetics, 97: 145-163.
Oldani, N. O. 1990. Variaciones de la abundancia de peces del valle del río Paraná. Revue D’Hydrobiologie Tropicale, 23: 67-76.
Pelicice, F. M. & A. A. Agostinho. 2008. Fish-passage facilities as ecological traps in large Neotropical rivers. Conservation Biology, 22: 180-188.
Pereira, L. H. G., F. Foresti & C. Oliveira. 2009. Genetic structure of the migratory catfish Pseudoplatystoma corruscans
(Siluriformes: Pimelodidae) suggests homing behaviour. Ecology of Freshwater Fish, 18: 215-225.
Petrere Júnior, M. 1985. Migraciones de peces de agua dulce en America Latina: algunos comentarios. COPESCAL Documento Ocasional, Roma, no. 1, 17p.
Pilkington, M. M., J. A. Wilder, F. L. Mendez, M. P. Cox, A. Woerner, T. Angui, S. Kingan, Z. Mobasher, C. Batini, G. Destro-Bisol, H. Soodyall, B. I. Strassmann & M. F. Hammer. 2008. Contrasting signatures of population growth for mitochondrial DNA and Y chromosomes among human populations in Africa. Molecular Biology and Evolution, 25: 517-525.
Raeymaekers, J. A. M., G. E. Maes, S. Geldof, I. Hontis, K. Nackaerts, & F. A. M. Volckaert. 2008. Modeling genetic connectivity in sticklebacks as a guideline for river restoration. Evolutionary Applications, 1: 475-488.
Rice, W. R. 1989. Analyzing tables of statistical tests. Evolution, 43: 223-225.
Roberts, J. H., P. L. Angermeier & E. M. Hallerman. 2013. Distance, dams and drift: what structures populations of an endangered, benthic stream fish? Freshwater Biology, 58: 2050-2064. Rogers, A. R. & H. Harpending. 1992. Population growth makes
waves in the distribution of pairwise genetic differences. Molecular Biology and Evolution, 9: 552-569.
Rousset, F. 2008. GENEPOP’ 007: a complete re-implementation of the GENEPOP software for Windows and Linux. Molecular Ecology Resources, 8: 103-106.
Rozas, J., J. C. Sánchez-DelBarrio, X. Messenguer & R. Rozas. 2003. DnaSP, DNA polymorphism analyses by the coalescent and other methods. Bioinformatics, 19: 2496-2497.
Silva, J. V. & A. W. S. Hilsdorf. 2011. Isolation and characterization of polymorphic microsatellite loci from Salminus hilarii
(Characiformes: Characidae). Conservation Genetics Resources, 3: 437-439.
Sterling, K. A., D. H. Reed, B. P. Noonan & M. L. Warren. 2012. Genetic effects of habitat fragmentation and population isolation on Etheostoma raneyi (Percidae). Conservation Genetics, 13: 859-872.
Taggart, J. B., R. A. Hynes, P. A. Prodohl & A. Ferguson. 1992. A simplified protocol for routine total DNA isolation for salmonid fishes. Journal of Fish Biology, 40: 963-965.
Tajima, F. 1989. Statistical method for testing the neutral mutation hypothesis by DNA polymorphism. Genetics, 123: 585-595. Van Oosterhout, C., W. F. Hutchinson, D. P. M. Wills & P. Shipley.
2004. MICRO-CHECKER: software for identifying and correcting genotyping errors in microsatellite data. Molecular Ecology Notes, 4: 535-538.
Wang, S., J. J. Hard & F. Utter. 2002. Genetic variation and fitness in salmonids. Conservation Genetics, 3: 321-333.
Waples, R. S., R. W. Zabel, M. D. Scheuerell & B. L. Sanderson. 2007. Evolutionary responses by native species to major anthropogenic changes to their ecosystems: Pacific salmon in the Columbia River hydropower system. Molecular Ecology, 17: 84-96.
Weir, B. S. & C. C. Cockerham. 1984. Estimating F-statistics for the analysis of population structure. Evolution, 38: 1358-1370. Wright, S. 1938. Size of population and breeding structure in
relation to evolution. Science, 87: 430-431.
Yamamoto, S., K. Morita, I. Koizumi & K. Maekawa. 2004. Genetic differentiation of white-spotted charr (Salvelinus leucomaenis) populations after habitat fragmentation: spatial-temporal changes in gene frequencies. Conservation Genetics, 5: 529-538.
Submitted February 12, 2015 Accepted May 25, 2015 by Claudio Oliveira