EURASIAN JOURNAL OF ECONOMICS AND FINANCE
http://www.eurasianpublications.com
NEGATIVE CURRENCY-RISK-EXPOSURE FOR TURKISH EQUITIES
Salvatore J. Terregrossa
Corresponding Author: Istanbul Aydin University, Turkey. Email: [email protected]
Veysel Eraslan
Borsa Istanbul, Turkey. Email: [email protected]
Abstract
Currency-risk-exposure is an issue for Turkish equities, from two different angles: international-trade and foreign-portfolio-investment. The likely effect is positive for the former, and negative for the latter aspect. Consequently, the overall or net effect on equity value depends on which of these aspects of currency-risk-exposure has the greater impact. The present empirical analysis estimates currency risk of Turkish equities within a multi-factor regression setting, utilizing the framework of the Security Market Plane (SMP) model. The SMP model embodies a conditional relation among three variables: beta, realized excess market-return, and expected excess portfolio-return. The SMP empirical framework is extended to include a currency-risk-factor in the present analysis. The currency-risk-factor is specified as the excess return to holding foreign currency (€; $), relative to holding domestic currency (Turkish Lira). The SMP-related factor is the cross-product term of beta and realized excess market-return (β itrMt). A regression of
realized excess portfolio-returns against the corresponding currency-risk-factor and cross product-term (β itrMt) finds that the Turkish stocks represented in the analysis generally have
overall negative currency-risk-exposure; suggesting that unexpected currency depreciation generally leads to lower values for Turkish stocks (and portfolios of Turkish stocks). Thus, after accounting for the SMP-related interaction-effect between beta and realized excess market-return, currency risk is found to command a premium for the Turkish stocks represented in the analysis.
Keywords: Currency-Risk-Exposure, Foreign-Portfolio-Investment, International-Trade,
Security Market Plane, Portfolio Return, Beta, Market Return
1. Introduction
Currency-risk-exposure is an issue for Turkish equity markets, from two different angles. First, international trade plays a relatively large role in the Turkish economy. Over the test period of the study, exports of goods and services as a percentage of GDP ranges between 21% and 26%, with the mean equal to 23.2%.1 Second, over the same period there are large amounts of foreign portfolio investment in Turkish equity markets. The ratio of the market value of
13
portfolio-investment (equity) holdings to the total market capitalization of Turkish equities ranges from 52.2% in 2003, 72.4% in 2007 to 62.9% in March 2014, with the mean equal to 64.1%.2
The potential effect of an unexpected depreciation of the Turkish currency (Turkish Lira or TL) on Turkish equities is quite different for each of these two aspects of currency-risk-exposure. The likely effect is positive for the international-trade aspect, and negative for the foreign-portfolio-investment aspect. In the current study, the meaning of positive (negative) currency-risk-exposure is that the value of the domestic stock portfolio increases (decreases) when the domestic currency depreciates unexpectedly.
The scenario for positive currency-risk-exposure, in a macroeconomic sense, can be summarized as follows: In an economy with a significant trade sector, an unexpected depreciation of the domestic currency (TL) may generate an increase in net exports, along with an expansion in the import-competing sector. If these expansions sufficiently stimulate total GDP, there may follow correspondingly higher stock prices for Turkish firms in general, and higher values for portfolios of Turkish stocks. Thus, positive currency-risk-exposure: As the TL loses value, the values of portfolios of Turkish stocks increase.
However, a case for negative currency-risk-exposure may be made for a developing economy that is significantly dependent upon foreign portfolio investment, as is Turkey: Events reflecting domestic (and perhaps regional as well) political and/or economic instability may cause outside investors to lose confidence, which in turn could lead these investors to sell their holdings of the local-currency (TL) and local (Turkish)-stocks; leading to corresponding decreases in value of the TL and Turkish stocks. Thus, negative currency-risk-exposure: As the TL loses value, the values of portfolios of Turkish stocks also decrease.
Consequently, the overall or net effect of unexpected currency movement on the values of Turkish equities depends on whether or not the negative effect of the foreign-portfolio-investment aspect exceeds the positive effect of the international-trade aspect of currency-risk-exposure.
Currency risk is estimated in the present analysis within a multi-factor regression setting, utilizing the framework of the Security Market Plane (SMP), a concept developed by Bollen (2010), inspired in part by the work of Pettengill et al. (1995). The SMP embodies a conditional relation among three variables: beta, realized excess market-return, and expected excess portfolio-return. The empirical SMP framework is extended to include a currency-risk-factor in the present analysis. The justification of this modification is explained below in sections 1.1. and 2.
1.1. Background: The Empirical SMP Model
The SMP empirical model is ultimately stated as:
��� = 0+ 1( �����) +��� (Equation 1)
3
Where rit=the observed excess return on portfolio i, rMt=the observed excess return on the market-portfolio, andβ itis the estimated historical beta of portfolio i, all at time t. are
fixed parameters and E [it] = 0. Both the sign and the magnitude of excess market-return are
thereby taken into account in the modeling of excess portfolio-returns. Using Turkish equity market data, the conditional SMP relation is tested in the present analysis with a regression of realized excess portfolio-returns against a corresponding cross product-term of beta and realized excess market-returns, (β itrMt). As Bollen (2010) mentions, the estimated and
2 Source: Borsa Istanbul Database. 3
14
parameters in Equation 1 are of particular interest. If is found to be highly significant and
very close-to-one in value, the implication is that, “[…] to a very large extent, the interaction term
(β itrMt) models the level of portfolio returns well and offers good evidence in support of the CAPM” (p.1237).
However, if the estimated parameter of Equation 1 is found to be non-zero and
statistically significant, this finding would suggest that the interaction-effect between portfolio-beta and realized excess market-return (β itrMt) may not fully account for portfolio-excess-return movement. In addition, it would in part provide motivation to extend the SMP model with a currency-risk-factor in the present study given the fact that currency risk is an issue for Turkish equities (as explained above).4
1.1.1. Background: Extending the SMP Model with a Currency Risk Factor
The currency risk premium, defined as the excess return to holding foreign currency (FC), relative to holding domestic currency (DC), is stated in the present study as: {[(et - et-1)/et-1] +
(Rft(FC))} - (Rft(DC)), where[(et - et-1)/et-1] is the realized percentage change in the monthly exchange
rate at time t; and where Rft(FC)= the risk-free rate of return denominated in the foreign currency
and Rft(DC)= the corresponding risk-free rate of return denominated in the domestic currency
(Turkish Lira or TL in the present study), all at time t.
The empirical model incorporating a currency-risk-factor is expressed as:
��� = 0+ 1 ∗ + 2 ����� +��� (Equation 2)
Where (*) ={[(et - et-1)/et-1] + (Rft(FC))} - (Rft(DC)), and are fixed parameters.
Equation 2 is estimated twice, once employing the euro(€) as the foreign currency in the risk premium, and then also estimated with the dollar ($) as the foreign currency5 with Rft(TL) = the TL
risk-free rate of return (based on the monthly return of the two-month benchmark Turkish Treasury bond), Rft($) = the corresponding $ risk-free rate of return (based on the monthly United
States Treasury bill rate), and Rft(€) = the corresponding € risk-free rate of return (based on the monthly Euro Interbank Offered Rate (Euribor)), all at time t.6
A significantly negative (positive) coefficient () of the currency risk factor in the
estimations of Equation 2 would suggest overall negative (positive) currency-risk-exposure.
1.2. Data and Methodology
Following Bollen (2010), the present empirical analysis pools cross-sectional and time-series data to estimate the SMP model (Equation 1), and the multi-factor model (Equation 2). These
4 Of course, other factors have been shown to be related to asset return, such as firm-size and
book-to-market ratios. See, for example, Ang et al. (2006), which examines the contemporaneous relation between different, realized factor loadings and portfolio realized average returns. The present analysis has a narrower focus, with the main emphasis on currency risk exposure of Turkish equities, in addition to market-related risk (as part of the interaction-effect between portfolio-beta (βit) and realized excess
market-return (rMt)).
5The authors did experiment with a “basket” of the dollar and euro currencies, with weights based on trade
ratios, and also with weights based on various combinations of simple averages. However, these “basket”
approaches did not lead to any better results compared to using a single currency approach. These unreported empirical results are available upon request.
6
15
model specifications are tested using monthly data of a sample of Turkish firms trading on the Istanbul Stock Exchange (or the Borsa Istanbul, as it is presently referred to), over the 135-month period from January 2003 to March 2014. Beginning with the 135-monthly return for each firm in a given sample obtained from the Borsa Istanbul database, the current study directly estimates beta for each firm over the 135-month test period. Monthly firm-returns are regressed against the corresponding monthly-returns of the market portfolio, employing the preceding 36 months of historical data. In this way, 289 firms qualify for sample inclusion, generating 35,281 monthly firm-return observations over the test period.7
In the estimation of firm-beta (and also in the various other model-estimations) the market portfolio is represented by the Borsa Istanbul All Index (or BIST-All), a weighted index of all stocks trading on the Borsa Istanbul (except the ones listed on Emerging Companies Market and Investment Trusts). The monthly return of the BIST-All is obtained from the Borsa Istanbul database.
Ten portfolios, based on the estimated beta calculations, are then constructed for each month of the test period, as follows: In each of the 135 months under analysis, firms are placed in one of ten portfolios based on their estimated beta. Portfolio 1 contains the ten per cent of firms with the lowest betas; the categorization continuing in this manner until Portfolio 10, which contains the ten per cent of firms with the highest betas.
Equations 1 and 2 are then run by pooling time-series with cross-sectional data. Specifically, each of the model regressions is based on 135 months (time-series) of historical data for the 10 beta-classified portfolios (cross-section). Thus each model regression is based on 1350 observations of monthly portfolio excess-return.
To estimate each of these models, an estimated portfolio-beta ( �) is required for each of the ten portfolios in each month, over the 135-month test period. The method employed is to calculate the rolling, historical I for each portfolio in each month, with a regression of the
preceding 36 months of excess-portfolio return against the corresponding excess-market returns. With this approach, each monthly portfolio excess-return observation (for each of the ten portfolios) is assigned the rolling, historical I estimated for that particular beta-classified
portfolio, for that month.
2.Results and Discussion8
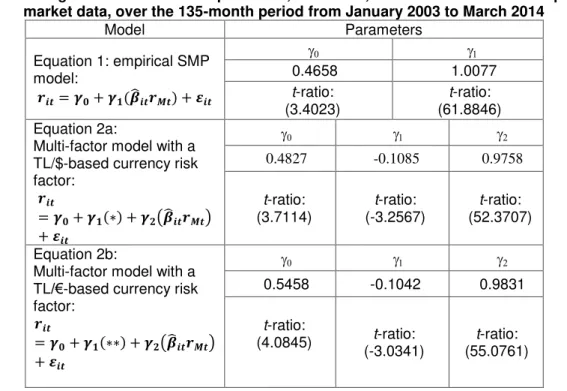
Table 1 above indicates that the intercept term () of Equation 1 in the present study is found to
be nonzero and statistically significant. Additionally, an F-test generates a rejection of the null hypothesis H0:at the both the 5% and 1% levels (the F-test statistic = 20.451 and the critical values at 5% significance and 1% significance, respectively, are 3.849 and 6.655). These respective findings suggest that factors other than the interaction-effect between portfolio-beta and realized excess market-return ( �����), may help determine excess return movement of the Turkish stocks represented in the study. These findings help provide motivation and justification for the extension of the empirical SMP model with a currency-risk-factor in the present study; given that currency-risk is an issue for Turkish equities, as explained above.
Table 1 indicates that the two estimations of the multi-factor model (Equations 2a and 2b) each generate a significant, negative regression coefficient () of the currency-risk-factor; with each estimated coefficient of a similar magnitude (-0.109 and -0.104, respectively). These findings suggest that overall currency-risk-exposure is negative for Turkish equities over the test
7 Thus, the overall data set begins with the year 2000. While there is stock price data for the years before
2000, it is not possible to calculate excess returns for these years without the necessary data for the Turkish treasury-bill rates, which is not available prior to May 1999.
8
16
period of the study; meaning that unexpected currency depreciation generally leads to lower values for Turkish stocks (and portfolios of Turkish stocks) during this period. The inference is that the negative effect of the foreign-portfolio-investment aspect exceeds the positive effect of the international-trade aspect of currency-risk-exposure, regarding unexpected currency depreciation over the test period. Thus evidence is provided suggesting that currency-risk-exposure is related to excess portfolio-returns, for the Turkish stocks represented in the analysis.
Table 1 also indicates that in the estimation of both the SMP model (Equation 1) and the multi-factor model (Equations 2a and 2b) with Turkish equity-market data, the regression coefficient of the interactive product-term of portfolio-beta and market portfolio excess-return
( �����) is found to be significantly positive and very close-to-one in value. Thus, evidence is provided suggesting that the interactive product-term ( �����) to a large extent explains excess-return movement for portfolios of Turkish equities. These particular findings are consistent with, and provide cross-equity-market confirmation of similar findings of the Bollen (2010) study.
Table 1. Regression results for Equations 1, 2a and 2b; estimated with Turkish equity-market data, over the 135-month period from January 2003 to March 2014
Model Parameters
Equation 1: empirical SMP model:
���= + ( �����) +���
0.4658 1.0077
t-ratio: (3.4023)
t-ratio: (61.8846) Equation 2a:
Multi-factor model with a TL/$-based currency risk factor:
���
= + ∗ + �����
+���
0.4827 -0.1085 0.9758
t-ratio: (3.7114) t-ratio: (-3.2567) t-ratio: (52.3707) Equation 2b:
Multi-factor model with a TL/€-based currency risk factor:
���
= + ∗∗ + �����
+���
0.5458 -0.1042 0.9831
t-ratio:
(4.0845) t-ratio: (-3.0341)
t-ratio: (55.0761)
Notes: = ∗{[(et (TL/$) - et-1(TL/$))/et-1(TL/$)] + (Rft ($))} - (Rft (TL));∗∗ = {[(et (TL/€) - et-1(TL/€))/e t-1(TL/€)] + (Rft (€))} - (Rft (TL)).
2.1. Summary Remarks
Currency risk is estimated within a multi-factor regression setting, and overall currency-risk-exposure is found to be significantly negative for Turkish equities over the test period. The implication is that, after accounting for the interaction-effect between portfolio-beta and realized excess market-return ( �����), currency risk is found to command a premium, for the Turkish stocks and portfolios of Turkish stocks represented in the analysis. Evidence is thus provided suggesting that the negative effect of the foreign-portfolio-investment aspect exceeds the positive effect of the international-trade aspect of currency-risk-exposure, regarding Turkish equities and unexpected currency depreciation over the test period.
17
References
Ang, A., Chen, J., and Xing, Y., 2006. Downside risk. The Review of Financial Studies, 19,pp.1191-1239. http://dx.doi.org/10.1093/rfs/hhj035
Board of Governors of the Federal Reserve System, n.d. Selected interest rates: Historical data. [online] Available at: <http://www.federalreserve.gov/releases/h15/data.htm> [Accessed 12 April 2014].
Bollen, B., 2010. The security market plane. Applied Financial Economics, 20, pp.1231-1240.
http://dx.doi.org/10.1080/09603101003781448
Central Bank of the Republic of Turkey, n.d. Statistical data: Exchange rates. [online] Available at: <http://www.tcmb.gov.tr/yeni/eng/> [Accessed 20 April 2014].
Euribor-rates.eu, n.d. Euribor interest rates by year and month. [online] Available at: <http://www.euribor-rates.eu/> [Accessed 15 April 2014].
Newey, W. and West, K., 1987. A simple positive semi-definite, heteroskedasticity and autocorrelation consistent covariance matrix. Econometrica, 55, pp.703-708.
http://dx.doi.org/10.2307/1913610
Pettengill, G.N., Sundaram, S., and Mathur, I., 1995. The conditional relation between beta and returns, Journal of Financial and Quantitative Analysis, 30, pp.101-116.
http://dx.doi.org/10.2307/2331255