a Desktop Virtual Environment with Signs of Disorder
Alexander Toet1,2*, Martin van Schaik3, Nicolet C. M. Theunissen3
1Perceptual and Cognitive Systems, TNO, Soesterberg, The Netherlands,2Department of Information and Computing Sciences, University of Utrecht, Utrecht, The Netherlands,3Training & Performance, TNO, Soesterberg, The Netherlands
Abstract
Background:Desktop virtual environments (VEs) are increasingly deployed to study the effects of environmental qualities and interventions on human behavior and safety related concerns in built environments. For these applications it is essential that users appraise the affective qualities of the VE similar to those of its real world counterpart. Previous studies have shown that factors like simulated lighting, sound and dynamic elements all contribute to the affective appraisal of a desktop VE. Since ambient odor is known to affect the affective appraisal of real environments, and has been shown to increase the sense of presence in immersive VEs, it may also be an effective tool to tune the affective appraisal of desktop VEs. This study investigated if exposure to ambient odor can modulate the affective appraisal of a desktop VE with signs of public disorder.
Method:Participants explored a desktop VE representing a suburban neighborhood with signs of public disorder (neglect, vandalism and crime), while being exposed to either room air or subliminal levels of unpleasant (tar) or pleasant (cut grass) ambient odor. Whenever they encountered signs of disorder they reported their safety related concerns and associated affective feelings.
Results:Signs of crime in the desktop VE were associated with negative affective feelings and concerns for personal safety and personal property. However, there was no significant difference between reported safety related concerns and affective connotations in the control (no-odor) and in each of the two ambient odor conditions.
Conclusion: Ambient odor did not affect safety related concerns and affective connotations associated with signs of disorder in the desktop VE. Thus, semantic congruency between ambient odor and a desktop VE may not be sufficient to influence its affective appraisal, and a more realistic simulation in which simulated objects appear to emit scents may be required to achieve this goal.
Citation:Toet A, van Schaik M, Theunissen NCM (2013) No Effect of Ambient Odor on the Affective Appraisal of a Desktop Virtual Environment with Signs of Disorder. PLoS ONE 8(11): e78721. doi:10.1371/journal.pone.0078721
Editor:Thomas Hummel, Technical University of Dresden Medical School, Germany
ReceivedJune 24, 2013;AcceptedSeptember 20, 2013;PublishedNovember 8, 2013
Copyright:ß2013 Toet et al. This is an open-access article distributed under the terms of the Creative Commons Attribution License, which permits unrestricted use, distribution, and reproduction in any medium, provided the original author and source are credited.
Funding:The authors have no support or funding to report.
Competing Interests:The authors have declared that no competing interests exist.
* E-mail: [email protected]
Introduction
Desktop VEs (virtual environments) are increasingly deployed to study future design plans and the possible effects of environmental qualities and interventions on human behavior and feelings of safety in built environments [1–4]. Their effectiveness for these applications depends critically on their ability to correctly address the user’s affective appraisal of the represented environment. It is essential that users appraise the affective qualities of the desktop VE similar to those of its real world counterpart. Previous studies have shown that factors like simulated lighting, sound and dynamic elements have a similar influence on the affective appraisal of desktop VEs and real environments [5,6]. Ambient scent is another important environmental characteristic that is currently lacking in most VEs. It has been shown that ambient odor can increase the sense of presence in immersive VEs [7–9]. Ambient scent is known to significantly affect our appraisal of real environments [10], and people have strong expectations about the way an
environment should smell [11]. Hence, semantically congruent ambient odors may also be an effective tool to tune the affective appraisal of less immersive desktop VEs (e.g., by evoking implicit associations).
Virtual Environments in Environmental Research
Traditional methods used in environmental psychology to assess the impact of the affective qualities of built environments on the appraisal of the environment and safety related concerns typically use surveys and interviews [14,15], sometimes in combination with site visits [16,17]. One of the typical questions is ‘‘How would you feel being out here alone at night?’’ Experiments in reality are often difficult to organize and perform, time consuming and costly, and may involve practical dangers and risks for the participants. Moreover, real environments are constantly changing and it is not possible to control all experimental variables (e.g., noise level, temperature, light intensity, social presence, wind, rain, etc.) and interfering factors. But most importantly, it is generally impractical, too costly or simply impossible to investigate the effects of different interventions and new environmental designs and layouts.
The limitations and safety issues associated with experiments on the affective appraisal of built environments in reality can to a large extent be avoided by the use of drawings, photographs and slides, and interactive panoramas that can help participants to mentally place themselves in the real situation [18]. Photographs and slides have for instance been used to assess the impact of urban [19–21] and natural [22] layout, darkness [21,23,24] and graffiti [25] on concerns for personal safety. Although the appraisal of photographs correlate with on-site evaluations [26], they are highly viewpoint dependent [27]. In addition, photo-graphs fail to capture the dynamics of a real environment and its context [25]. Desktop VEs do not have these drawbacks, and offer cost-effective, safe, controlled and flexible environments that allow to investigate human response to a wide range of environmental factors without the constraints, distractions and dangers of the real world (e.g., [28]). As a result, desktop VEs are increasingly deployed to study the effects of new designs and interventions in environmental qualities and measures like CPTED (‘‘Crime Prevention Through Environmental Design’’) on human behavior and concerns for personal safety in built environments [1,29–32]. A recent series of studies used desktop VEs to investigate the effects of environmental cues signaling risk of victimization on concerns for personal safety [2,3,33–36]. One of these studies addressed the ecological validity of a desktop VE for this type of research [3]. It was found that the effects of cues like graffiti, murals, and boarded-up broken windows on concerns for personal safety of local residents were similar in reality and in a virtual model of the area. Other studies that compared human response to environmental interventions in both desktop simulations and their real world counterparts found that simulated lighting levels [5,37], and path choices [38] evoke similar responses as their real-world equiva-lents. Thus, it appears that the physical and affective qualities of desktop VEs influence human response in many respects in a similar way as their real-world equivalents.
Although VEs can relatively easy be implemented on immersive platforms like a CAVE [39], head mounted displays (HMD’s) and projection domes, most visualizations for urban planning and design are still displayed on desktop systems [40]. Desktop displays are relatively cheap, widely available and easy to use, while most users are familiar with these displays and their interaction devices. Desktop VEs are also preferred for communication of design plans because they can be made accessible to a large numbers of users in internet applications [41]. Although desktop VEs generally less effectively induce a sense of presence than more immersive displays [42] and seldom achieve full ecological validity [5], this need not be a significant limitation for the study of the effects of physical or social interventions in a built environment on human behavior and safety related concerns. For most purposes it suffices if the affective appraisal of the VE (or the mental imagery it
evokes: [43]) is similar to that of its real-world equivalent [13,44]. In this context the term ‘affective appraisal’ refers to the assessment of the environmental qualities that have the capacity to alter an individuals’ affective state (theaffective qualitiesof the environment). Thus, affective appraisals are attributed affective qualities about possible emotional reactions evoked by the environment [18,45], that are not necessarily accompanied by an actual affective responses [13,46]. Since fear is based on affective appraisals (a situation must be appraised as threatening or dangerous before it will lead to fearful reactions; it is logically impossible to be afraid but not judge a situation as threatening: [47]) a VE that is affectively appraised similar to its real world equivalent may be a valid predictor of human emotions (e.g. feelings of fear).
Previous studies comparing the influence of signs of public disorder on the affective appraisal of the environment found similar effects for desktop VEs and their real-world counterparts [4,12,13]: both in VE and in reality, signs of disorder typically compromise feelings of safety (see also [35]). However, for desktop VEs, the effects were significantly less than expected when the participants merely regarded these details as interesting distrac-tions [12,13], while they were much stronger than expected when the participants over-focused on these details [4]. These effects seriously degrade the ecological validity of desktop VEs for the study of effects of environmental qualities and interventions on human behavior and safety related concerns. Possible reasons for these effects may be that in the real world the impact of signs of public disorder is typically modulated by various environmental factors and social presence [48]. For instance, their negative appraisal can be ameliorated by auditory (music), tactile (wind), and olfactory (pleasant ambient smells of fresh air and vegetation) cues, or enhanced by noise and unpleasant (e.g., garbage and urine) smells. Hence, further knowledge of and control over these sensory factors is required to enable the design and construction of desktop VEs that can effectively be tuned to elicit an affective appraisal of the represented environment that agrees with the purpose of the simulation, and that is similar to the appraisal the user would have of the corresponding situation in reality. Previous studies investigated how simulated lighting [49–51], sound [52] and dynamic elements [6] may contribute to this goal. This study investigates if ambient odor influences a user’s affective appraisal of a desktop VE.
Olfaction, Affect and Attention
Odors can trigger a wide range of affective responses [53–55] and memories [56], and influence human judgments and behavior even when they are not consciously perceived [57–61]. This probably reflects the high degree of overlap between the brain structures involved in olfactory and emotional processing [62,63]. The nature of the response is inextricably linked to odor hedonic tone (pleasantness: [64]). Pleasant odors tend to induce positive affect, whereas unpleasant odors tend to induce negative affect [65–67].
the evaluation of objects that are generally judged less favorably [73,76].
Ambient odors (even at subthreshold levels) modulate visual attention [73,84,85]. Recent studies have shown that odors bias visual selective attention forsemantically congruentvisual objects [86– 88]. It appears that crossmodal odor-object associations are activated automatically without the need for explicit odor identification [86]. Ambient odors also bias visual attention to favor stimuli that areaffectively congruentto their hedonic quality (a case of affect-biased attention: [89]). Pleasant odors facilitate the processing of positive visual cues [90], while unpleasant odors facilitate the processing of negative cues [91] and inhibit the processing of positive cues [90]. The pre-attentive affective bias induced by ambient unpleasant odors probably serves the ecological purpose of facilitating threat detection [92].
Olfaction and Virtual Environments
Despite the major role of scent in everyday life and its effects on our environmental appraisal, olfaction is rarely applied in the scope of VEs [93]. Early problems associated with dispersing and controlling the odorants in the environment have been resolved by recent technological developments [94–98]; for a review see [99] and for a current overview of available display systems see [100]. With the technological barriers to effective presentation of olfactory information overcome, VE researchers and developers now have the ability to utilize scent to create more authentic environments and scenarios [88]. Enhancing virtual environments with olfactory stimuli may create a more complex and richer user experience by heightening the sense of reality [101,102]. It has indeed been shown that the addition of olfactory cues to an immersive VE can increase the user’s sense of presence, memory and perceived realism of the simulated environment [7–9]. Recent applications of olfactory enhanced VEs include high-end games and entertainment [103,104] and clinical scenarios for (drug, alcohol, nicotine) cue reactivity assessment [105,106] and PTSD treatment [107]. However, it is still unknown if ambient scents can influence the affective appraisal of a desktop VE [101].
Current Study
Public disorder reflects erosion of social control and inspires fear of crime [48,108–114]. Public disorder encompasses both physical and social disorder. Physical disorder includes items like dilapi-dated housing, vandalism, litter and vacant lots, while social disorder includes phenomena like loitering youths, rowdy behav-ior, public drunkenness, drug sales and prostitution. Following Park et al. [36] we conceptualize Fear of Crime in this study as a cue-focussed affective appraisal of victimization risk rather than an actual feeling of fear(see also [48,114]). Hence, Fear of Crime is conceptualized here as the capability of a given situation to evoke safety related concerns, measured through the affective appraisal of cues in the environment that signify a potential threat [15].
The current study was performed to test if exposure to (pleasant or unpleasant) ambient odor can modulate the affective appraisal of a VE showing signs of disorder. Participants performed a walking tour through a VE while being exposed to either room air (control group), unpleasant (tar) or pleasant (cut grass) odor. Whenever they noticed signs of disorder during their walk they reported their momentary safety related concerns and their associated affective feelings. The pleasant scent (cut grass) had congruent visual and auditory representations in the simulation, since the VE showed abundant greenery and contained the occasional sound of grass mowers in the associated soundtrack. The unpleasant scent (tar) had no obvious (visual or auditory) counterparts in the simulation, but could be associated with
derelict areas in general and with the occasional sounds of construction activities (hammering, sawing) in the soundtrack of the VE in particular. Since people tend to respond to an environment as a whole (a ‘molar’ environment) rather than to its individual features [13,115–117], and since affective qualities are prioritized in this categorization process [117], the presence of an ambient scent with an affective (pleasant or unpleasant) loading was expected to bias the affective appraisal of the VE. More specifically, it was hypothesized that participants in the unpleasant odor condition (H1) would report more concern for crime than participants in the control condition, because unpleasant odors bias visual attention to - affectively congruent - negative cues, and (H2) they would associate more negative affect with these signs because they would –unconsciously - associate the unpleasant odor with the affective quality of the VE. In contrast, it was expected that participants in the pleasant odor condition (H3) would report less concern for crime than participants in the control condition, because the smell of cut grass would bias their attention to the – semantically congruent - greenery and thereby distract them from the signs of disorder, and (H4) they would associate less negative affect with these signs (since pleasant scents tend to improve the evaluation of objects that are otherwise judged less favorably and to improve mood).
Methods
Virtual Environment
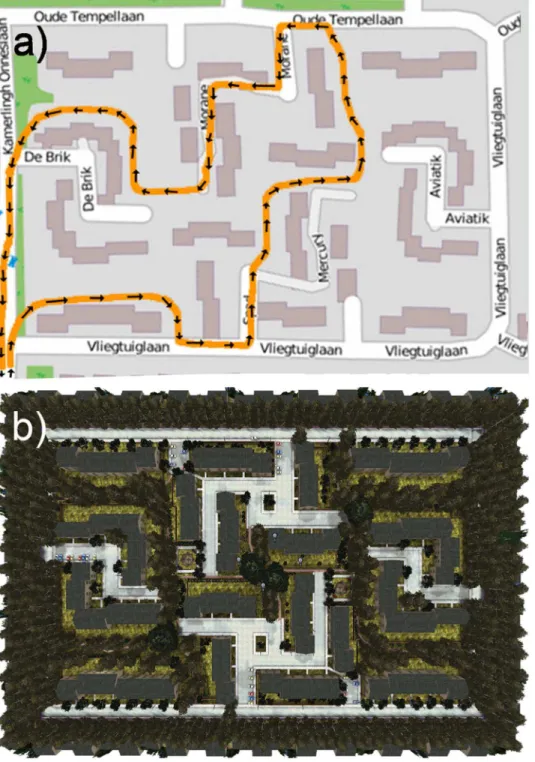
A small area in the town of Soesterberg, The Netherlands (with a rectangular shape and a total extent of about 2006200 m2; coordinates 52u79N, 5u179340E:) was simulated in 3D using the Unreal Tournament 2004 game-engine v2.5 (Epic Games Inc.; see Figure 1 for the corresponding OpenStreetMap and Unreal aerial overviews). The area is enclosed by roads on four sides and contains blocks of houses, two squares with parking places, benches, and statues, two playgrounds with benches, and a network of pathways connecting the squares and playgrounds (for details see Figures 2–4). All houses have a garden in the back, typically enclosed with a wooden fence, with an exit door to a pathway. The pathways are typically covered with tarmac, and bordered on both sides with trees and shrubs. The houses are generally well maintained and quite uniform. The pathways and parks are reasonably well kept. The walking route (designated by arrows drawn on the ground) had no intersections and covered most of the area (Figure 1a). The route included three short segments of sidewalks along three different roads, several footpaths, two squares, and two playgrounds.
then either photographed (e.g., litter, warning signs) or modeled as 3D virtual objects (e.g., CCTV cameras, dog droppings) and placed in the virtual environment using the Unreal game editor.
The simulation was performed on Dell Precision 490 PC computers, equipped with Dell 190monitors. Logitech Rumblepad 2 Gamepads were used for navigation. User movement in the virtual environment was from a first-person viewing perspective with walking motion supporting forward and backwards move-ments and left and right rotation movemove-ments. User movement speed was fixed and collision detection enabled to prevent users
from walking through objects. A non-repeating soundscape that was characteristic for the environment was composed from sounds (birds singing, cars passing by, children shouting, hammering and drilling, and dogs barking) recorded at several locations and at different times in the corresponding real environment. The soundscape was presented through Sennheiser eH 150 head-phones. A previous study showed that this soundscape effectively increased the ecological validity of the VE while the absence of sound negatively biased the appraisal of the VE [4].
Figure 1. Map of the modeled area of the town of Soesterberg (www.openstreetmap.org).(a) Walking route (orange line) and walking direction (small black arrows). (b) Corresponding top-view of the virtual environment.
Odor Selection
The scent of freshly cut grass was selected as the environmen-tally appropriate pleasant odor in this study. This scent is generally considered to be stimulating and refreshing. Since the VE used in this study shows a lot of vegetation, the scent of grass may evoke associations with well-kept property, and may also attract attention towards the greenery [86–88]. Hence, apart from its own stimulating effects, the scent of freshly cut grass may also indirectly improve mood and appraisal by focusing attention on the natural elements in the VE [121,122]. In addition, a previous study found that the scent of freshly cut grass enhances the perceived quality of real-time animation of grass [123]. The smell of cut-grass was created by mixing ethanol with cis-3-hexenol (leaf alcohol) in a 9:1 ratio. The associations that could be elicited by this scent were investigated by presenting it to a panel of 10 participants while they were viewing the VE. The scent was presented in small glass tubes containing a cotton swab with three to four drops of the solution and sniffed by the participants approximately 5 inches from their nose. Nine out of 10 participants reported associations
with greenery (four mentioned grass, three named freshly cut leaves and one mentioned broken twigs).
An environmentally appropriate unpleasant scent was selected in a pilot test from a set of 8 candidate aversive smells. The candidate smells were respectively Burned Wood (RS/420), Reptile (RS/424), Diesel Fumes (RS/423), Metal (RS/426), Dusty (RS/425), Tar (RS/401), Cow Manure, and Natural Gas (all obtained from RetroScent, Rotterdam, The Netherlands: www. geurmachine.nl). The scents were identified by randomly assigned numbers, presented in small glass tubes containing a cotton swab with three to four drops of aroma oil, and sniffed by the 10 participants of the pilot test in random order, approximately 5 inches from their nose, while viewing the VE. The degree to which each scent fitted the VE (how environmentally appropriate the scent was for the VE) was evaluated on a 11 point semantic differential scale (ranging from 0 =absolutely not to 10 =definitely). Tar received the highest mean score (7.4), followed by Dusty (5.7). In addition, although the exact the nature of the tar smell was not identified by any of the testers, 8 out of 10 spontaneously reported
Figure 2. Characteristic scenes from virtual environment.(a,b) Pathways between fences enclosing the back gardens of the houses in the neighborhood. Notice the arrows marked on the ground to indicate the walking route. (c) Entrance to a small square with parking. (d) A square with benches and artwork, surrounded by houses. (e) A playground.
associations with fire and burned material, while it was unanimously judged to be a very unpleasant scent that could occur in an environment as the one represented by the VE.
Odor Diffusion
Scents were diffused in the room (about 25 m2) through a commercial electronic dispenser (1–3 RS-Classic Scentvertiser, RetroScent, Rotterdam, The Netherlands: www.geurmachine.nl). No odor was applied in the control condition. The dispenser was placed out of the participant’s sight behind a screen. The participants could not hear the sound of the dispenser when they wore their headphones and listened to the soundscape of the VE. The experimenter turned on the dispenser after the participants had started their tour through the VE and he turned it off before they were instructed to take off their headphones. Odor was intermittently diffused (with a cycle period of 1 minute) during the experiment so that the participants received fluctuating concen-trations over time, thus preventing full adaptation. The perceived odor intensity should neither be overwhelming (to avoid eliciting inappropriate expectations in the participants: [124]) nor too low (so that the odor stimulation would be ineffective). Ideally, it
should be sufficiently strong to be just noticeable when attended to. Previous studies found that the influence of odors on visual stimuli is largest when the odors are presented at near detectable levels [61,68,125]. The odor intensity used in this study was between low and intermediate, corresponding to a mean level between 3 and 5 on a 10-point scale. A pilot experiment was performed to determine a setting of the dispenser and a duty cycle that resulted in a mean rating of 5. The room in which the test was performed was well ventilated prior to each session. Only one scent per day was diffused to avoid mixing odors, and the lab was fully ventilated overnight to remove any lingering trace of the scent. Before beginning the study each morning, the room was ‘sniff-tested’ by the two experimenters; no odors were detected to have remained in the room.
Instruments
General questionnaire. As the results may be influenced by
the characteristics of the participants, they were asked to complete aGeneral Questionnaireincluding socio-demographic measures (sex, age, and education). Education was clustered into four groups:
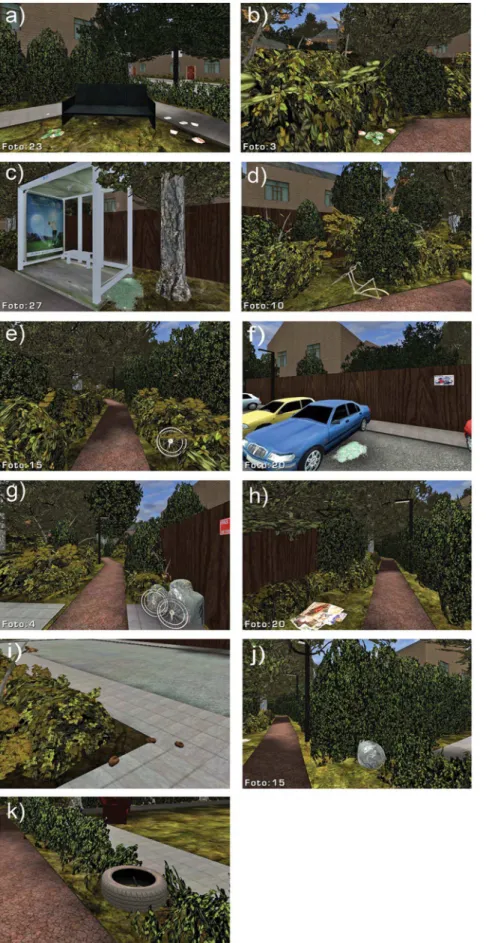
Figure 4. Physical incivilities in the virtual environment.Examples shown represent (a,b) empty beer cans, (c) broken glass, (d,e) bicycle parts, (f) broken car window glass, (g) garbage bags and bicycle parts, (h) paper litter, (i) dog droppings, (j) garbage bag, (k) car tire.
middle and higher level education, academic education, and other types of education.
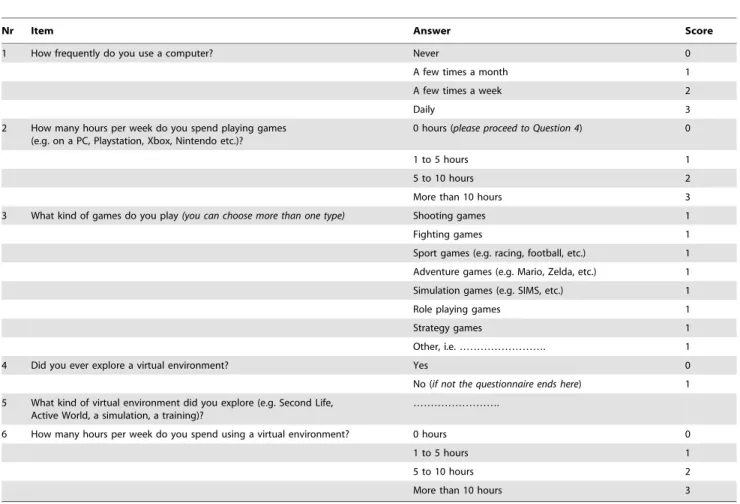
Game and computer experience questionnaire. A 6-item
Game and Computer Experience Questionnaire(Table 2; see also [50]) was designed to assess the participants’ general experience with computers, games and virtual environments. Three items (nrs. 1,2 and 6) are related to the total amount of time spent on playing computer games (each was scored on a scale from 0 = no time spent to 3 = a large amount of time spent), two items (nrs. 4 and 5) address the experience with navigating virtual environments (one item is scored as 0 = no experience and 1 = some experience, the other item merely serves to check what type of environment was navigated), and the kind of games played (item nr. 3). The total score on theGame and Computer Experience Questionnaireranges from 0 (no time spent on games and no experience with virtual environments) to 18 (a large amount of time spent on many different games and experience with virtual environments). Scores ranging from 0 to 5 correspond to low experience, scores from 6 to 12 indicate average experience, while scores from 13 to 18 correspond to extensive experience.
Fear of crime questionnaire. A 7-item Fear of Crime
Questionnaire(see Table 3) was applied to measure the participants’ affective appraisal of a given situation, i.e., their interpretation of cues in the environment that signal potential threats and that may evoke a chain of thoughts about unpleasant events (equivalent to Jackson’s Worry about Crime concept: [15]; see also [22]). This questionnaire contained six statements with connotative meanings related to concern for personal safety. Five items (nrs. 1–5) were adapted from a validatedPerceived Dangerquestionnaire [126]. One statement (item 6) was added as a check (for item 2), and one statement (item 7, from [118]) was added to measure concern for personal property. The items were scored on a 5-point Likert scale (ranging from 1 =completely disagreeto 5 =completely agree).
Mental state questionnaire. A 7-itemMental State
Question-naire (adapted from [127]), consisting of four negative (agitated, angry, anxious, distressed), two neutral (calm, relaxed), and one positive
(cheerful) affective terms served to assess the affective connotations elicited by the individual incivilities. For each individual sign of disorder which they encountered during their walk participants reported their affective connotation by selecting one of the 7 items (‘‘I feel/would feel … at this place.’’).
Post-experiment questionnaire. A 4-item Post-Experiment
Questionnairecontained three questions investigating the extent to which the ambient temperature, illumination and atmosphere in the room were characteristic for the VE (these three items were scored on a 5-point Likert scale, ranging from 1 =completely disagree
to 5 =completely agree) and an open question (‘‘Was there anything else you noticed during the experiment?’’) to test if the participants had noticed the ambient scent in the room.
Experimental Procedure
After their arrival at the laboratory, the participants first read and signed an informed consent form. Next, they filled out both theGeneral Questionnaireand Game Experience Questionnaire. Then they read the following instructions:
‘‘The experiment concerns an area of Soesterberg near the TNO lab, and will take about 45 minutes. Citizens living in this area are concerned about the increasing social disorder in their neighborhood. They intend to draft a plan of action to confront this problem. After making an inventory of the different types of incivilities occurring in their neighborhood, the citizens will prioritize the order in which these should be addressed. To enable a large number of people to give their opinion on the social disorder in this area, the concerned citizens have commissioned a realistic and highly detailed computer model of their neighborhood. It is your task to make a tour through this virtual model and assess the social disorder in this neighborhood. Your route is marked by arrows drawn on the ground. Each time you notice signs of incivilities (e.g., litter, dog droppings, broken car windows, etc.) during your inspection tour, you are requested to:
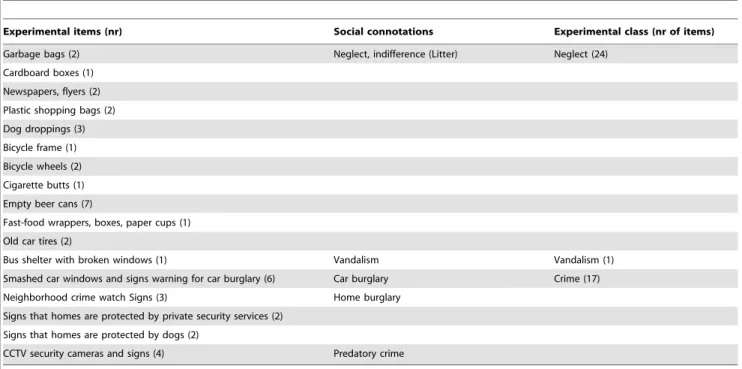
Table 1.Experimental items, their connotations of physical and social disorder, and the experimental classification.
Experimental items (nr) Social connotations Experimental class (nr of items)
Garbage bags (2) Neglect, indifference (Litter) Neglect (24)
Cardboard boxes (1)
Newspapers, flyers (2)
Plastic shopping bags (2)
Dog droppings (3)
Bicycle frame (1)
Bicycle wheels (2)
Cigarette butts (1)
Empty beer cans (7)
Fast-food wrappers, boxes, paper cups (1)
Old car tires (2)
Bus shelter with broken windows (1) Vandalism Vandalism (1)
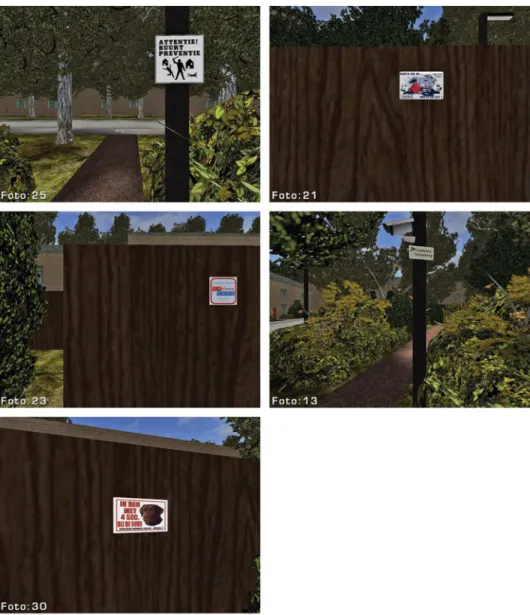
Smashed car windows and signs warning for car burglary (6) Car burglary Crime (17)
Neighborhood crime watch Signs (3) Home burglary
Signs that homes are protected by private security services (2)
Signs that homes are protected by dogs (2)
CCTV security cameras and signs (4) Predatory crime
1. Make a snapshot of each sign of incivilities you notice (by pressing key F12).
2. Enter a brief description of the incivility on your questionnaire. 3. Rate any concerns for your personal safety which you associate with the perceived incivility using the ‘Fear of Crime Questionnaire’.
4. Describe any affective feelings you associate with the perceived incivility by choosing one of the 7 affective terms on the ‘Mental State
Questionnaire’ (agitated, angry, anxious, distressed, calm, relaxed, cheerful)’’.
Next, the experimenter verified if the participants had understood their instructions, and started the simulation. The experimenter then explained the function of the gamepad, and gave the participant the opportunity to practice maneuvering through the virtual environment for about 5 minutes. At the end of this practice period the experimenter checked if the participant Table 2.Game and Computer Experience Questionnaire, together with the scores attributed to each item.
Nr Item Answer Score
1 How frequently do you use a computer? Never 0
A few times a month 1
A few times a week 2
Daily 3
2 How many hours per week do you spend playing games (e.g. on a PC, Playstation, Xbox, Nintendo etc.)?
0 hours (please proceed to Question 4) 0
1 to 5 hours 1
5 to 10 hours 2
More than 10 hours 3
3 What kind of games do you play(you can choose more than one type) Shooting games 1
Fighting games 1
Sport games (e.g. racing, football, etc.) 1
Adventure games (e.g. Mario, Zelda, etc.) 1
Simulation games (e.g. SIMS, etc.) 1
Role playing games 1
Strategy games 1
Other, i.e. ………. 1
4 Did you ever explore a virtual environment? Yes 0
No (if not the questionnaire ends here) 1
5 What kind of virtual environment did you explore (e.g. Second Life, Active World, a simulation, a training)?
……….
6 How many hours per week do you spend using a virtual environment? 0 hours 0
1 to 5 hours 1
5 to 10 hours 2
More than 10 hours 3
doi:10.1371/journal.pone.0078721.t002
Table 3.Factor loadings ofthe Fear of Crime Questionnaireitems.
Factors
Nr. Fear of Crime Items
Concern for Personal Safety
Concern for Personal Property
1 I would go a long way around to avoid this place. .85 .21
2 I feel/would feel uneasy at this place. .85 .45
3 I would make haste to get away from this place. .80 .37
4 I would not mind to walk alone here at night-time. .78 .29
5 I have/would have an unpleasant feeling in this place. .76 .45
6 I feel/would feel safe at this place. .69 .49
7 I would leave my bicycle at this place without concern. .29 .94
was able to perform the required maneuvers, and whether the participant paid attention to the arrows on the ground and the signs of disorder. Then, the experimenter gave the participants the printed questionnaires which they could use to fill out their reports, and positioned the point-of-view in the virtual environ-ment at the starting location, facing the direction of the route. The participants then put on their headphones and started their walkthrough, which they performed at their own pace. Each time the participants noticed signs of disorder during their walk they reported the item they had noticed and filled out theFear of Crime Questionnaireand theMental State Questionnaire. During the test, the experimenter was seated behind a screen in the room and intermittently turned on the odor dispenser at one minute intervals, maintaining a slightly fluctuating near threshold ambient odor level. Finally, after finishing their walkthrough, the partic-ipants filled out thePost-Experiment Questionnaire.
The experimental protocol was reviewed and approved by the TNO internal review board on experiments with human participants (TNO Toetsings Commissie Proefpersoon Experi-menten, Soesterberg, The Netherlands), and was in accordance with the Helsinki Declaration of 1975, as revised in 2000 [128]. The participants provided their written informed consent prior to testing. The participants received a modest financial compensation for their participation.
Pre-trial
Prior to the main experiment, a pilot test including 4 participants was performed to test the entire experimental procedure. It was confirmed that the instructions were clear, that
the participants could easily find their way through the environ-ment, that the signs of disorder were salient enough to be noticed, and that the setting of the electronic dispenser (near threshold, as subjectively determined by the experimenters) indeed resulted in a just noticeable level of ambient door.
Participants
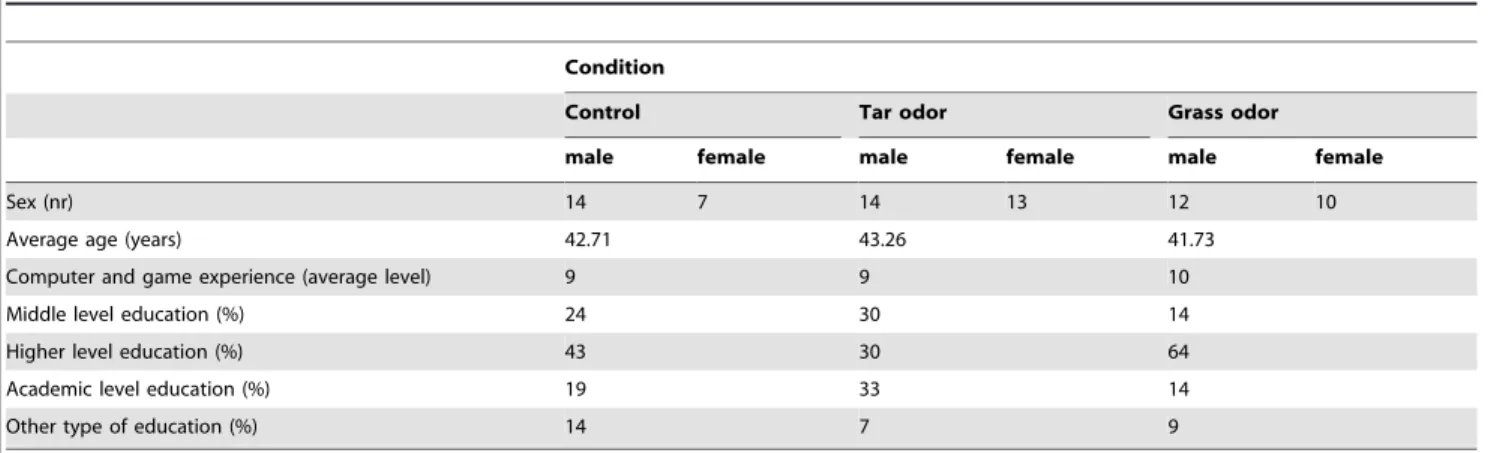
The main experiment was performed by 70 participants (40 males and 30 females) that were selected from the TNO database of volunteers, with an average age of 43 years (M = 43, SD = 17). The selection criteria guaranteed that they were not familiar with the urban area represented by the VE, that they had no problems with their sense of smell, and that they all had normal (or corrected to normal) vision with no color deficiencies. Also, they were unaware of the aim of the experiment. All participants were educated: 23% had received academic education, 44% had received higher education, 23% had received middle level vocational education, and 10% had received some other form of education. All participants had computer experience: 34% of the total population played computer games on regularly base, while the remaining 66% had at least some occasional experience with VE’s. The participants’ mean age, level of education, and computer proficiency and game experience were approximately the same for all three (no-ambient smell, ambient tar odor, and ambient grass odor) experimental conditions (see Table 4). Table 4.Distribution of participants over the experimental conditions.
Condition
Control Tar odor Grass odor
male female male female male female
Sex (nr) 14 7 14 13 12 10
Average age (years) 42.71 43.26 41.73
Computer and game experience (average level) 9 9 10
Middle level education (%) 24 30 14
Higher level education (%) 43 30 64
Academic level education (%) 19 33 14
Other type of education (%) 14 7 9
doi:10.1371/journal.pone.0078721.t004
Table 5.Mean (SD) of the factorConcern for Personal Safetyin the control, ambient tar and ambient grass odor conditions for each of the three classes of experimental items signaling respectively Neglect (24 items), Vandalism (1 item) and Crime (17 items: see Table 1).
Signals of
Condition Neglect Vandalism Crime
Control 2.90 (.64) 3.22 (.85) 3.02 (.82)
Tar odor 2.62 (.72) 2.67 (.84) 3.02 (.82)
Grass odor 2.64 (.68) 3.04 (1.20) 2.91 (.87)
doi:10.1371/journal.pone.0078721.t005
Table 6.Mean (SD) of the factorConcern for Personal Property
in the control, ambient tar and ambient grass odor conditions for each of the three classes of experimental items signaling respectively Neglect (24 items), Vandalism (1 item) and Crime (17 items: see Table 1).
Signals of
Condition Neglect Vandalism Crime
Control 3.66 (.91) 4.05 (1.08) 3.20 (.88)
Tar odor 3.42 (.68) 3.94 (.80) 3.38 (.81)
Grass odor 3.52 (.83) 3.99 (1.20) 3.43 (.80)
Data Analysis
The participant-variable ratio did not allow for a straightforward statistical analysis of the combination of 7 fear of crime scores for 42 items of social incivilities in 3 conditions. Therefore a data reduction strategy was applied. Factor analysis was used to cluster theFear of Crimestatements in the two scalesConcern for Personal SafetyandConcern for Personal Property. The internal consistency of the resulting scales was checked by computing Cronbach’s alphas. Next, scale scores were calculated based on the average of the statements’ scores within a scale, such that higher scores represented more fear of crime. The relation between the two scales was calculated using Pearson’s correlation. In addition, the 42 experimental items were clustered in three classes based on their connotations: Neglect, Vandalism and Crime (see Table 1). Analysis of variance was used to test the relationships between the main variables. The statistical analyses were performed with SPSS 20.0 for Windows (SPSS, Chicago, Ill., USA). For all analyses a probability level of p,0.05 was considered to be statistically significant.
Results
TheGeneral Questionnaireprovided information about the age, sex and education of the participants, while the Game and Computer Experience Questionnaire served to assess their experience with computers, games and VEs. Table 4 shows how the participants in this study were distributed over the experimental conditions with respect to these factors. The different experimental groups were similar in average age and game and computer experience, but differed slightly in sex and education. Since multivariate analysis showed no main or interaction effects of age, level of education, and computer experience on fear of crime, these factors were omitted from later analyses.
TheFear of Crime Questionnaireserved to measure whether signals of social disorder evoked safety related concerns. Table 3 shows the results of a factor analysis of the 7 statements from theFear of Crime Questionnaire. Six variables load onto a single factor, which accounts for 84% of the total variance and has a high internal consistency (Cronbach’s alpha = 0.93). The six items which load onto this factor are all related toConcern for Personal Safety(physical harm, violence). The remaining item (‘‘I would leave my bicycle at this place without concern.’’) is related toConcern for Personal Property(theft, vandalism) and accounts for 7% of the total variance.
Next, we calculated the average of the statements’ scores within both scales, such that higher scores represented more fear of crime (see Tables 5 and 6). Both factors are significantly correlated (r = .63, df = 1565, p,.00): Concern for Personal Property increases whenConcern for Personal Safetyincreases.
Then, the affective connotations reported for the detected signs of disorder (from the combination of theMental StateandFear of Crime Questionnaires) were clustered for each of the three classes of experimental items: Neglect, Vandalism and Crime (see Table 1). There is a significant difference (x2= 18.94; df = 4; p =,.05) between the observed and expected frequencies of the affective connotations (negative, neutral, or positive) associated with the reported items (signs of incivilities) in the classes Neglect, Vandalism and Crime. Items in the classes Vandalism and Crime were more frequently associated with negative affective connotations than items in the class Neglect. However, there is no difference inConcern for Personal Safety associated with reports on experimental items in different experimental classes. Also, items that could inspireConcern for Personal Property(e.g., signs of home and car burglary, abandoned bikes) did not elicit any crime related concerns.
The hypotheses H1 and H3 - that participants in the (un)pleasant odor condition would report more (less) concern for crime than
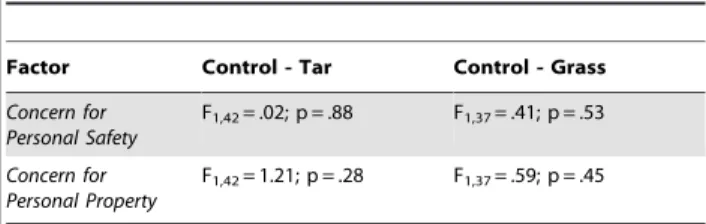
participants in the control condition - are both not proven by this study: analysis of variance showed no significant difference in the factors Concern for Personal Safety and Concern for Personal Property
between the control condition and each of the two odor conditions (Table 7), for each of the experimental classes. Also, the hypotheses H2 and H4 - that participants in the (un)pleasant odor condition would associate more (less) negative affect with these signs because they would (unconsciously) attribute the affective quality of the ambient odor to the VE – are both not supported by the present results: the affective connotations associated with the reported items do not differ between the control and each of the two experimental (ambient odor) conditions.
Overall, women were significantly more concerned about their own personal safety than men (F1,61= 14,93, p,.00).
In response to the open question in thePost-Experiment Questionnaire
only one participant (out of 23) claimed to have noticed a (Lysol) smell in the room in the control condition. In the tar odor condition one participant (out of 23) reported to have noticed a smell, but he was unable to identify its nature, and did not link the odor to the experiment. No participant noticed a smell in the grass odor condition. Five participants (out of 70) reported that they experienced the absence of people in the VE as frightening.
Discussion and Conclusions
There was no significant difference in the factors Concern for Personal Safetyand Concern for Personal Propertybetween the control condition and each of the two odor conditions. Also, the affective connotations associated with the reported items do not differ between the experimental conditions. The present results therefore appear to falsify the hypotheses that the hedonic quality (pleasant or unpleasant) of an environmentally congruent ambient odor would modulate the affective evaluation of the desktop VE (H1 and H3) and the affective connotations the participants attribute to signs of disorder therein (H2 and H4). However, they agree with earlier reports that ambient scent has no effect on shopping behavior [129,130]. In particular, Schifferstein and Blok [130] found that the scent of freshly cut grass did not affect sales of thematically (in-) congruent products. These authors argue that ambient scent is probably more diagnostic for the physical environment of the observer than for the particular items in that environment. This suggests that a close spatiotemporal link between the visual cues in a desktop VE and the scents with which they are supposed to be associated may be required to effectively establish these associations. Hence, it would be interesting to investigate more immersive VEs that can convinc-ingly induce the illusion that scents emanate from the objects that are displayed in the scene.
Experimental items signaling vandalism (e.g., a damaged bus shelter) and crime (e.g., home protections signs and cameras) more
Table 7.Results of a two-way ANOVA to test the difference between the factorsConcern for Personal SafetyandConcern for Personal Propertyin respectively the control and the two ambient odor conditions.
Factor Control - Tar Control - Grass
Concern for Personal Safety
F1,42= .02; p = .88 F1,37= .41; p = .53
Concern for Personal Property
F1,42= 1.21; p = .28 F1,37= .59; p = .45
frequently evoked negative affective appraisals than items repre-senting neglect (e.g., litter, dog droppings, old bicycle parts). This finding agrees with the discriminant validity of different types of perceptual incivilities that is also found in the real world (e.g., between crime and social incivilities: [131,132]). In reality, signs of crime are also more likely to evoke negative appraisals since they are typically associated with the risk of personal victimization [133].
In response to the open question in thePost-Experiment Questionnaire
six participants stated that they had experienced the absence of people (avatars) in the simulation as discomforting. This agrees with previous real world observations that lack of social presence evokes fear of victimization and determines navigation behavior, especially in women [134,135].The current finding that women were significantly more concerned about their own personal safety than men also agrees with real world observations [134,135].
The fact that only one participant noticed a smell in an odor condition (but failed to identify it or link it to the experiment) suggests that the ambient odors were indeed successfully presented at a just noticeable intensity level.
Summarizing, although semantically congruent ambient scents of different hedonic quality failed to influence the affective appraisal of the desktop VE, the finding that signs of crime were more frequently associated with negative feelings and the fact that women were more concerned about their personal safety than men suggest that the affective appraisal of the VE had at least some ecological validity.
Limitations of this Study
The results show that visual cues in the VE signaling vandalism and crime indeed evoked negative affective appraisals, just like they do in reality [48,114]. However, except for broken car glass, the experimental items used in this study represent minor offenses and have no obvious connotations of violence or predatory crimes that may inspire concern of personal victimization. Indicators of serious (prostitution, drug selling, harassment) or even less serious (public drunkenness) social disorder may elicit crime related concerns more effectively, but these are typically not present in daylight hours [136] and are not easily implemented in experimental conditions.
The (physical and demographic) characteristics of lower socio-economic neighborhoods can mute the effects of disorder (e.g. [112,137,138]). A VE representing a higher socio-economic neighborhood was therefore selected, in the expectation that this type of environment would be more susceptible to the effects of disorder, resulting in larger differences between fear of crime levels in respectively the pleasant and unpleasant odor conditions ([118]). However, the aesthetic appeal of the simulated neighborhood used in this study may also have muted the effects of the signs of disorder.
As noted before, the desktop VE and task used in this study were not designed to induce a strong sense of immersion or presence. As a result, the participants may have unconsciously associated the ambient scent with their physical environment and not so much with the VE they explored. Schifferstein and Blok [130] also argued that ambient scent is probably more diagnostic for the physical environment of an observer than for the particular items in that environment.
Suggestions for Future Research
The present study investigated the effects of ambient scent on the affective appraisal of a desktop VE with static contents. In future experiments the realism of the simulation can be enhanced by adding dynamic visual, auditory, olfactory and haptic features that
interact with the user. Dynamic audio cues could include voices that shout or dogs that bark when participants walk by. Dynamic visual cues could be passing traffic (cars, motorbikes), virtual humans that drop litter, create graffiti, shout insults or make obscene gestures when approached, or dogs that growl at people passing by. In everyday life ambient smells are important and essential environ-mental cues that trigger a wide range of different emotions and associations. Dynamic olfactory cues could include location dependent smells like urine, sewage or garbage smells in alleys, or gasoline smells near cars [93]. Finally, dynamic haptic cues could include sudden gusts of air when moving around a corner or constant breezes when walking through open spaces [139]. Each of these modifications may serve to make the VE more effectively elicit cognitive and affective responses similar to those that users would have to corresponding real environments [140,141].
Participants in this study were not familiar with the urban area represented by the VE. Since it is known that scenes more effectively elicit affective feelings when they have personal relevance [142], it would be interesting to test whether ambient odors can affect the appraisal of scenes with high personal relevance. Personal relevance can for instance be achieved through background stories suggesting that the VE experience will have personal implications (e.g., a suggested follow-up task like a nighttime visit to the VE’s real world counterpart).
The present study tested only two different scents. A wider range of scents with various hedonic qualities should be investigated to assess whether olfactory cues can bias the affective appraisal of a desktop VE. In combination with gaze tracking, the use of multiple scents that are semantically related to the contents of a VE may help to assess whether olfactory cues can bias visual attention.
In simulation studies social incivilities inspire safety related concerns far more effectively than physical incivilities [3], just like in reality [113]. In the current simulation social presence was merely implied through the occasional sound of voices, traffic, birds, music and hammering in the ambient sound track. There was no visual evidence of human or animal activity. The soundtrack played independently of the actions of the user and had no visual counterpart. It is known that ambient odor can significantly affect the way people interact in real life: people display more social behavior [57,60,143,144] and find each other more attractive [145] in the presence of pleasant ambient odors, whereas they become more frustrated [70] and find each other less attractive [146,147] in the presence of malodorants. Future studies should investigate whether these real-life effects of ambient odors also transfer to the interaction between users and avatars in a VE.
Data Availability
The experimental data and additional information on this study are deposited in the Dryad Repository: http://dx.doi.org/10. 5061/dryad.f37km.
Acknowledgments
The authors greatly appreciate the helpful comments and suggestions of the anonymous reviewers. They also gratefully acknowledge the help of Yu Mei O with the data entry efforts.
Author Contributions
References
1. Cozens P, Neal R, Whitaker J, Hillier D (2003) Investigating personal safety at railway stations using ‘‘virtual reality’’ technology. Facilties 21: 188–194. 2. Park AJ, Calvert T, Brantingham PL, Brantingham PJ (2008) The use of virtual
and mixed reality environments for urban behavioural studies. PsychNol J 6: 119–130.
3. Park AJ, Spicer V, Guterres M, Brantingham PL, Jenion G (2010) Testing perception of crime in a virtual environment. In: Proceedings of the 2010 IEEE International Conference on Intelligence and Security Informatics (ISI). Piscataway, NJ, USA: IEEE Press. 7–12.
4. Toet A, van Schaik MG (2012) Effects of signals of disorder on fear of crime in real and virtual environments. J Environ Psychol 32: 260–276.
5. Bishop ID, Rohrmann B (2003) Subjective responses to simulated and real environments: A comparison. Landscape and Urban Plan 65: 261–277. 6. Houtkamp JM, Schuurink EL, Toet A (2008) Thunderstorms in my computer:
the effect of visual dynamics and sound in a 3D environment. In: Bannatyne, M and Counsell, J. editors. Proceedings of the International Conference on Visualisation in Built and Rural Environments BuiltViz’08. Los Alamitos, USA: IEEE Computer Society. 11–17.
7. Dinh HQ, Walker N, Hodges LF, Song C, Kobayashi A (1999) Evaluating the importance of multi-sensory input on memory and the sense of presence in virtual environments. In: Proceedings of the Virtual Reality Annual International Symposium. Piscataway, NJ, USA: IEEE Press. 222–228. 8. Washburn DA, Jones LM, Satya RV, Bowers CA, Cortes A (2003) Olfactory
use in virtual environment training. M & S Mag 2: 19–25.
9. Tortell R, Luigi DP, Dozois A, Bouchard S, Morie JF, et al. (2007) The effects of scent and game play experience on memory of a virtual environment. Virtual Reality 11: 61–68.
10. Wrzesniewski A, McCauley C, Rozin P (1999) Odor and affect: individual differences in the impact of odor on liking for places, things and people. Chem Sens 24: 713–721.
11. Henshaw V, Bruce N (2012) Smell and sound expectation and the ambiances of English cities. In: Proceedings of the 2nd International Congress on Ambiances. Montreal, Canada. 449–454.
12. Houtkamp JM, van Oostendorp H (2007) Virtual vandalism. The effect of physical incivilities on the affective appraisal of 3D urban models. In: Proceedings of the 11th International Conference Information Visualization (IV’07). 559–566.
13. Houtkamp JM (2012) Affective appraisal of virtual environments [dissertation]. Utrecht, The Netherlands: University Utrecht.
14. Miller J (2008) Impact of situational factors on survey measured fear of crime. International Journal of Social Research Methodology 11: 307–325. 15. Jackson J (2005) Validating new measures of the fear of crime. International
Journal of Social Research Methodology 8: 297–315.
16. Nasar JL, Jones KM (1997) Landscapes of fear and stress. Environ Behav 29: 291–323.
17. Fisher BS, Nasar JL (1992) Fear of crime in relation to three exterior site features: Prospect, refuge, and escape. Environ Behav 24: 35–65.
18. Nasar JL (2008) Assessing perceptions of environments for active living. Am J Prev Med 34: 357–363.
19. Stamps AE, Smith S (2002) Environmental enclosure in urban settings. Environ Behav 34: 781–794.
20. Wang K, Taylor RB (2006) Simulated walks through dangerous alleys: Impacts of features and progress on fear. J Environ Psychol 26: 269–283.
21. Herzog TR, Flynn-Smith JA (2001) Preference and perceived danger as a function of the perceived curvature, length, and width of urban alleys. Environ Behav 33: 653–666.
22. Andrews M, Gatersleben B (2010) Variations in perceptions of danger, fear and preference in a simulated natural environment. J Environ Psychol 30: 473–481. 23. Hanyu K (1997) Visual properties and affective appraisals in residential areas
after dark. J Environ Psychol 17: 301–315.
24. Hanyu K (2000) Visual properties and affective appraisals in residential areas in daylight. J Environ Psychol 20: 273–284.
25. Austin DM, Sanders C (2007) Graffiti and perceptions of safety: A pilot study using photographs and survey data. J Crim Just Pop Cult 14: 292–316. 26. Stamps AE (2010) Use of static and dynamic media to simulate environments: a
meta-analysis. Percept Motor Skills 111: 355–364.
27. Palmer JF, Hoffman RE (2001) Rating reliability and representation validity in scenic landscape assessments. Landscape and Urban Plan 54: 149–161. 28. Nasar JL, Cubukcu E (2011) Evaluative appraisals of environmental mystery
and surprise. Environ Behav 43: 387–414.
29. Kavakli M, Kavakli K, Gao Y (2004) Crime prevention through environmental design in virtual reality. In: Proceedings of the 9th Annual International CPTED Conference. Brisbane, Australia: International Security Management & Crime Prevention Institute. 1–11.
30. Cozens P, Waters J, Neale R (2002) A virtual reality approach to personal safety and the design of built environment facilties. In: Proceedings of the 18th ARCOM Annual Conference (Association of Researchers in Construction Management). 461–473.
31. Cozens P, Neale R, Hillier D (2003) Managing crime and the fear of crime at railway stations – A case study in South Wales (UK). International Journal of Transport Management 1: 121–132.
32. Cozens P, Neal R, Hillier D, Whitaker J (2004) Tackling crime and fear of crime while waiting at Britain’s railway stations. J Public Transp 7: 23–42. 33. Park AJ, Calvert TW (2008) A social agent pedestrian model. Comp Anim
Virtual Worlds 19: 331–340.
34. Park AJ (2008) Modeling the role of fear of crime in pedestrian navigation [dissertation]. Burnaby, BC, Canada: School of Interactive Arts and Technology, Simon Fraser University.
35. Park AJ, Hwang E, Spicer V, Cheng C, Brantingham PL, et al. (2011) Testing elderly people’s fear of crime using a virtual environment. In: Proceedings of the 2011 European Conference on Intelligence and Security Informatics (EISIC)IEEE. 63–69.
36. Park AJ, Clare J, Spicer V, Brantingham PL, Calvert T, et al. (2012) Examining context-specific perceptions of risk: exploring the utility of ‘‘human-in-the-loop’’ simulation models for criminology. Journal of Experimental Criminology 8: 29–47.
37. Rohrmann B, Bishop ID (2002) Subjective responses to computer simulations of urban environments. J Environ Psychol 22: 319–331.
38. Zacharias J (2006) Exploratory spatial behaviour in real and virtual environments. Landscape and Urban Plan 78: 1–13.
39. Cruz-Neira C, Sandin DJ, DeFanti TA, Kenyon RV, Hart JC (1992) The CAVE: audio visual experience automatic virtual environment. Communica-tions of the ACM 35: 64–72.
40. Lewis JL, Casello JM, Groulx M (2012) Effective environmental visualization for urban planning and design: Interdisciplinary reflections on a rapidly evolving technology. Journal of Urban Technology 19: 85–106.
41. Dang A, Liang W, Chi W (2012) Review of VR application in digital urban planning and managing. In: Shen, Z. editors. Geospatial Techniques in Urban Planning. Berlin Heidelberg: Springer. 131–154.
42. Youngblut C (2007) What a decade of experiments reveals about factors that influence the sense of presence: Latest findings. IDA Document D-3411. 43. Rodrı`guez-Ardura I, Martı´nez-Lo´pez FJ (2013) Another look at ‘being there’
experiences in digital media: Exploring connections of telepresence with mental imagery. Computers in Human Behavior.
44. van Hagen, M. (2011) Waiting experience at train stations. Delft, The Netherlands: Eburon.
45. Franz G, Von der Heyde M, Bulthoff HH (2005) An empirical approach to the experience of architectural space in virtual reality: Exploring relations between features and affective appraisals of rectangular indoor spaces. Automation in Construction 14: 165–172.
46. Russell JA, Snodgrass J (1987) Emotion and the environment. In: Stokols, D and Altman, I. editors. Handbook of environmental psychology. New York, USA: John Wiley & Sons. 245–280.
47. Gabriel U, Greve W (2003) The psychology of fear of crime. Conceptual and methodological perspectives. British Journal of Criminology 43: 600–614. 48. Lorenc T, Clayton S, Neary D, Whitehead M, Petticrew M, et al. (2012)
Crime, fear of crime, environment, and mental health and wellbeing: Mapping review of theories and causal pathways. Health Place 18: 757–765. 49. Houtkamp JM, van der Spek ED, Toet A (2007) The influence of lighting on
the affective qualities of a virtual theater. In: Kieferle, J and Ehlers, K. editors. Predicting the Future. Proceedings of the Conference on Education and Research in Computer Aided Architectural Design in Europe (eCAADe 2007). Frankfurt, Germany: eCAADe (Education in Computer Aided Architectural Design in Europe) and FH Wiesbaden/FH Frankfurt. 77–84.
50. Toet A, van Welie M, Houtkamp JM (2009) Is a dark virtual environment scary? CyberPsychol Beh 12: 363–371.
51. Houtkamp JM, Toet A (2012) Who’s afraid of virtual darkness: Affective appraisal of night-time virtual environments. In: Digital Landscape Architec-ture 2011/2012: GeoDesign and Teaching. Offenbach, Wichmann Verlag. 508–515.
52. Houtkamp JM, Toet A, Bos FA (2012) Task-relevant sound and user experience in computer-mediated firefighter training. Simulation & Gaming 43: 778–802.
53. Herz RS (2002) Influences of odor on mood and affective cognition. In: Rouby, C, Schaal, B, Dubois, D, Gervais, R, and Holley, A. editors. Olfaction, taste, and cognition. Cambridge, UK: Cambridge University Press. 160–177. 54. Chrea C, Grandjean D, Delplanque S, Cayeux I, Le Calve´ B, et al. (2009)
Mapping the semantic space for the subjective experience of emotional responses to odors. Chem Sens 34: 49–62.
55. Vernet-Maury E, Alaoui-Ismaı¨li O, Dittmar A, Delhomme G, Chanel J (1999) Basic emotions induced by odorants: a new approach based on autonomic pattern results. J Auton Nerv Syst 75: 176–183.
56. Toffolo MBJ, Smeets MAM, van den Hout MA (2012) Proust revisited: odours as triggers of aversive memories. Cognition Emotion 26: 83–92.
57. Liljenquist K, Zhong C-B, Galinsky AD (2010) The smell of virtue: clean scents promote reciprocity and charity. Psychol Sci 21: 381–383.
58. Baron RA (1990) Environmentally induced positive affect: Its impact on self-efficacy, task performance, negotiation, and conflict. J Appl Soc Psychol 20: 368–384.
60. James AL (2006) The effects of odor on compliance and willingness to volunteer. J Undergrad Psychol Res 1: 13–17.
61. Li W, Moallem I, Paller KA, Gottfried JA (2007) Subliminal smells can guide social preferences. Psychol Sci 18: 1044–1049.
62. Zald DH, Pardo JV (1997) Emotion, olfaction, and the human amygdala: Amygdala activation during aversive olfactory stimulation. Proc Natl Acad Sci U S A 94: 4119–4124.
63. Royet JP, Plailly J, Delon-Martin C, Kareken DA, Sege-barth C (2003) fMRI of emotional responses to odors: influence of hedonic valence and judgment, handedness, and gender. Neuroimage 20: 713–728.
64. Yeshurun Y, Sobel N (2010) An odor is not worth a thousand words: From multidimensional odors to unidimensional odor objects. Annu Rev Psychol 61: 219–241.
65. Re´tiveau AN, Chambers E, MILLIKEN GA (2004) Common and specific effects of fine fragrances on the mood of women. J Sens Stud 19: 373–394. 66. Schiffman SS, Sattely-Miller EA, Suggs MS, Graham BG (1995) The effect of
pleasant odors and hormone status on mood of women at midlife. Brain Res Bull 36: 19–29.
67. Schiffman SS, Sattely Miller EA, Suggs MS, Graham BG (1995) The effect of environmental odors emanating from commercial swine operations on the mood of nearby residents. Brain Res Bull 37: 369–375.
68. Banks SJ, Ng V, Jones-Gotman M (2012) Does good+good = better? A pilot study on the effect of combining hedonically valenced smells and images. Neurosci Lett 514: 71–76.
69. van Reekum CM, Berg H, Frijda NH (1999) Cross-modal preference acquisition: Evaluative conditioning of pictures by affective olfactory and auditory cues. Cognition Emotion 13: 831–836.
70. Rotton J (1983) Affective and cognitive consequences of malodorous pollution. Basic and Applied Social Psychology 4: 171–191.
71. Walla P, Deecke L (2010) Odours influence visually induced emotion: Behavior and neuroimaging. Sensors 10: 8185–8197.
72. Bar M (2004) Visual objects in context. Nat Rev Neurosci 5: 617–629. 73. Morrin M, Ratneshwar S (2000) The impact of ambient scent on evaluation,
attention, and memory for familiar and unfamiliar brands. J Bus Res 49: 157– 165.
74. Henshaw V (2013) Researching urban olfactory environments and place through sensewalking. In: Presented at the PhD Colloqium on ‘‘Understanding Places’’. Available: http://home.wmin.ac.uk/docs/SABE/Events/Victoria_ Henshaw_et_al.pdf: University of Westminster, UK.
75. Ward P, Davies B, Kooijman D (2007) Olfaction and the retail environment: examining the influence of ambient scent. Service Business 1: 295–316. 76. Spangenberg ER, Crowley AE, Henderson PW (1996) Improving the store
environment: do olfactory cues affect evaluations and behaviors? J Marketing 60: 67–80.
77. Chebat J-C, Michon R (2003) Impact of ambient odors on mall shoppers’ emotions, cognition, and spending: A test of competitive causal theories. J Bus Res 56: 529–539.
78. Isen AM, Shalker TE (1982) ‘‘The Effect of Feeling State on Evaluation of Positive, Neutral and Negative Stimuli: When You ‘Accentuate the Positive,’ Do You ‘Eliminate the Negative’. Social Psychology Quarterly 45: 58–63. 79. Schwarz N, Clore GL (1983) Mood, misattribution, and judgments of
well-being: informative and directive functions of affective states. J Pers Soc Psychol 45: 513–523.
80. Schwarz N (1990) Feelings as information: Informative and motivational functions of affective states. In: Sorrentino, R M. and Higgins, E T. editors. Handbook of motivation and cognition: Foundations of social behavior. New York, USA: Guilford Press. 527–561.
81. Lerner JS, Keltner D (2000) Beyond valence: toward a model of emotion-specific influences on judgement and choice. Cognition Emotion 14: 473–493. 82. Russell JA (2003) Core affect and the psychological construction of emotion.
Psychol Rev 110: 145–172.
83. Clore GL, Huntsinger JR (2007) How emotions inform judgment and regulate thought. Trends Cogn Sci 11: 393–399.
84. Michael GA, Jacquot L, Millot JL, Brand G (2003) Ambient odors modulate visual attentional capture. Neurosci Lett 352: 221–225.
85. Michael GA, Jacquot L, Millot J-L, Brand G (2005) Ambient odors influence the amplitude and time course of visual distraction. Behav Neurosci 119: 708– 715.
86. Seigneuric A, Durand K, Jiang T, Baudouin JY, Schaal B (2012) The nose tells it to the eyes: crossmodal associations between olfaction and vision. Perception 39: 1541–1554.
87. Seo HS, Roidl E, Mu¨ller F, Negoias S (2010) Odors enhance visual attention to congruent objects. Appetite 54: 544–549.
88. Tomono A, Kanda K, Otake S (2011) Effect of smell presentation on individuals with regard to eye catching and memory. Electron Comm Jpn 94: 9–19.
89. Todd RM, Cunningham WA, Anderson AK, Thompson E (2012) Affect-biased attention as emotion regulation. Trends Cogn Sci 16: 365–372. 90. Leppa¨nen JM, Hietanen JK (2003) Affect and face perception: odors modulate
the recognition advantage of happy faces. Emotion 3: 315–326.
91. Ehrlichman H, Halpern JN (1988) Affect and memory: Effects of pleasant and unpleasant odors on retrieval of happy and unhappy memories. J Pers Soc Psychol 55: 769–779.
92. Krusemark E, Li W (2012) Enhanced olfactory sensory perception of threat in anxiety: An event-related fMRI study. Chem Percept 5: 37–45.
93. Baus O, Bouchard S (2010) The sense of olfaction: Its characteristics and its possible applications in virtual environments. J CyberTherapy Rehab 3: 31–50. 94. Oshima C, Wada A, Ando H, Matsuo N, Abe S, Yanigada Y (2007) Improved delivery of olfactory stimukus to keep drivers awake. In: Workshop on DSP for in-Vehicle and Mobile Systems.
95. Yanigada Y, Kawato S, Noma H, Tetsutani N, Tomono A (2003) A nose-tracked, personal olfactory display. In: International Conference on Computer Graphics and Interactive Techniques. ACM SIGGRAPH 2003 Sketches & Applications. New York, USA: ACM. 1.
96. Yanigada Y, Adachi T, Miyasato T, Tomono A, Kawato S, et al. (2005) Integrating a projection-based olfactory display with interactive audio-visual contents. In: HCI International 2005. Las Vegas, USA.
97. Yanigada Y, Kawato S, Noma H, Tomono A, Tetsutani N (2004) Projection-based olfactory display with nose tracking. In: Proceedings of IEEE Virtual Reality 2004. Piscataway, NJ, USA: IEEE. 43–50.
98. Yu J, Yanigada Y, Kawato S, Tetsutani N (2003) Air cannon design for projection-based olfactory display. In: Proceedings of the 13th International Conference on Artificial Reality and Telexistence. 136–142.
99. Richard E, Tijou A, Richard P, Ferrier J-L (2006) Multi-modal virtual environments for education with haptic and olfactory feedback. Virtual Reality 10: 207–225.
100. Riener R, Harders M (2012) Olfactory and gustatory aspects. In: Riener, Robert and Harders, Matthias, editors. Virtual Reality in Medicine. London: Springer. 149–159.
101. Ghinea G, Ademoye OA (2011) Olfaction-enhanced multimedia: perspectives and challenges. Multimed Tools Appl 55: 601–626.
102. Chalmers A, Debattista K, Ramic-Brkic B (2009) Towards high-fidelity multi-sensory virtual environments. Visual Comput 25: 1101–1108.
103. Davis SB, Davies G, haddad R, Lai M-K (2007) Smell Me: Engaging with an interactive olfactory game. In: Bryan-Kinns, N, Blanford, A, Curzn, P, and Nigay, L. editors. People and Computers XX – Engage. Proceedings of HCI 2006. London: Springer. 25–40.
104. Mochizuki A, Amada T, Sawa S, Takeda T, Motoyashiki S, et al. (2004) Fragra: a visual-olfactory VR game. In: Proceedings of the International Conference on Computer Graphics and Interactive Techniques ACM SIGGRAPH 2004 Sketches. New York, NY, USA: ACM. 123.
105. Bordnick PS, Traylor A, Copp HL, Graap KM, Carter B, et al. (2008) Assessing reactivity to virtual reality alcohol based cues. Addictive Behaviors 33: 743–756.
106. Traylor AC, Bordnick PS, Carter BL (2009) Using virtual reality to assess young adult smokers’ attention to cues. CyberPsychol Beh 12: 373–378. 107. Gerardi M, Olasov Rothbaum B, Ressler K, Heekin M, Rizzo A (2008) Virtual
reality exposure therapy using a virtual Iraq: Case report. J Trauma Stress 21: 209–213.
108. Taylor RB (1999) The incivilities thesis: Theory, measurement, and policy. In: Langworthy, R H. editors. Measuring What Matters: Proceedings From the Policing Research Institute Meetings. Washington, DC: U.S. Department of Justice, Office of Justice Programs. 65–88.
109. Taylor RB (1997) Social order and disorder of street blocks and neighborhoods: Ecology, microecology, and the systemic model of social disorganization. J Res Crime Delinq 34: 113–155.
110. Perkins DD, Taylor RB (1996) Ecological assessments of community disorder: Their relationship to fear of crime and theoretical implications. Am J Commun Psychol 24: 63–107.
111. Skogan W (1990) Disorder and decline: crime and the spiral of decay in american cities. Berkeley, CA, USA: University of California Press. 112. Perkins DD, Meeks JW, Taylor RB (1992) The physical environment of street
blocks and resident perceptions of crime and disorder: Implications for theory and measurement. J Environ Psychol 12: 21–34.
113. LaGrange R, Ferraro K, Supancic M (1992) Perceived risk and fear of crime: Role of social and physical incivilities. J Res Crime Delinq 29: 311–334. 114. Lorenc T, Petticrew M, Whitehead M, Neary D, Clayton S, et al. (2013) Fear
of crime and the environment: systematic review of UK qualitative evidence. BMC Public Health 13: 496.
115. Bitner MJ (1992) Servicescapes: the impact of physical surroundings on customers and employees. J Marketing 56: 57–71.
116. Bell PA, Greene TC, Fisher JD, Baum A (2010) Environmental psychology. 5th Ed. London, UK: Lawrence Erlbaum Associates.
117. Brosch T, Pourtois G, Sander D (2010) The perception and categorisation of emotional stimuli: A review. Cognition Emotion 24: 377–400.
118. Begall K, Kiewiet J, Sapulete S, Veldhuis T (2006) Broken windows: The effect of disorder on fear [dissertation]. Groningen, The Netherlands: University of Groningen.
119. Steenbeek W, Hipp JR (2011) A longitudinal test of social disorganization theory : Feedback effects among cohesion, social control, and disorder. Criminology 49: 833–871.
120. Caughy MO, O’Campo PJ, Patterson J (2001) A brief observational measure for urban neighborhoods. Health Place 7: 225–236.