Research Article
Electromagnetic Radiation Measurements and Safety Issues of some Cellular
Base Stations in Nablus
A. Mousa*
Electrical Engineering Department, An Najah University, Palestine.
Received 17 July 2010; Accepted 20 February 2011
Abstract
As the mobile telecommunication systems are tremendously growing allover the world then the numbers of handheld and base stations are also rapidly growing and it became very popular to see these base stations distributed everywhere in the neighborhood and on roof tops which has caused a considerable amount of panic to the public in Palestine concerning wither the radiated electromagnetic field from these base stations may cause any health effect or hazard. This paper focuses on the radiated electromagnetic energy from some typical mobile base stations around the city of Nablus. The exposure levels due to these stations were measured and compared to some international standard guidelines like ICNIRP and FCC to see if it meets these standards, this is in order to answer some of the public fear and concern. The results are presented and some comments are made on the other sources of electromagnetic radiation in the 200 kHz to 3 GHz range.
Keywords: Electromagnetic pollution, mobile base station, exposure limitations.
Journal of Engineering Science and Technology Review 4 (1) (2011) 35-42
Technology Review
www.jestr.org
Electromagnetic Field (EMF) and waves are an important and main media to carry signals from a certain source to the
de-sired destination; this signal can be voice, data or image. The EMF
is propagating at the speed of light in free space (300,000km/s) so it can be modulated, transmitted and received while conveying the
necessary information [1], [2] and [3].
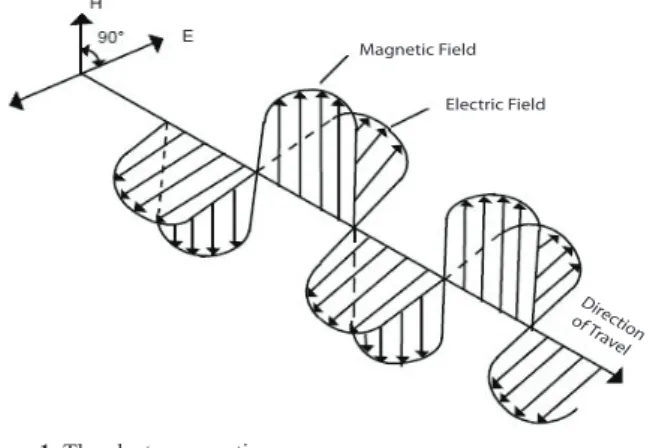
This electromagnetic wave consists of an electric field per
-pendicular to the magnetic field and both are per-pendicular to the direction of propagation as shown in Figure 1. The wave length of the wave depends on the operating frequency.
Different types of electromagnetic waves have different
fre-quencies as shown by the electromagnetic spectrum in Figure 2.
Each of these frequencies has its own properties and
characteris-tics which make it distinguished from others. The Electromagnetic radiation may be classified as ionizing and non-ionizing radiation. Ionizing radiation has enough energy to remove bound electrons from the orbit of an atom such that it becomes an ionized atom which may cause health hazard. On the other hand, the non-ioniz
-ing radiation does not have the sufficient energy to ionize (change) the atoms. For example, the human eye can easily perceive the
light whereas the EMF with very high frequency, like X-ray, may
ionize material and break down molecules. However, this radioac -tive radiation should not be confused with radio wave frequency
(RF).
The radio waves used in mobile telephones and cellular com -munications are also electromagnetic waves like visible light and
X-ray and they also propagate in the same speed of light. The
RF used for mobile communication can be in the range 450-2200
MHz which is considered as part of the microwave (MW) range as shown in Figure 2. It is also shows the range of non-ionizing and ionizing ranges of frequency and the applications of each one as well as the energy associated with each one. Obviously, the wave energy is directly proportional to the wave frequency.
* E-mail address: [email protected]
ISSN: 1791-2377 © 2011 Kavala Institute of Technology. All rights reserved. 1. Introduction
Magnetic Field
Electric Field
Direc tion of
Travel
2. Cellular Networks
A cellular communication system is one of the most increasing
telecommunication sectors. It consists of several transmitters, called base stations, covering adjoining zones, called cells, and the used mobile phones. There exist several mobile radio systems
in the world ranging from analog to digital systems and having
different multiple access types and frequency carriers. The main
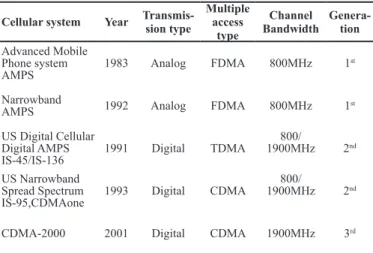
three systems are the North America, European and Japan systems where each of these systems was developed and through
genera-tions. The specifications of these systems are illustrated in Table 1, Table 2 and Table 3 respectively.
Cellular system Year Transmis-sion type
Multiple access
type
Channel Bandwidth
Genera-tion
Advanced Mobile Phone system AMPS
1983 Analog FDMA 800MHz 1st
Narrowband
AMPS 1992 Analog FDMA 800MHz 1
st
US Digital Cellular Digital AMPS IS-45/IS-136
1991 Digital TDMA
800/
1900MHz 2nd
US Narrowband Spread Spectrum IS-95,CDMAone
1993 Digital CDMA
800/
1900MHz 2nd
CDMA-2000 2001 Digital CDMA 1900MHz 3rd
Cellular system Year Trans-mis-sion type
Multiple access
type
Channel Bandwidth
Genera-tion
Total Access Communication
ETACS 1985 Analog FDMA 900MHz 1
st
Nordic Mobile Telephone
NMT-900 1986 Analog FDMA 450/900MHz 1
st
Global system of
Mobile GSM 1990 Digital TDMA 900/1800MHz 2nd UNIVERSAL
Mobile Telecom System UMTS WCDMA
2001 Digital CDMA 2000MHz 2nd
Cellular system Year Trans-mission
type
Multiple access
type
Channel Band-width
Gener-ation
J-TACS 1985 Analog FDMA 900MHz 1st
PDC 1986 Digital TDMA 900MHz 2nd
CDMA one (KDDI) 2000 Digital CDMA 900MHz 2nd
UMTS WCDMA (NTT Docomo) 2001 Digital CDMA 2000MHz 3rd
Considering the GSM system as one of the most popular cel -lular system allover the world and being the one which is adopted and operating in Palestine, then the operating frequency may be
summarized as shown in Table 4.
GSM range (MHz) Uplink (MHz) Downlink (MHz)
900 890-915 935-960
1800 1710-1785 1805-1880
1900 1850-1910 1930-1990
I) Base Station
The cells radii many vary in size according to the desired capac -ity and geographical area to be covered, this ranges from tens of meters in buildings, and hundreds of meters in cities up to tens of
kilometers in the countryside [4]. Each of these cells is covered by
the allocated base station which is responsible for transmitting and receiving the radio signal required to establish the communication
between users. The base station must be designed in a way such that each cell in the network can perform efficiently to achieve
good signal, minimum congestion or call drop and no interference
[5]. The RF power should be assigned to achieve these goals. It
should be large enough to provide coverage and quality but small
enough to prevent interference.
To complete a call from any mobile phone, the network as -signs a certain available RF channel within the cell that covers the named mobile phone, if this cell is congested then this mobile phone is connected through a neighboring cell, the call is then
routed to a switch that will proceed conventionally to the final destination being mobile or fixed destination. In case the user is
moving and will cross the boundary of a cell into the range of a neighboring one, the network will “handover” the call from the serving base station into an other one that can provide coverage
10-13 10-12 10-11 10-10 10-9 10-8 10-7 10-6 10-5 10-4 10-3 10-2 0,1 1 10102 103 104 105 106 107108 109 1010 1011 10 102 103 104 105 106 107 108 109 1010 1011 1012 1013 1014 1015 1016 1017 1018 1019 1020 1021 1022 1023 1024 1025 1026
Energy (eV) Frequency
(Hertz) Power Lines
Cellular Radio Microwaves Radio and Television
�
Infra-red violetUltra X-rays Gamma Rays
� Radiofrequencies�
IONIZING NON - IONIZING
Visible Light
Figure 2. The electromagnetic spectrum, energy and some applications
Table 2. Mobile radio systems around the world.
Table 1. Mobile radio systems in USA.
Table 3. Mobile radio systems in Japan.
Table 4. GSM frequency Spectrum.
and capacity to this on-going call. An illustration of the neighbor
-ing cells is shown in Figure 3. The shape of cells are not perfect circles or hexagonal, but it depends on the environment such as
buildings and mountains, it also depends on weather conditions
and even system load [4], [5].
It is important to mention here that multiple cells are needed to cover an area both in capacity and signal strength, this is due to the fact that each cell can provide a limited number of
instantane-ous calls [5]. Hence, as the number of base stations operating at particular carrier frequency increases in a certain area the cell size
gets smaller and so less power is required, for transmission, to
cover this small-sized cell.
To achieve the desired goals of the base station, antennas
with certain power, orientation and gain should be chosen and
fixed properly. The gain of the antenna is important but also it
should be mounted clearly with no obstacles that may reduce the coverage or signal strength of the base station since these obsta-cles will force the base station to use higher power to cover the cell which is waste of resources and may cause interference with
the neighboring cells. The coverage area of a typical antenna is illustrated in Figure 4 [6].
In small cells case, where mobile phones are highly used, antennas may be installed on building roofs and sides or on small poles (low impact facilities), while in the case of large cells (low usage area), the antennas are usually mounted on masts and
tow-ers to deal with the large distances and gains. In both cases, it is desired to maintain service quality to all users. Typical antenna types and way of fixing is illustrated in Figure 5.
Typical heights of these antennas are 15-50 meter from ground. A base station may consist of several “omni directional”
antennas, each one is directed to a certain geographical direction, and the signal from this antenna is directed to cover the desired area in a relatively narrow beam in the vertical plane as shown in
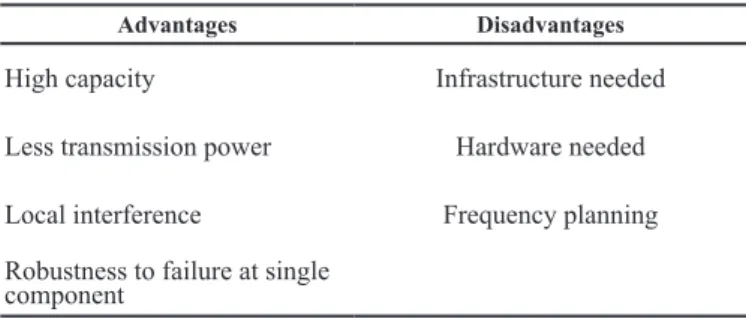
Figure 4. The advantages and disadvantages of cellular systems with small cells are shown in Table 5.
Advantages Disadvantages
High capacity Infrastructure needed
Less transmission power Hardware needed
Local interference Frequency planning
Robustness to failure at single component
II) Mobile phones
Mobile phones are connected to the base stations via
radiofrequen-cy electromagnetic waves (RF-EMF). These mobile phones should
be in the coverage area of a certain cell; the base station of this cell must assign this mobile phone the necessary RF channel to
main-tain the connection. To achieve this link, the mobile should use
certain transmission power to connect to the base station (uplink) and the base station should use the required power to connect to the
mobile phone (down link).
Similar to the base station case, the mobile phone should not have obstacles since this reduces the signal strength and so the
quality becomes poor. Increasing the transmission power means
the mobile will not work on the minimum power which results in waste of resources and lose of battery life as well as other problems
that may arise.
It is important to conserve the battery life and to minimize
the interference between cells and hence the mobile transmission power is limited to the minimum level required to maintain the connection and so it is better to be close to the base station so as to
reduces the transmission power in both directions.
III) Quality in Mobile Communications
The sound quality in mobile communications depends on two
items [4], [5], [6]) Strength of the radio signal to convey the data, and 2) No other strong RF signals should present at the same or
even adjacent frequencies. To achieve these two points, the mobile and base station must use the appropriate output power. The inten -sity of the EMF is decreased as the distance from the antenna is increased, this enables use of the same frequency in a new cell at a
certain distance from the first base station without any disturbance
between these two cells, this is called “frequency-reuse” which is
so important to be optimized since the mobile network is limited in frequency spectrum [6].
Actually, the power density (intensity) decreases by a factor of
the square of the distance as one move away from the base station.
Moreover, the intensity is proportional to the transmitter’s output
power. Typically the available mobiles have a maximum output
power of one watt, but only a fraction of this power is used to
establish good communication under the normal conditions. Some
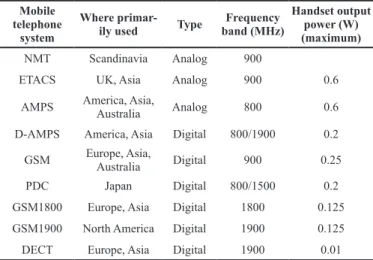
typical values of the handset output power, for the most common
mobile phone systems, is given in Table 6.
The output power of a base station ranges from few watts for
Table 5. Advantages and disadvantages of small cells cellular
communication system.
Base station mast
Antenna
Beam 15 - 50 m
50 - 300 m 5 - 100
Figure 4. Direction of coverage due to a base station antenna
small cells to hundreds of watts for huge cells depending on some
parameters such as the type and location. Moreover, this power is
usually directed so that the signal is stronger in some directions and
weak in the others as it is desired.
Mobile telephone
system
Where primar-ily used Type
Frequency band (MHz)
Handset output power (W) (maximum)
NMT Scandinavia Analog 900
ETACS UK, Asia Analog 900 0.6
AMPS America, Asia,
Australia Analog 800 0.6
D-AMPS America, Asia Digital 800/1900 0.2 GSM Europe, Asia, Australia Digital 900 0.25
PDC Japan Digital 800/1500 0.2
GSM1800 Europe, Asia Digital 1800 0.125 GSM1900 North America Digital 1900 0.125
DECT Europe, Asia Digital 1900 0.01
3. Safety Guidelines to Level of Exposure
Since it was first introduced around 1980, almost all classes of so
-ciety are using mobile phones. The estimated number of mobile phone users is around 1.5 billion all over the world [7]. The Cellu
-lar Telecommunication Industry Association (CTIA) has reported that this industry is growing at a rate of 40% per year [8]. This so
fast rapid deployment of mobile telecommunications networks in the world has alert public concern over possible health effects from
exposure to radiofrequency electromagnetic energy (RF EME) emitted by both mobile phones and base station antennas.
I) Health and Safety
The exposure to very high levels of RF energy can be harmful and
may cause some biological effects on human [9], [10], these effects may result from heating of tissues and it is called “thermal effects” this is mainly due to the ability of RF energy to heat biological
tissue, this is the same as the principle of the microwave oven. On the other hand, at low levels of exposure to RF radiation (lower
than the threshold which may cause heat), the evidence of harm-ful biological effects is unproven; however it may cause some non
thermal effects [11]. At the extremely high frequencies like X-rays, electromagnetic particles have sufficient energy to break bonds (ionization). This is why genetic material of cells may be damaged leading to cancer or birth defects. However, at lower frequencies,
such as the RF ones used by cellular communications, the energy
of the particles is too much low to break chemical bonds. Thus, RF energy is non-ionizing [12]
II) Standards and Limitations
The main concern of RF exposure has started some sixty years ago
where several national and international standards, regulations
and recommendations for RF energy exposure were developed for
both the general public (unconditional exposure) and those who are working with this field (occupational exposure). These expo -sure guidelines are usually similar and are based on the thresholds for known adverse effects and they have a margin of safety in order to protect people from the health effects of both short and
long term exposure to EMF [13]. Some of these standards were organized and developed by the following organizations;
1) World Health Organization (WHO) [13]
2) International Commission on Non-Ionizing Radiation Pro -tection [14]
3) Federal Communications Commission (FCC).
4) Institute of Electrical and Electronic Engineering (IEEE). 5) Environmental Protection Agency (EPA).
6) Food and Drug Administration (FDA).
7) American Cancer Society (ACS)
8) National Institute for Occupational Safety and Health
(NI-OSH).
9) Occupational safety and Health Administration (OSHA) 10) National Council of Radiation Protection and
Measure-ments (NCRPM).
11) Australian Radiation Protection and Nuclear Safety
Agen-cy (ARPNSA).
The importance of WHO is that it has established the “Inter
-national EMF Project” to review the scientific literature concern
-ing the biological effects of electromagnetic fields. The main aim of this project is to provide a frame work for the international harmonization of RF safety standards [13]. The ICNIRP is con
-sidered as the most important organization specifying radio fre -quency EMF limits due to the following items [14];
a) ICNIRP guidelines were published in 1998.
b) Limits are based on all available scientific research and include large safety margins.
c) Limits are set to protect all people from established
ad-verse health effect from short and long term exposure. d) Specifies limits for both general public and occupational
exposure.
e) Endorsed by WHO.
When the distance to the radio transmitter is in the far field (greater then few wavelengths, i.e., around one meter for RF), safety limits are usually expressed as field strength. The field in
-tensity is usually applied to exposure from base stations. Since RF
waves have both electric and magnetic components, the electric
field strength is measured in volts per meter (v/m) and the mag
-netic field is measured in amperes per meter (A/m). A commonly used unit to characterize the RF electromagnetic field is the plane wave power density especially at the far field. This density is de
-fined as the power per unit area; it may be expressed in terms of
watts per square meter (w/m²), milliwatts per square centimeter
(mw/cm²) or microwatts per square centimeter (µw/cm²).
For the case where the exposure is local (RF is transmitted
from the mobile phone and hence closer to the user), the highest power absorption per unit mass in a small part of the body must
be used and compared with the recommendations and standards. Specific Absorption Rate (SAR) is the quantity used to measure this amount of RF energy and it is expressed in units of watts per kilogram (W/kg) or (mW/kg).
The Maximum Permissible Exposure (MPE) recommended for power density is based on the threshold SAR value. However
some guidelines may vary from each other for different operating
frequencies. Actually, Whole-body human absorption of RF en
-ergy varies with the frequency of the RF wave [11]. The frequency
range of 30-300 MHZ is considered as the resonance range to
hu-man body where it absorbs the energy efficiently when the whole body is exposed [11].
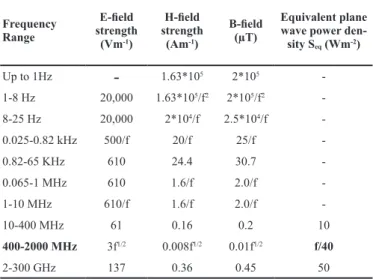
The Maximum Permissible Exposure (MPE) limits adopted by FCC in 1996 for both occupational and general public exposure expressed in terms of electric field strength (E, v/m) and magnetic field strength (H, a/m) and power density (S, w/m2) for a wide frequency range are given in Table 7. Similarly, the ICNIRP limits for frequencies up to 300 GHz are given in Table 8. The details
of the MPE for both ICNIRP and FCC are given in [14] and [15]
respectively. In the far field of a transmitting antenna (plane wave case) the magnetic field may be given as E/377 and the power density is calculated as given in Eq.1.
(1)
Where E is the electric field strength (v/m)
(A) Limits for Occupational/Controlled Exposure
Frequency Range (MHz)
Electric field
Strength (E) (V/m)
Magnetic field
Strength (H) (A/m)
Power density
(S) (mW/cm2)
Averaging Time |E|2,|H|2 or S
(minutes)
0.3-3.0 614 1.63 (100)* 6
3.0-30 1842/f 4.89/f (900/f2)* 6
30-300 61.4 0.163 1.0 6
300-1500 -- -- f/300 6
1500-100,000 -- -- 5 6
(B) Limits for General Population/Uncontrolled Exposure
Frequency Range (MHz)
Electric field
Strength (E) (V/m)
Magnetic field
Strength (H) (A/m)
Power density
(S) (mW/cm2)
Averaging Time |E|2,|H|2 or S
(minutes)
0.3-1.34 614 1.63 (100)* 30
1.34-30 824/f 2.19/f (180/f2)* 30
30-300 27.5 0.073 0.2 30
300-1500 -- -- f/1500 30
1500-100,000 -- -- 1.0 30
f = frequency in MHz *Plane-wave
equivalent power density
A) Limits for Occupational/Controlled Exposure*
Frequency Range
E-field
strength (Vm-1)
H-field
strength (Am-1)
B-field
(µT)
Equivalent plane wave power
den-sity Seq (Wm-2)
Up to 1Hz
-
1.63*105 2*105-1-8 Hz 20,000 1.63*105/f2 2*105/f2
-8-25 Hz 20,000 2*104/f 2.5*104/f
-0.025-0.82 kHz 500/f 20/f 25/f
-0.82-65 KHz 610 24.4 30.7
-0.065-1 MHz 610 1.6/f 2.0/f
-1-10 MHz 610/f 1.6/f 2.0/f
-10-400 MHz 61 0.16 0.2 10
400-2000 MHz 3f1/2 0.008f1/2 0.01f1/2 f/40
2-300 GHz 137 0.36 0.45 50
*Note:1 f as indicated in the frequency range column.
(B) Limits for General Populations/Uncontrolled Exposure*
Frequency Range
E-field
strength (Vm-1)
H-field
strength (Am-1)
B-field
(µT)
Equivalent plane wave power
den-sity Seq (Wm-2)
Up to 1Hz
-
3.2×10⁴ 4×10⁴-1-8 Hz 10.000 3.2×10⁴/f 4×10⁴/f
-8-25 Hz 10.000 4.000/f 5,000/f
-0.025-0.8 kHz 250/f 4/f 5/f
-0.8-3 kHz 250/f 5 6.25
-3-150 kHz 87 5 6.25
-0.15-1 MHz 87 0.73/f 0.92/f
-1-10 MHz 87/ f1/2 0.73/f 0.92/f
-10-400 MHz 28 0.073 0.092 2
400-2000 MHz 1.375 f1/2 0.0037 f1/2 0.0046 f1/2 f/200
2-300 GHz 61 0.16 0.20 10
*Note: 1 f as indicated in the frequency range column.
It is clear from these recommendations that the MPE is a
function of the operating frequency. Hence for 900 MHz the MPE for both FCC and CNIRP is shown in the Table 9.
FCC (W/ m²) ICNIRP (W/ m²)
General public exposure 6 4.5
Occupational exposure 30 22.5
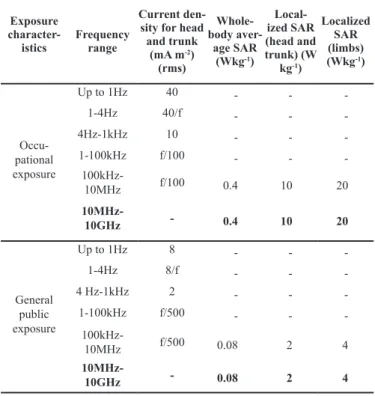
The Specific Absorption Rate (SAR) is a value that corre -sponds to the relative amount of RF energy absorbed by certain
amount of the tissues of the body which is exposed to RF radiation. The FCC adopted limits for localized ‘partial body’ absorption in
Table 7. FCC Limits for Maximum Permissible Exposure (MPE).
2
377
E
S
=
Table 8. ICNIRP reference levels for Maximum Permissible Ex
-posure (MPE).
terms of SAR, which apply to certain portable transmitters such as
hand-held mobile telephones. A similar principle is adopted by the ICNIRP for the frequencies up to 10 GHz as shown in Table 10. These limits were set such that a safety factor of 10 and 50 were
considered for the basic restrictions for occupational and general
public exposures, respectively. The ICNIRP guidelines are gener
-ally accepted around the world. However, some countries such as USA and Canada have their own national SAR limits. A compari -son between the SAR limits set by FCC and ICNIRP is shown in
Table 11 for the 900 MHz operating frequency.
Exposure
character-istics
Frequency range
Current den-sity for head and trunk
(mA m-2)
(rms)
Whole-body
aver-age SAR (Wkg-1)
Local-ized SAR (head and trunk) (W
kg-1)
Localized SAR (limbs) (Wkg-1)
Occu-pational exposure
Up to 1Hz 40 - -
-1-4Hz 40/f - -
-4Hz-1kHz 10 - -
-1-100kHz f/100 - -
-
100kHz-10MHz f/100 0.4 10 20
10MHz-10GHz - 0.4 10 20
General public exposure
Up to 1Hz 8 - -
-1-4Hz 8/f - -
-4 Hz-1kHz 2 - -
-1-100kHz f/500 - -
-
100kHz-10MHz f/500 0.08 2 4
10MHz-10GHz - 0.08 2 4
*Note: 1 f is the frequency in hertz.
2 average time is 6 minuets
ICNIRP (W/kg) FCC (W/kg)
Occupational
Whole-body 0.4 0.4
Head and trunk 10 8
General public
Whole-body 0.08 0.08
Head and trunk 2 1.6
* averaged over 1 gram of tissue
4. Measurements
Most of the governments put certain requirements on companies who want to operate and construct base station antennas, these
re-quirements concerns the worst case estimate of the RF-EMF public
exposure before the development can occur. Initially, some predic -tion values can be considered for the RF-EMF using some software tools, this can be achieved theoretically before the site is
construct-ed. However, more accurate results can be obtained by measuring the radiated levels and compare it to the calculated ones. Measur
-ing the exposure levels at a certain number of sites is necessary to verify the calculations and assess the actual exposure levels.
As this work focuses on the already constructed and operat-ing base stations, then the radiation measurement is the practical
issue to be performed. This has to be repeated occasionally and the values are to be compared with the international guidelines. Hence,
sensitive equipment is required to measure the radio signals around
the area of interest. A power density meter may be used to measure the electric field, magnetic field and power density in the vicinity of a mobile base station.
The device which was used here has an isotropic antenna and works in the frequency range of 0.2-3GHz. This relatively wide
range covers many common radio frequencies but not only the cel-lular communication band and so the measured power density
val-ues are not due to the mobile base station only. A portable electric field meter (E field) with detachable isotropic probe was used to take the necessary readings. The main specifications of the measur
-ing device are illustrated in Table 12.
Wide dynamic range: 0.2-600V/m.
Resolution (at range): 0.01 V/m (2 V/m and 20 V/m), 0.1 V/m (200 V/m), 1 V/m (600 V/m). Broad frequency range: 0.2 MHz-3GHz.
Probe directivity: Omni directional (Isotropic probe).
Ranges (V/m ,full scale): 2, 20, 200, 600.
Calibration accuracy: +/-1.5dB (at reference levels). Typically +/-1dB.
Probe frequency rotational : +/-1dB(2MHz-2GHz), -3 [email protected]:-2.5dB@3GHz. Probe frequency isotropicity: +/-0.5dB (2MHz-2.8GHz).
Operating modes: Average, Pulse AND Peak.
Reading RMS (root mean square) in all modes:
A series of RF-EMF measurements in the form of electric
field at the vicinity of several mobile telephone base stations in the city of Nablus were conducted in order to determine the exposures of the general public. The relationship between the RF power den
-sity levels specified in the safety guidelines and some typical RF
power density levels actually measured around mobile phone base
stations will be given.
Several typical 900 MHz sites were considered, the first one
had three antennas, A, B and C, and each of them has a gain of
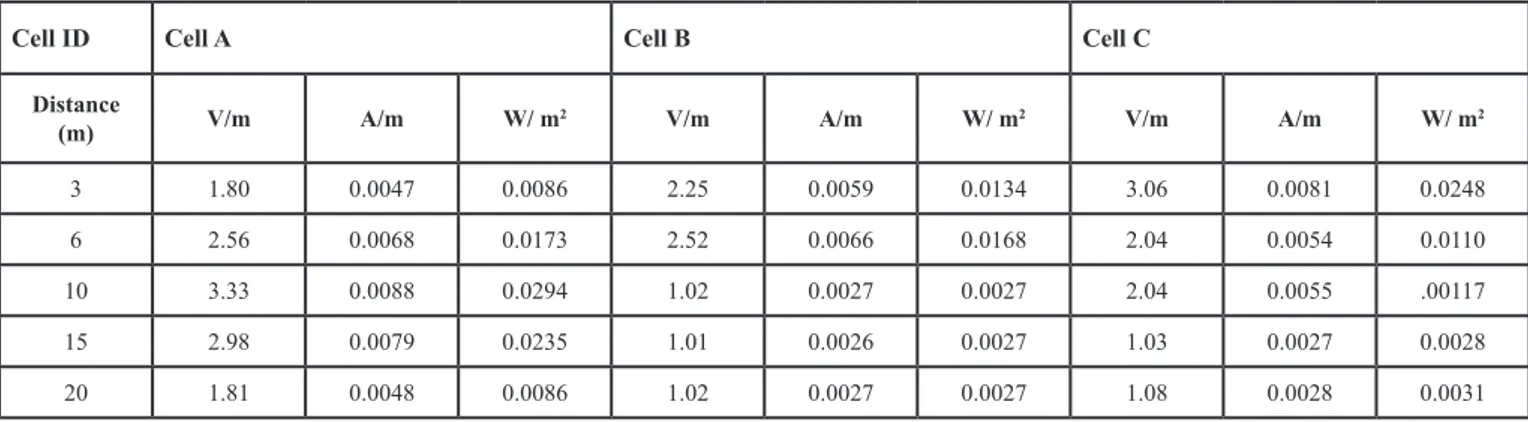
9 dBi and zero tilting angles with a height of the antennas as 17 m. The electric field intensity was measured at different distances from the base station. Accordingly, the magnetic field and power density were calculated and recorded as shown in Table 13. The process has been repeated for five different sites with antenna gain
of 6, 9, 12, 15 and 15 dBi and with a tilting angle ranges from 0
to 4. The measured values of the electric field and the correspond
-Table 10. The SAR and basic restrictions set by ICNIRP*.
Table 11. FCC and ICNIRP limits for Localized (Partial-body)
Exposure*.
ing calculated values of the magnetic field and power density were averaged and recorded as shown in Table 14.
For a radiation source with omni direction and with no
re-flected signals the received signal strength decreases as the re
-ceiver moves far away from the source. In our case, the received signal depends on the reflected signal as well as the tilting angle of the antenna as shown in Fig 4. This explains the reason why the
measured values are not consistence with the distance from the
source. Moreover, it was clearly noticed that a reasonable amount
of the received power was either removed or added to the received amount when the measurement is interrupted by a moving body
like a car.
Considering a typical distance of 20 meter away from the
first base station, the electric field was measured as 0.7 v/m lead
-ing to a power density of 0.0013 w/m2, which is 0.000288% of the ICNIRP limit and 0.002166% of the FCC limit. On the other hand, the maximum value of the electric field density was meas
-ured at a distance of 10 meters from the base station as 3.49 v/m; this value leads to a power spectral density of 0.0323 w/m2 which is 0.00718% of the ICNIRP limit and 0.00538% of the FCC limit. These results show that the measured and calculated values for the electric field, the magnetic field and the power density around the city were small compared to the international standards.
This low radiation could be due to the restrictions put on the
local mobile communication operator in using a limited number of frequencies and so the same frequency must be reused again in a short distance and hence the radiated power should be kept
minimum so as to prevent interference [16].
Even though the power density emitted by the base stations
is lower than the permitted levels but it is still very important to measure the power radiated by the mobile station itself, this power is believed to be more than the received one from the base
sta-tion. Moreover, there are some other sources of EMF radiation in the area; this includes the local TV and FM transmitters and the WLAN. Hence, it is important to investigate the radiation from these sources.
Conclusion
Measuring the electromagnetic radiation from some cellular base stations around the city of Nablus has been performed at several
sites. This is to answer the public concern wither they are safe being close to these stations and being exposed continuously to its radiation. The obtained readings were compared to some in
-ternational standards and guidelines. It has been noticed that the maximum measured value was only 0.007% of the ICNIRP and 0.005% of the FCC international limits. Moreover, the measured
values were not only due to the mobile base stations, but also due
to all other sources of radiation in the range of 200kHz to 3GHz. The signals here may have either destructive or instructive inter
-ference at some specific point, hence it is recommended that the
radiation due to the base stations should be investigated together
with the other sources like local TV, FM and WLAN transmitters, this may be achieved using a suitable spectrum analyzer. Another important issue is that the radiation exposure to the mobile station
itself should be measured since it may have a much larger value
being very close to the users.
Cell ID Cell A Cell B Cell C
Distance
(m) V/m A/m W/ m
2 V/m A/m W/ m2 V/m A/m W/ m2
3 1.85 0.0049 0.0091 1.74 0.0046 0.0080 2.11 0.0056 0.0118
6 2.77 0.0073 0.0203 2.75 0.0072 0.0201 2.02 0.0053 0.0108
10 3.49 0.0092 0.0323 1.43 0.0038 0.0054 2.61 0.0069 0.0181
15 2.94 0.0078 0.0229 1.45 0.0038 0.0055 1.56 0.0041 0.0064
20 0.70 0.0018 0.0013 1.74 0.0046 0.0080 2.7 0.0071 0.0193
Table 13. EMF field measurements for site-1.
Cell ID Cell A Cell B Cell C
Distance
(m) V/m A/m W/ m
2 V/m A/m W/ m2 V/m A/m W/ m2
3 1.80 0.0047 0.0086 2.25 0.0059 0.0134 3.06 0.0081 0.0248
6 2.56 0.0068 0.0173 2.52 0.0066 0.0168 2.04 0.0054 0.0110
10 3.33 0.0088 0.0294 1.02 0.0027 0.0027 2.04 0.0055 .00117
15 2.98 0.0079 0.0235 1.01 0.0026 0.0027 1.03 0.0027 0.0028
20 1.81 0.0048 0.0086 1.02 0.0027 0.0027 1.08 0.0028 0.0031
References
1. P. Mohana Shankar, “Introduction to Wireless Systems”, Johan Wiley & Sons, INC., 2002.
2. Jon W. Mark, Weihava Zhuang, “Wireless communication and network -ing”, Prentice Hall, 2003.
3. Theodore S. Rappaport, “Wireless Communications, Principles & prac -tice”, 2nd edition, Prentice Hall, 2002.
4. William Stallings, “Wireless communication and networks”, Prentice Hall, 2002.
5. MOLISH BOOK.
6. K. Fuller, et. al., “Radio Frequency Electromagnetic Fields in the Cookridge Area of Leeds”, National Radiation Protection Board, NRPB-w23, September, 2002, ISBN 0859514943.
7. International telecommunications Union, http://www.itu.int/net/home/in -dex.aspx
8. http://www.ctia.org/
9. Physicians and Scientists for Responsible Application of science and Technology, “Mobile phones-safety Problems”, September, 2004, www. psrast.org
10. G. J. Hyland, “Potential Adverse Health Impacts of Mobile Technology,
Memorandum”, Department of physics, University of Warwick and Inter -national Institute of Biophysics, Feb. 2000.
11. Federal Communications Commission, http://www.fcc.gov/
12. John Muvlder, “Cellular Phone Antennas (Base Stations) and Human Health”, Medical college of Wisconsin, http://www.mcw.edu/gcrc/cop/ cell-phone-health-FAQ/toc.htmloo, modified 3-April-2005.
13. World Health Organization, http://www.who.int/en/
14. International Commission for Non-Ionizing Radiation Protection (IC -NIRP), “Guidelines for Limiting Exposure to Time-Varying Electric, Magnetic and Electromagnetic Fields (up to 300 GHz)”, Health Physics Society, Vol.74, No.4, PP.494-522, April 1998.
15. Federal Communication Commission, office of Engineering and Technol -ogy, “Questions & Answers about Biological Effects & Potential Hazards of radio frequency Electromagnetic Fields”, OET56, 4th edition, August
1999.