J. Microw. Optoelectron. Electromagn. Appl. vol.16 número4
Texto
Imagem
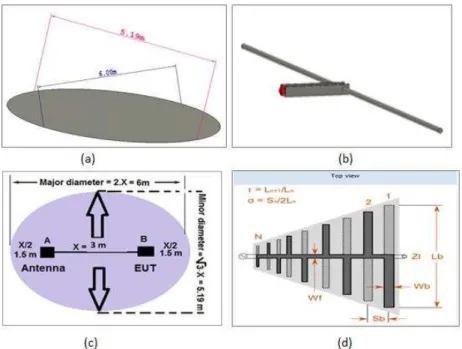
![Fig. 7. Setup used to measure the Shield effectiveness quality of cables and connectors [2]: (a) Measurement setup graphic;](https://thumb-eu.123doks.com/thumbv2/123dok_br/18888256.424355/10.892.117.748.314.530/setup-measure-shield-effectiveness-quality-connectors-measurement-graphic.webp)

Documentos relacionados
Two cross-slots are etched in the ground plane of the proposed microstrip diplexer in order to enhance its electrical performances and to set the pass bands at low frequencies..
Algorithm MUSIC is essentially a multichannel technique.. Journal of Microwaves, Optoelectronics and Electromagnetic Applications, Vol. In a PLL-based single receiver DF system,
[2] Pay am Beigi, Javad Nourinia, Yashar Zehforoosh, and Bahman Mohammadi, “A Compact Novel CPW -Fed Antenna with Square Spiral- Patch for Multiband Applications,” Microwave
Quantum Particle Swarm Optimization for Synthesis of Non-uniformly Spaced Linear Arrays with Broadband Frequency
The proposed phase sequence set achieves a 1.2 dB and 2.4 dB PAPR improvement over conventional SLM and OFDM respectively for maximum of 16 candidate signals at iterative
Abstract — Partial discharge (PD) monitoring is widely used in rotating machines to evaluate the condition of stator winding insulation, but its practice on a
We have introduced a new NMM formulation based on the use of cubic B-splines with multiple knots as expansion functions, for the modeling of well-logging tools.. Numerical
Simulated return loss of initial design antenna, with optimum IDC and after size reduction.. As it is shown
