1780 Brazilian Journal of Physics, vol. 34, no. 4B, December, 2004
Electron Density Measurements from Right-Hand
Cutoff of ECE in the TCABR Tokamak
A. M. M. Fonseca, R. P. da Silva, R. M. O. Galv˜ao, Yu. K. Kuznetzov,
J. I. Elizondo, E. R. Calderon, L. F. Ruchko, and J. H. Vuolo
Laborat´orio de F´ısica de Plasmas
Instituto de F´ısica, Universidade de S˜ao Paulo, 05315-970, S˜ao Paulo, Brazil
Received on 4 February, 2004; revised version received on 15 May, 2004
In tokamak machines with low toroidal magnetic fields and high plasma densities, the accessibility conditions impose restrictions to the detection of the Electron Cyclotron Emission ( ECE ). In these machines, the right-hand cutoff condition can be used as an independent method to determine the local electron density from the ECE data in thermal discharges. In this paper is shown the results obatined from the detection of ECE radiation in the TCABR tokamak, in operation at the Institute of Physics of University of S˜ao Paulo. The effect of the ECE radiation cutoff was observed for different radial positions of the plasma column. To reach the ECE cutoff condition, the electron density was increased monotonically by the use of an external gas puffing system. For sufficient high densities, the emission at some frequencies is cutoff and the first and the last frequency to be cutoff depends on the shape of the density profile. These measurements do not require the plasma to be optically thick. It was observed that, for a toroidal fieldBO = 1.14T, the first cutoff of ECE occurs for a radial position
r∼= 5cm. From these measurements the radial electron density was determined. For a symmetric parabolic profile ne = neo[1−(r/a)2]α, values of α between 0.86 and 0.97 were experimentally obtained. A good agreement of these values with those obtained from the microwave interferometer measurements (α≈0.85)
was found. Therefore, the ECE right-hand cutoff constitutes an independent method to obtain information about the electron density profile.
1
Introduction
ECE radiometry is a well established diagnostic for the elec-tron temperature measurements in Tokamak machines [ 1 ]. In some cases, when the ECE radiation in X mode attains the cutoff region, temperature measurements cannot be per-formed, but, in despite of this, the radiometer can be used to obtain information about the density profile. In this pa-per, we experimentally obtain the electron density from the ECE right-hand cutoff in the TCABR tokamak. This tech-nique was first used by Lohr [ 2 ] to determine the electron density in the DIII-D tokamak. Above the minimum value of the electron density, when the ECE signal begins to cu-toff, only the frequency used in the ECE radiometer and the magnetic field ( neglecting the poloidal magnetic field ) are needed to determine the local electron density. This proce-dure constitutes an independent method to obatin the local electron density and the results can be compared with those obtained with the microwave interferometer. From the value of ECE frequency that is first/last in the cutoff, the electron density profile can be determined, providing that this can be described by only one or two parameters [ 3 ].
In Section 2, a simple description of the experimental arrangement used for the measurements in the TCABR is shown. Some theoretical points of ECE cutoff method are discussed in Section 3. In Section 4, the experimental re-sults are presented and discussed.
2
Experimental aspects related to the
ECE measurements
Measurements of the electron temperature in the TCABR tokamak ( main parameters : Major radiusR0 = 61.5cm, Minor radius a = 18cm, Plasma current Ip < 120kA,
Plasma current duration tp<150ms and Toroidal
magne-tic field B0 = 1.1 − 1.2T) are routinely obtained with a sweeping heterodyne radiometer (50−85GHz) [ 4 ]-[ 5 ]. This system operates in the X mode second harmo-nic. The antenna axis is installed on the equatorial plane of the machine and perpendicular to the plasma column axis. The radiometer Intermediate Frequency ( IF ) bandwidth (≈ 2GHz) and the Gaussian Antenna determine the spatial re-solution of the radiometer. The waist diameter of the radia-tion beam (≈ 2cm) and the focus position ( focal lenght ≈ 37cm) of the antenna were experimentally obtained [ 5 ].
The electron density profile obtained from the ECE ra-diation were compared with the results obtained from a mi-crowave interferometer installed in TCABR [ 6 ]. The elec-tron density profiles can be approximated by parabolic equa-tion in the form :
ne(r) = ne0[ 1 − ( r a)
2]α
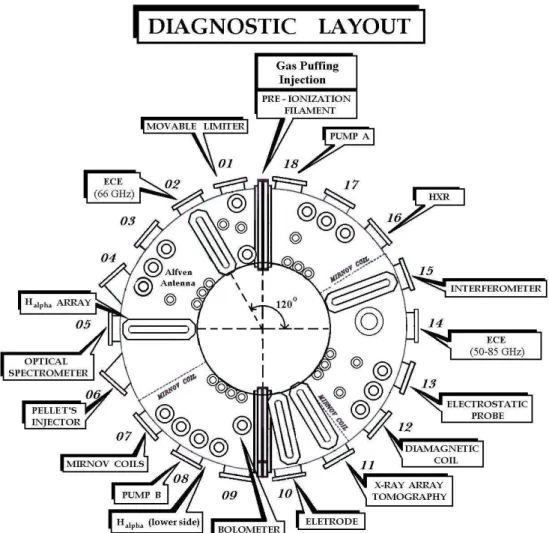
Figure 1. Schematic diagram (top view) showing the location of the main diagnostic of the TCABR tokamak.
A gas puffing injection system is normally used in the TCABR tokamak to control the electron density during the discharges. With this gas puffing system, is possible to built triangular shapes in the time density profiles. As the right-hand cutoff frequency becomes equal or larger than the se-cond ECE harmonic, due to the electron density increase, a decrease in the ECE signal is clearly observed.
In Fig. 1, a schematic top view diagram of the TCABR diagnostics location is shown. The ECE sweeping radio-meter and the interferoradio-meter are installed respectively in a horizontal ( window 14 ) and in a vertical ( window 15 ) di-agnostic port. The gas puffing injection valve is installed in an access port between the windows 1 and 18.
3
Method for the
n
eprofile
determi-nation from ECE cutoffs
The accessibility conditions for the ECE radiation in the TCABR tokamak is based on the theory of cold magnetized plasma wave propagation. The cold plasma approximation is valid when the thermal kinetic velocity of the electrons is much less than the phase velocity of the waves. Also
the collision effects can be neglected because the collision frequency is much lower than the wave frequency. As the ECE antenna is installed perpendicular to the TCABR mi-nor axis, we consider that the wave vector is perpendicular to the magnetic field. In this case the dieletric tensor is given by [ 7 ] :
←→ε =
1− ω 2
pe
ω2−ω2
ce −i
ω2
peωce
ω(ω2−ω2
ce) 0
−i ω
2
peωce
ω(ω2−ω2
ce) 1−
ω2
pe
ω2−ω2
ce 0
0 0 1−ω
2
pe
ω2
,
(2) where the electron cyclotron frequency (ωce) and the
plasma frequency (ωpe) are given respectively by :
ωce =
e Bt
me
(3) and
ωce = (
nee2
meεo
)12, (4)
where e,me, are the charge and the mass of the electron,
εo is the permitivity of free space and Bt is the toroidal
1782 Brazilian Journal of Physics, vol. 34, no. 4B, December, 2004
The dispersion relation is obtained calculating the deter-minant of the matrix :
←→
Λ =~k ~k −k2←→1 + w 2
c2
←→ε . (5)
where~k is the wave vector andcis the light velocity. For a non-trivial solution, the det←→Λ must be equal to zero. The solution for the case where E⊥ 6= 0, i.e. for X mode, the dispersion relation is given by
(˜n2)X =
(ω2 +ω ω
ce − ωpe2 ) (ω2 − ω ωce −ω2pe)
ω2(ω2 −ω2
ce − ωpe2 )
.
(6) The rigth-hand cutoff frequency is obtained from (˜n2)
X =
0 and is given by
ωc,RH =
ωce + (ω2ce + 4ω2pe)
1 2
2 . (7)
From this equation we observe that the frequency de-pends only of the magnetic field (ωce) and the eletron
den-sity (ωpe). From the right-hand cutoff frequency, the
ele-tron density can be determined from the ECE measurements if we know the magnetic field. To occur a local cutoff we need to have the condition :
ωcRH ≥ 2ωce. (8)
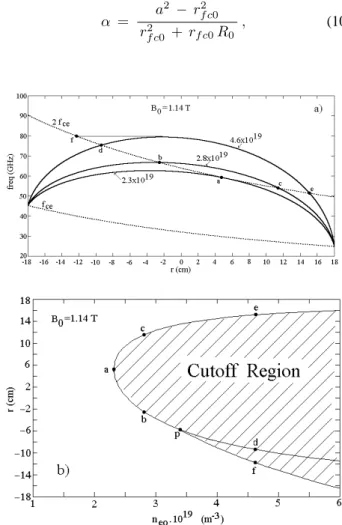
In Fig. 2.a are represented grafically ωce and2ωce, first
and the second ECE harmonics, and ωcRH, right-hand
cu-toff, for different values of electron density. The density profile, used in this figure, is given by Equation 1 and the toroidal magnetic field was B0 = 1.14T. The first cu-toff occurs when the right-hand cucu-toff curve touches the se-cond ECE harmonic curve. This happens at the point a for an electron density ofne0 = 2.3×10¹⁹m−3 ( at position r= 5.2cm).
In Fig 2.b, the cutoff region is presented in a radius ver-sus density curve. The hachured part of this figure corres-ponds to the region where ECE cutoff occurs in the TCABR tokamak. As the electron density increases, a larger part of the second harmonic band becomes inacessible. When the cutoff frequency equals the ECE frequency at the same lo-cation, the emission in locally cutoff ( see for example the points a,b,cande in Fig. 2). On other hand, if ωcRH is
larger than the emission frequency, the cutoff frequency oc-curs non-locally. Note that the emission from the pointd to f is not accessible for the density equal to 4.6×10¹⁹m−3, when the antenna is located in the low field side.
Substituting the Equation 7 into Equation 8, and consi-dering Equations 3, 4 and 1, we obtain a relation between the the peak density ne0,B0,αandrf c0,given by :
ne0 =
1.94×10¹⁹B0 ( 1 + rf c0
R0 )
2( 1− rf c0
a )α
. (9)
By this equation we see that the ECE radiation begins to be inaccessible for a radial position where dne0/drf c0 =
0. Taking the r derivative of Equation 9 and equalizing to zero we obtain :
α = a
2 − r2
f c0 r2
f c0 +rf c0R0
, (10)
Figure 2. a. First and second ECE harmonics (fceand2fce) and
the right-hand cutoff frequencies were obtained for three different values of the electron density and for a toroidal magnetic field
B0= 1.14T. The point a represents the position where the first
cutoff occurs ( for the density 2.3×10¹⁹m−3). The frequencies
between the points b−c( forne0 = 2.8×10 19
m−3) andd−e
( forne0 = 4.6×10 19
m−3) are not accessible ( non-local
cu-toff ). Also we can observe that the frequencies between the points
f−d( forne0 = 4.6×10 19
m−3) are not externally accessible. b. The hachured region represents the region that is not accessible
for the ECE X mode second harmonic radiation.
where rf c0 is the position at which the first cutoff occurs, for the situation when the density is rising. When the den-sity falls, the position where the last ECE signal reappears also gives the α parameter. From this relation we see that, known the value rf c0, the α parameter can be estimated.
In Fig. 3.a, the Equation 9 is plotted for different values of α. It is possible to that, the position of minimum density decreases with the increase of the value of α. In Fig. 3.b, the value of α is plotted as a function of the first/last cutoff position, obtained from Equation 10.
Figure 3. a. Central density as function of rf c0, obtained from Equation 9; b. The α parameter as function of the position rf c0, where
the first/last cutoff occurs.
1784 Brazilian Journal of Physics, vol. 34, no. 4B, December, 2004
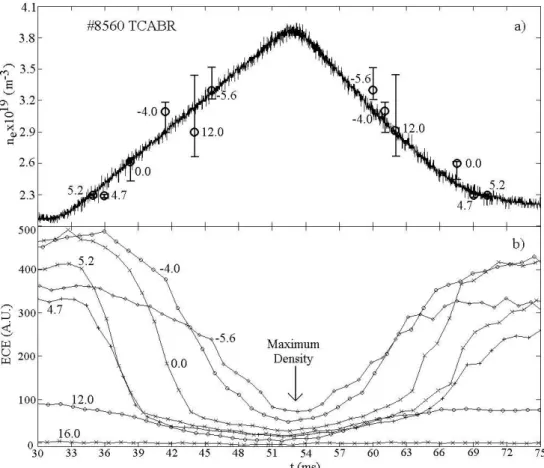
Figure 5. a. Electron peak density ( continuous curve ) and the electron density predicted by the ECE cutoffs ( open circles ); b. ECE radiation time profile during the right-hand cutoff for six different radial positions ( incm).
4
Experimental Results and
Conclu-sions
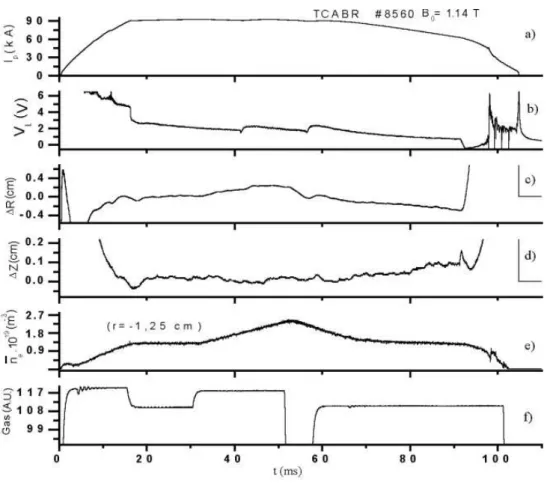
An external gas puffing injection system is usually used to control the electron density during the TCABR tokamak dis-charges. In Fig. 4, we present the following time profiles obtained from the thermal discharge 8560 : a. plasma cur-rent Ip; b. loop voltage VL; c. horizontal plasma position
∆R; d. vertical plasma position∆Z;; e. line electron den-sity at r = −1.25cm ne;; and f. gas puffing valve
con-trol signal Gas. For the discharge the plasma current was Ip ≈ 90kA ( at flat-top ) and the total discharge duration
was tp ≈ 100ms. In Figs. 4.e and 4.f is possible to
ob-serve that, from t ≈ 30ms to t ≈ 52ms, an increase of gas injection rate, externally imposed, causes a linear incre-ase of the density. From t≈52ms to t ≈60ms the gas injection valve is closed and a linear decrease in the den-sity is observed. From t ≈ 60ms up to the end of the discharge, the signal amplitude of the valve is adjusted to mantain the plasma density approximately constant. During the time interval of interest to our experiment ( from 30 to 80ms) there is no considerable changes in the plasma posi-tion ( horizontal or vertical ).
In Fig. 5 the peak electron density and ECE signal from t = 30ms to t = 75ms is shown. In this time inter-val, de density rises linearly from 2.1×10¹⁹m−3 (t ≈
32ms) to 3.8 ×10¹⁹m−3 (t ≈ 53ms). and after that, the electron density begins to decay reaching the value of ≈2.2×10¹⁹m−3(t≈75ms). In Fig. 5.b, the ECE tempo-ral profiles are presented for different positions in the plasma column. We observe that the emission from the positions r=rf c0 ≈5.2cm and 4.7cm are first/last cutoff. Using those values in Equation 10 we obtain, for the α parame-ter, values between 0.86 and 0.97. After that, the electron density continues to rise and consequently more ECE chan-nels are cutoff, one after another. The ECE radiation emitted from r= 16cm was not cutoff, even at the highest density used in this experiment. The intersection point between the straight line determined at the flat top of the ECE signal with the straight line of maximum slope was used to determine the cutoff points. The vertical error bars in Fig. 5.a were obtained from the radiometer IF bandwidth (≈ 2GHz). Also, in these calculations we have made the assumption that the electron density profile does not change during the rising/falling of the electron density.
radia-tion right-hand cutoff ( points in Fig. 5.a) we observe a good agreement between them.
As conclusion, the main use of the ECE diagnostic is the electron temperature measurement. However when we are at the cutoff region, the ECE detection can be extended as an independent method to infer the electron density pro-file. This technique requires only the frequency calibration of the ECE radiometer and is useful if the density profile can be parameterized with two free parameters.
Acknowledgements
This work was partially supported by the Fundac¸˜ao de Amparo `a Pesquisa do Estado de S˜ao Paulo ( FAPESP ).
References
[1] M. Bornatici, R. Cano, O. De Barbieri, and F. Engelman, Nu-clear Fusion, 23, 1153 (1983).
[2] J. Lohr, Rev. Sci. Instrum., 59, 1608 (1988).
[3] D. C. Reddy and T. Eddington, Rev. Sci. Instrum., 67, 462 (1996).
[4] R. P. da Silva, A. M. M. Fonseca, J. H. Vuolo, E. R. Calderon, R. M. O. Galv˜ao, Yu. K. Kuznetsov, J. C. Raffaelli, and the TCABR Team, “ECE Radiometry in the TCABR Tokamak” to be published in the Braz. J. of Phys. (2004).
[5] A. M. M. Fonseca, PhD. Thesis, Instituto de F´ısica USP, S˜ao Paulo (2004).
[6] J. I. Elizondo, D. Korneev, I. C. Nascimento, and W. P. de S´a, Braz. J. of Phys. 32, 123 (2002).