Copyright © 2013 IJECCE, All right reserved
Classification of High Spatial Resolution Image Using
Multi Circular Local Binary Pattern and Variance
D. Chakraborty
Scientist/Eng.– “SE” RRSC-East (NRSC, ISRO)Kolkata–700 156, India
V. M. Chowdhary
Scientist/Eng.– “SF”RRSC-East (NRSC) Kolkata–700 156, India
D. Dutta
General Manager RRSC-East (NRSC) Kolkata–700 156, IndiaJ. R. Sharma
Chief General Manager Regional Centres (NRSC) Hyderabad-500037, IndiaAbstract - High spatial resolution satellite image comprises of textured and non-textured regions. Hence classification of high spatial resolution satellite image either by pixel-based or texture-based classification technique does not yield good results. In this study, the Multi Circular Local Binary Pattern (MCLBP) Operator and variance (VAR) based algorithms are used together to transform the image for measuring the texture. The transformed image is segmented into textured and non-textured region using a threshold. Subsequently, the original image is extracted into textured and non-textured regions using this segmented image mask. Further, extracted textured region is classified using ISODATA classification algorithm considering MCLBP and VAR values of individual pixel of textured region and extracted non-textured region of the image is classified using ISODATA classification algorithm. In case of non-textured region MCLBP and VAR value of individual pixel is not considered for classification as significant textural variation is not found among different classes. Consequently the classified outputs of non-textured and textured region that are generated independently are merged together to get the final classified image. IKONOS 1m PAN images are classified using the proposed classification algorithm and found that the classification accuracy is more than 84%.
Keywords –Contrast, High Resolution Image, ISODATA, IKONOS, LBP Operator, Textural Classification.
I. I
NTRODUCTIONThe spatial resolution specifies the pixel size of satellite image covering the earth surface. Pixel whose spatial resolution ranges between 0.6 m to 4 m is considered as a high spatial resolution, where as pixels having spatial resolution 4 m to 30 m and 30 m to >100 m considered as medium and low spatial resolution respectively [21,22]. During recent period, more and more high spatial resolution remote sensing images are available for earth observations. These images represent the surface of the earth features in more detailed manner than medium and low spatial resolution images.
High spatial resolution imagery helps to acquire quality and detailed information about the features of the earth’s surface together with their geographical relationships. The internal variability within the homogeneous land cover units increases with the increase of spatial resolution. The increased variability decreases the statistical separability of land-cover classes in the spectral data space. This decreased separability tends to reduce the accuracies of pixel-based classification algorithms such as K-Means [5], Fuzzy C Means [1] and Minimum Distance classifiers [11]. These pixel based classification techniques assigns a pixel to a region according to the similarities of spectral
signature. It considers only one pixel at a time [20]. Spectral signatures are the specific combination of emitted, reflected or absorbed electromagnetic radiation (EM) at varying wavelengths which can uniquely identify an object [20].
The spectral resolution of high spatial resolution satellite images are relatively poor compared to Landsat TM sensors. Spectral resolution describes the ability of a sensor to define fine wavelength intervals. The finer the spectral resolution, the narrower the wavelength for a particular channel or band. Thus there is a trade-off between the spatial and spectral resolution. Particularly it is true for high spatial resolution panchromatic (PAN) images namely CARTOSAT-II 1m and IKONOS 1m. There is a need to take into account the spatial relations between pixel values, also known as ‘texture’ of the objects of the scene for classifying the high spatial resolution images due to much variation of spatial structure in these images. Thus number of texture-based classification technique namely GLCM (Gray Level Co-occurrence Matrix) [12, 3, 13, 4], Markov random field (MRF) model [18], Gray scale rotation invariant [19], Hölder exponent analysis [16] have been developed for classifying high spatial resolution images. However these techniques are found to be well applicable in textured region of high spatial resolution images. A region is said to be textured, where the intensity variation among neighborhood pixels is significant. A region is said to be non-textured, where the intensity variation among neighborhood pixels is insignificant. But texture-based classification techniques failed in non-textured region of high spatial resolution image as much variation is not found in the spatial pattern of those regions of the image [16].
Copyright © 2013 IJECCE, All right reserved Some more techniques namely watershed approach [14,
15], region-growing approach [2, 16], etc. are in use for classifying high spatial resolution remote sensing images. Application of these approaches for classification of images either leads to under-segmentation or over-segmentation [17]. Hence the present study is carried out with a specific objective of segmenting textured and non-textured region of high spatial resolution image and classify textured and non-textured region of high spatial resolution image individually. Multi Circular Local Binary Pattern (MCLBP) operator and Variance (VAR) based approach is used in the present study. The proposed approach is implemented on high spatial resolution IKONOS PAN image having spatial resolution 1 m.
II. M
ETHODOLOGYThe proposed approach for classifying the two dimensional high spatial resolution image P has three main steps: (i) transformation, (ii) thresholding and extraction and (iii) classification. In the first step each pixel of the image is transformed into degree of texture or non-texture around the pixel. Non-textured and textured areas are extracted from the original image in the second step. In the third step, these two textured regions are classified independently.
A. Image Transformation
The Multi Circular Local Binary Pattern (MCLBP) Operator and VAR are used to transform the image for measuring the texture. The MCLBP operator measures the spatial structure around each pixel of P. Besides spatial structure, contrast of the local image holds important property for measuring the texture around the pixel. Therefore VAR is used for measuring the contrast around the pixel.
Multi Circular Local Binary Pattern (MCLBP) operator for measuring spatial structure around each pixel of the image:
The Local Binary Pattern (LBP) Operator is based on a binary code describing the local texture pattern [9, 10 and 8]. This code is built by thresholding a local neighborhood by the grey value of its center. The eight neighbors are labeled using a binary code {0,1} obtained by comparing their values to the central pixel value. If the tested grey value is below the grey value of the central pixel, then it is labeled 0, otherwise it is assigned the value 1. The obtained value is then multiplied by the weights given to the corresponding pixels. The weight is given by the value 2i+1. Summing the obtained values gives the measure of the LBP Operator. Advantages of using LBP Operator in high spatial resolution images are that (i) it can be used as a tool to measure the spatial structure around each pixel of the image and (ii) it does not require any prior information about the pixel intensity, (iii) theoretically and computationally LBP Operator is simple.
In this study, a new LBP operator is proposed to measure the spatial structure around each pixel of P. It uses a series of circles (2D) centered on the pixel with incremental radius values for measuring the spatial structure and is named as Multi Circular Local Binary
Pattern Operator or MCLBP operator. The significance of using series of circles is that (i) the circular neighborhoods enable a definition of a rotation invariant texture and (ii) multiple circles facilitate to describe large neighborhoods with a relatively short feature vector than a circle to compute the spatial structure around the pixel. It measures rotation invariant texture for each circularly symmetric neighborhood and finally adds all measure to get the spatial structure around the pixel.
The spatial structure around each pixel of P is computed using MCLBP operator and is given as follows:
Initially, for each pixel (x,y) of P, a series of grey values { g0, g1, …………., gu-1}, { h0, h1, …………., hu-1} and { i0, i1, …………., iu-1} of u (where u=8) equally spaced intersected pixels on the perimeter of the circle of radius r =1, r =3 and r =5 are obtained as shown in figure 1. With the center pixel’s (i.e. (x,y) pixel’s) grey value gδ as the threshold, intersected pixels are labeled as 1 (where digital number of the intersected pixel is larger than that of the center) or 0 (where digital number of the intersected pixel is smaller than that of the center). Number of 1 to 0 or 0 to 1 transition ξ1 for the circle of radius r =1 is computed by using the equation 1.
u
ξ1 = ∑ |s(gk–gδ) - s(gk–1–gδ)| (1) k=1
Where,
u is the intersected pixels on the perimeter of the circle of radius r =1, gδis the grey values of the center pixel of the circle of radius r =1 and
1, z≥ 0 s(z) = {
0, z < 0
Similarly 1 to 0 or 0 to 1 transition ξ3 and ξ5for the circle of radius r =3 and r =5 are computed respectively. Finally the total transition ξCis obtained by using equation 2.
ξC=ξ1+ξ3+ξ5 (2)
The ξCis considered here as the MCLBP value of (x,y)
pixel i.e. MCLBP (x,y) = ξC. Thus for each pixel (x,y) of the original image P a MCLBP value ξCis obtained.
Copyright © 2013 IJECCE, All right reserved
VAR for measuring contrast around each pixel of the
image:
The variance of the neighbor of each pixel (x,y) over the whole image is computed to obtain the contrast or VAR value of (x,y). To achieve this initially for each pixel (x,y), a series of grey values { g0, g1, …., gu-1, h0, h1, …., hu-1, i0, i1, …., iu-1} as described earlier are acquired. Then the VAR (x,y) is obtained by using the equation 3.
N
VAR(x,y) = (∑(ai-µ)2)/N (3)
i = 1 Where,
{ a1, a2, ….,aN} = { g0, g1, …., gu-1, h0, h1, …., hu-1, i0, i1,
…., iu-1}, N = 3u, N
µ = (∑ai) / N i=1
Thus MCLBP (x,y) and VAR(x,y) for each (x,y) of the original image P are obtained. Subsequently, these values are used in the equation 4 to get the corresponding pixel value (x,y) in the transformed the image T. Each pixel (x,y) of T represents the degree of texture around that pixel.
T (x,y) = (MCLBP (x,y) + VAR(x,y)) / 2 (4)
B. Thresholding and extraction
A threshold is used to segment T into textured and non-textured regions. The pixel value in T below the threshold value is considered as non-textured region while greater than or equal to the threshold value is considered as textured region in the segmented image. Pixels identified as non-textured regions are marked as zero, whereas the pixels identified as textured regions are marked as one in the segmented image mask and represented as follows:
1, T (x,y) ≥σ
Γ(x,y) = { (5)
0, T (x,y) < σ
Where, T(x,y) and Γ(x,y) represents the pixel value in (x,y) position of the two dimensional transformed image and segmented image respectively and σ corresponds to threshold value. The σ is computed by using equation 6. σ = Tmin+ (Tmax - Tmin) / K (6) Where, Tmin and Tmax are minimum and maximum pixel grey value in T respectively and K is user defined value.
To find the optimum K, IKONOS PAN sensor image having spatial resolution of 1 m of image size 256 x 256 pixels are used (shown in fig 2a). Further, proposed classification approach is implemented on this image for different K values.
Subsequently, thesegmented image Γ is used to extract the textured and non-textured region from the original image P. The mathematical representation of this process is shown as follows:
P(x,y), Γ(x,y) = 0
R1(x,y) = { (7)
0,Γ(x,y) ≠0 P(x,y), Γ(x,y) = 1
R2(x,y) = { (8)
0,Γ(x,y) ≠1
Where, P, Γ, R1 and R2 represents original image, segmented image, extracted non-textured region from original image P and extracted textured region from original image P respectively. P, R1 and R2 satisfies the properties namely (i) R1and R2С P, (ii) P = R1Ụ R2and (iii) R1∩ R2 = Φ.
C. Classification
Initially, the transformed image is segmented into textured and non-textured region using a threshold. Subsequently using the segmented image mask the original image is extracted into textured and non-textured region and classified independently. The extracted textured region (R2) is classified using ISODATA classification algorithm considering MCLBP and VAR values of individual pixel of textured area. While extracted non-textured region (R1) of the image is classified using ISODATA classification algorithm. In case of non-textured region MCLBP and VAR value of individual pixel is not considered for classification as significant texture variation is not found among classes. Subsequently, the classified outputs of non-textured and textured region are generated independently and are merged together to get the final classified image.
The ISODATA algorithm includes three key steps. Firstly, assigning some arbitrary clustering centers in the image. Secondly, classifying each pixel to the nearest cluster. Lastly, calculating all the new cluster centers on the basis of every pixel in one cluster set. Step 2 and step 3 are iterative and iterative process continues till the change between two iterations is negligible. During iteration, the ISODATA clustering algorithm may have refinement by splitting or merging clusters. Clusters are merged if either the number of members (pixel) in a cluster is less than a certain threshold or if the centers of two clusters are closer than a certain threshold. Clusters are split into two different clusters if the cluster standard deviation exceeds a predefined value and the number of members (pixels) is twice the threshold for the minimum number of members [6, 7]. ISODATA clustering algorithm has many benefits such as less computing, simplicity and unsupervising.
To show the robustness of the proposed classification method GLCM (Gray Level Co-occurrence Matrix) is used in this study. This is done by applying the ISODATA on the transformed images obtained from GLCM analysis and comparing the results of“GLCM and ISODATA” and “Proposed classification method”. The GLCM analysis [TEX module of Geomatica 10.1 image processing software] is carried out by considering the five of Haralick texture parameters e.g. entropy, dissimilarity, contrast, homogeneity and the correlation and five filter parameters: filter X size 5, filter Y size 5, number of gray levels 32, spatial relationship (Px) 1 and spatial relationship (Ln) 0.
III. R
ESULT ANDD
ISCUSSIONCopyright © 2013 IJECCE, All right reserved having spatial resolution 1 m for different K values: values
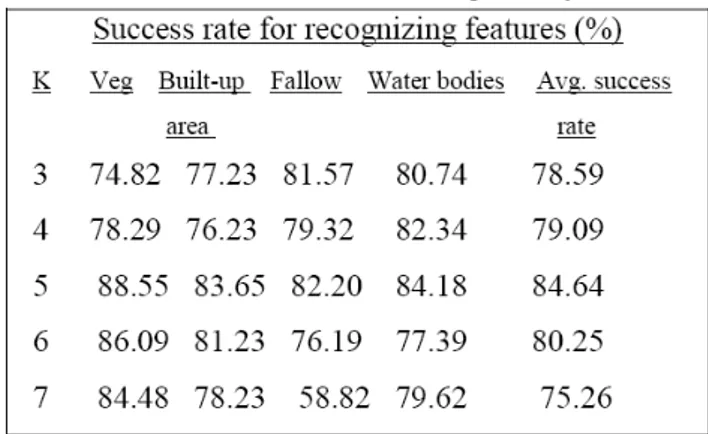
between 3 to 7. Classification rate is also assessed for these different K values using the ground truth data. The area statistics of the classification rates of different classes for each K is shown in Table 1. The numerical results shows that for K=3 and K=4, the success rates for recognizing texture regions namely vegetation and built-up area are less than non-texture region namely fallow and water bodies. This may be due to part of textured region is represented as a non-textured region. Whereas, for K=6 and K=7, the success rate for recognizing non-textured regions are less than textured region. This can be attributed that part of non-textured region is represented as a textured region. But for K=5 the success rate for recognizing textured and non-textured regions are mostly same and average success rates for K=5 is 85% where as for K=3, K=4, K=6 and K=7 are 79%,79%,80% and 75% respectively. Hence the optimum value of K is considered as 5.
Table1: Success rate for classifying the features for K=3, K=4, K=5, K=6 and K=7 respectively
The “GLCM and ISODATA” and “Proposed classification method” have been applied on two different 1 m PAN (IKONOS) images (size 256x256 pixels) of (i) vegetation, (ii) built-up area, (iii) water bodies, and (iv) fallow (shown in Figure 2a and 2d). Texture is visible in both the images. The results of proposed method is then compared with the results obtained from the analysis based on “GLCM and ISODATA” respectively.
The “GLCM and ISODATA” and “Proposed classification method” are applied on (i) first IKONOS image are shown in figure 2b and 2c, (ii) second IKONOS image are shown in Figure 2e and 2f respectively. Classified images identify different features namely vegetation, built-up area, water bodies and fallow respectively is presented in figure 2b, 2c, 2e and 2f. From the results, it is clearly seen that the “GLCM and ISODATA” gives heterogeneous segments, while “Proposed classification method” gives more homogeneous segments with distinct classes than “GLCM and ISODATA”.
The GPS equipment is used to collect the ground truth data for the class vegetation, built-up area, water bodies and fallow respectively. The collected ground truth data is converted into vector data using ArcGIS software. Ground truth data is overlaid on the satellite images as shown in
figure 2a and 2d to view the ground truth data on the satellite images.
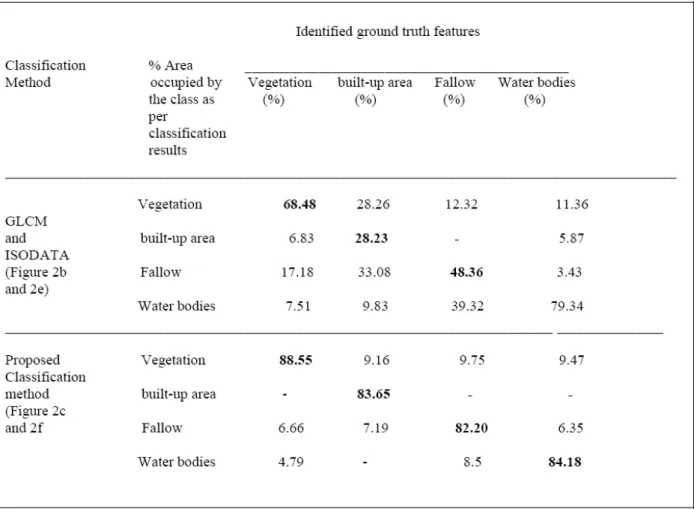
Using the ground truth data overlaid separately on the resultant outputs obtained from “GLCM and ISODATA” and “Proposed classification method”,the area statistics of the classification rates obtains for each approach is shown in Table 2. The numerical results shows that the success rate for recognizing vegetation, built-up area, fallow and Water bodies are (68%, 28%, 48% and 79%) by “GLCM and ISODATA” whereas (89%, 84%, 82% and 84% ) by the“Proposed classification method”.
The classified output with respect to the two input images (figure 2a and 2d) shows that the “GLCM and ISODATA” under segment (i) fallow mixed with water bodies shown in figure 2e, (ii) built-up area mixed with fallow and vegetation shown in figure 2b, (iii) vegetation mixed with water bodies shown in figure 2b and 2e, (iv) fallow mixed with built-up area shown in figure 2b. This discrepancy decreases the success rate of recognizing vegetation, fallow, water bodies and built-up area as shown in Table 2. But the Proposed classification method mostly overcomes these discrepancies.
The texture pattern of water bodies and fallow areas does not show much difference, as it is visible in figure 2d. “GLCM and ISODATA” classify these areas as a single class (figure 2e). Thus, proposed technique first partitioned the image into textured and non-textured regions based on the degree of texture around each pixel of the image and then classify textured and non-textured region independently. As a result the proposed technique distinguishes among the non-textured regions e.g. fallow and water bodies as well as among textured regions like built-up area and vegetation (figure 2f and 2c).
IV. C
ONCLUSIONIn the present study, MCLBP operator is proposed to compute the spatial structure of local image texture. The Variance is used to measure the contrast around the pixel. Subsequently MCLBP Operator and VAR are used together to transform the image for measuring the texture. A threshold σ is applied to extract non-textured and textured region from the image. Pixel-based classification technique ISODATA is used on non-textured region to classify that region. Whereas, computed MCLBP and VAR value of each pixel of textured regions are used as inputs in ISODATA to classify that region. From the results of the study, it is found that the proposed method is useful to classify complex images containing both textured and non-textured regions. Moreover, it can be considered as an intuitively appealing and unsupervised classification algorithm. As a result the method is potentially useful to classify high spatial resolution panchromatic images more efficiently.
A
CKNOWLEDGEMENTCopyright © 2013 IJECCE, All right reserved
Figure 2a-f: (a) IKONOS image showing vegetation, built-up area, fallow and water bodies categories (b) Classifiedimage obtained by applying “GLCM and ISODATA”on (a),
(c) Classified image obtained by applying“proposed classification method” on (a), (d) IKONOS image showing fallow, water bodies, vegetation and built-up area categories (e) Classifiedimage obtained by applying “GLCM and ISODATA” on (d)
Copyright © 2013 IJECCE, All right reserved
Table 2: The comparative success rate for classifying the features obtained by applying“GLCM and ISODATA”and “Proposed classification method” separately on IKONOS image.
R
EFERENCES[1] J. C. Bezdek, R.Ehrlich, W. Full, “FCM: the Fuzzy c-Means clustering algorithm,” Computers and Geosciences, vol. 10, pp. 191-203, 1984.
[2] A. P. Carleer, O. Debeir, E. Wolff,“Assessment of Very High Spatial Resolution Satellite Image Segmentations,” Photogrammetric Engineering & Remote Sensing, vo. 71, no. 11, pp. 1285–1294, 2005.
[3] D. A. Clausi, B. Yue,“Texture Segmentation Comparison Using Grey Level Co-occurrence Probabilities and Markov Random Fields,” Proceedings of the 17th International Conference on Pattern Recognition (ICPR’04), 2004, Available at: http://ieeexplore.ieee.org/stamp/.
[4] R.M. Haralick, K. Shanmugan, I. Dinstein,“Textural features for image classification,”IEEE Transactions on systems, Man, and cybernetics, SMC-3, vol. 6, pp. 610-621, 1973.
[5] J. A. Hartigan, M. A. Wong,“A K-means clustering algorithm,” Appl. Stat, vol. 28, no. 1, pp. 100–108, 1979.
[6] A. K. Jain, M. N. Murty, P. J. Flynn,“Data clustering: a review, ACM Computing Surveys,”vol. 31, no. 3, pp. 264-323, 1999. [7] A. Kohei, B. XianQiang,“ ISODATA clustering with parameter
(threshold for merge and split) estimation based on GA: Genetic Algorithm,” Report Faculty Science Engineering, Saga University, vol. 36, no.1, pp. 17-23 2007 ( available at
http://dlwww.dl.saga-u.ac.jp/contents/mgzn/ZR00005459/ZR00005459.pdf). [8] A. Lucieer, A. Stein, P. Fisher,“Texture-based segmentation of
high-resolution remotely sensed imagery for identification of fuzzy objects,”International Journal of Remote Sensing, vol. 26 no. 14, pp. 2917-2936, 2005.
[9] T.P.M. Ojala, D. Harwood,“A comparative study of texture measures with classification based on featured distribution,” Pattern Recognition, vol. 29, no. 1, pp. 51-59, 1996.
[10] T. Ojala, M. Pietikäinen, T. Mäenpää,“Multiresolution gray -scale and rotation invariant texture classification with local binary patterns,” IEEE Transactions on Pattern Analysis and Machine Intelligence, vol. 24, pp. 971-987, 2002.
[11] J. A. Richards, “RemoteSensing Digital Image Analysis: An Introduction,”Springer-Verlag, pp. 265-290, 1995.
[12] F. Tsai, M. J. Chou, “Texture Augmented Analysis of High Resolution Satellite Imagery In Detecting Invasive Plant Species,”Journal of the Chinese Institute of Engineers, vol. 29, no. 4, pp. 581-592, 2006.
[13] F. Tsai, M. J. Chou, H. H. Wang, “Texture Analysis of High Resolution Satellite Imagery for Mapping Invasive Plants,” IEEE International Geoscience and Remote Sensing Symposium Proceedings, vol. 4, pp. 3024- 3027, 2005.
[14] Z. Wang, S. Zhao, X. Chen, “Watershed Segmentation of High -Resolution Remotely Sensed Data”, Proceedings of International Symposium on Remote Sensing & 20th Anniversary of the Korean Society of Remote Sensing, pp. 107-109, 2004. [15] B. Mathivanan, S. Selvarajan, “High spatial resolution remote
sensing image segmentation using marker based watershed algorithm,” J. Acad. Indus. Res, vol. 1, no. 5, pp. 257-260, 2012.
[16] D. Chakraborty, G. Sen, S. Hazra, “High-resolution satellite image segmentation using H¨older exponents,” Journal of Earth System Science, vol. 118, no. 5, pp. 609-617 2009.
[17] A. Lefebvre, T. Corpetti, L.H. Moy, “Segmentation of very high spatial resolution panchromatic images based on wavelets and evidence theory”,Proc. SPIE 7830, Image and Signal Processing for Remote Sensing, vol. 16, 2010,
Copyright © 2013 IJECCE, All right reserved [19] A. Lucieer, A. Stein, P. Fisher, “Multivariate texture-based
segmentation of remotely sensed imagery for extraction of objects and their uncertainty”, International Journal of Remote Sensing, vol. 26, no. 14, pp. 2917–2936, 2005,
[20] Book: D. Chakraborty, G.K. Sen, S. Hazra, “Image segmentation Techniques", LAP LAMBERT Academic Publishing, ISBN 978-3-8473-1137-9, 2012.
[21] Q. Weng, “Remote sensing of impervious surfaces in the urban
areas: Requirements, methods, and trends,” Remote Sensing of
Environment, vol. 117, pp. 34-49, 2012.
[22] V. V. Klemas, “Remote Sensing of Coastal Resources and Environment,” Environmental Research, Engineering and Management, vol. 2, no. 48, pp. 11-18, 2009.
AUTHORS
PROFILE
Dr. D. Chakraborty
received Master degree in Mathematics from HP University, Himachal Pradesh and obtained Ph.D in Image Segmentation from Jadavpur University, Kolkata. He is currently working as Scientist and System Manager of RRSC-East (NRSC, ISRO), Kolkata. His research interests include Satellite Image Processing, with particular focus on texture analysis.
Email:deba.isro@gmail.com
Dr. V. M. Chowdary
received M.Tech. degree in Irrigation and Drainage from G.B. Pant University of Agriculture & Technology and obtained Ph.D. from Indian Agricultural Research Institute, New Delhi. He is currently working as Scientist and Head (Applications) of RRSC-East (NRSC, ISRO). His research interests are application of geospatial technologies for water resource management.
Dr. D. Dutta
received M.Sc. degree in Agricultural Sciences from B.C.K.V, West Bengal and obtained Ph.D. from Indian Agricultural Research Institute, New Delhi. He is currently working as General Manager of RRSC-East (NRSC, ISRO), Kolkata.
Dr. J.R. Sharma