Novel Approach for Classification of Bowel Tumor Detection in
Small Intestine
N Sudha
1, S Finney Daniel Shadrach
2, N Sathishkumar
3123
Assistant Professor, KPR Institute of Engineering and Technology, Coimbatore
Abstract
Wireless Capsule endoscopy (WCE) allows a physician to examine the entire small intestine. Capsule endoscopy helps physicians to view small intestine’s internal structure- an area that isn’t easily reached with conventional endoscopy in a more distinct way. The most crucial problem with this technology is that too many images produced by WCE causes a tough task to physicians, so it is very significant if we can help physicians do diagnosis using computerized methods. In this paper, a new method aimed for small bowel tumor detection of WCE images is proposed. This new approach mainly focuses on texture feature, a powerful clue used by physicians, to detect tumor images with Supervisedclassification. Analysis is also done using Principle Component Analysis (PCA) based Local Binary Pattern (LBP) and Unsupervised classification to discriminate tumor regions from normal regions. Simulation results show an efficiency of around 99% using Supervised Classification.
Index Terms
– Endoscopy, Principle Component Analysis, Local Binary Pattern, Unsupervised classification, Supervised Classification, Bowel TumorI.
INTRODUCTION
In recent years bowel tumor is a major issue in grasping the attention of medical and scientific ranges because of its high prevalence related with the difficult treatment. Bowel cancer is a malignant growth found most commonly in the lining of the large bowel and develops from tiny growths called polyps. It is the third common cancer in the world with nearly 1.8 million new cases in 2013. Approximately 95% of colorectal cancers are adenocarcinomas. Statistics shows that this will rise up to 2.44 million by 2035. As most bowel cancers starts as polyps, all polyps should be removed to reduce the risk of developing the disease as explained in [1]. Even if a polyp develops into cancer, when detected in its early stage, it can be cured by surgery. Hence we go for wireless capsule endoscopy, in order to examine the small intestine in a more reliable and detailed manner.
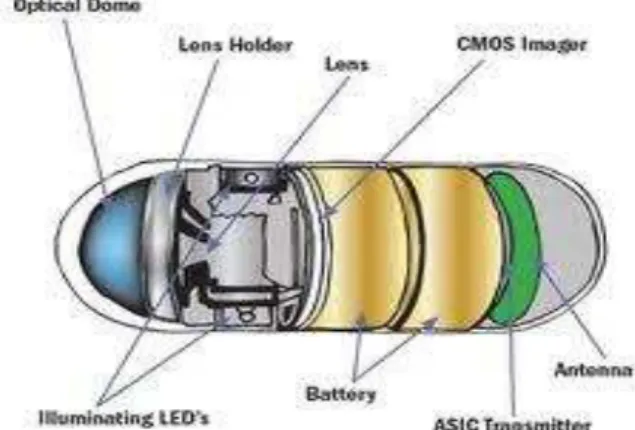
Capsule endoscopy is a procedure that uses a tiny wireless camera to take pictures of the digestive tract. This technique involves swallowing a small (size of a large vitamin pill) capsule, which is of 11 mm diameter and a length of 26 mm. The capsule consists of a complementary metal oxide silicone imager(color camera chip), lens, light source( white LEDs), transmitter, two batteries. Once swallowed the camera moves naturally through the digestive tract and takes nearly two pictures per second for 8 hours, transmitting those images to a data
recorder about the size of a portable CD player that patients wear around waists. Finally the images from the recorder are downloaded into a computer workstation and viewed by the physicians to analyze the potential sources of different diseases in GI tract. Capsule is disposable and will be passed naturally in the bowel movement. Capsule endoscopy helps physicians to view small intestine’s internal structure- an area that isn’t easily reached with conventional endoscopy in a more distinct way.
Fig 1:Structure of a Endoscopic Capsule.
On an average nearly 50,000 images are taken during 8 hours of overall scenario. The process of examining all those images is normally tiring and time consuming. Hence we go for computerized approaches in order to
support physicians, which leads to reduction in processing time. This new technology explores great value in evaluating the disease in the digestive tract such as Crohn’s disease, ulcer, gastrointestinal bleeding and so on [2]. Further improvements are needed for CE, although the new technology has tremendous advantages over traditional examination techniques.
Some researchers have begun studies towards the direction of maximizing the automatic inspection of CE images so as to shrink physician’s burden. Using a synergistic methodology that combines several methods such as image registration, segmentation, region synthesis, local-global(L-G) graphs and neural nets into a unique, new, non-conventional methodology capable for automatically and accurately detecting, extracting and recognizing abnormalities in WCE images was formulated [3] [4] [5]. Then by using chromaticity moments, WCE images are analyzed [6] and experimental results shows a satisfying performance of detection. An interesting way of selecting MPEG-7 visual descriptors as the feature extractor to perform detection of several GI diseases was advanced in [7]. A kernel based classification method using SVM classifier proposed in [8] gives about 94% accuracy in WCE image classification. Our method is inspired by the following research: an approach for color texture classification by usage of haralick features
from co-occurrence matrices computed from local binary pattern [9], data dimension reduction [10] and contourlet-based feature extraction [11].
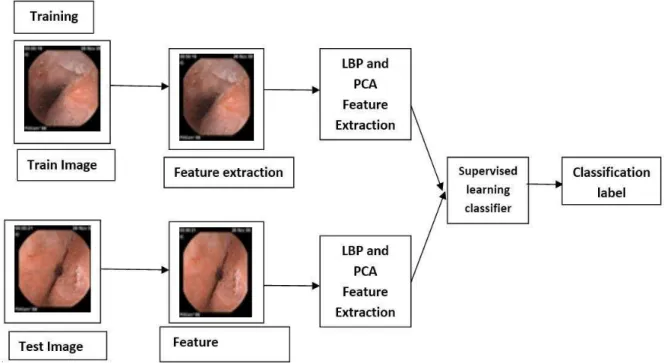
In this paper, a new method based on feature extraction of LBP and PCA which aims at dimensionality reduction and supervised learning classifier is proposed. Experimental results on our present data sets shows that this method achieves a superior performance of feature extraction and classification over existing methods.
The rest of the paper is organized as follows: Section II provides information about texture analysis. Section III and IV provides information about PCA and LBP respectively. Section V describes the proposed classification method and its comparative experiment simulation results. Conclusion and future work is discussed in Section VI and VII respectively.
II.
TEXTURE ANALYSIS
A theme in the development of computer vision field has been to duplicate the abilities of human vision by electronically perceiving and understanding an image. Sub-domains of computer vision include object recognition, scene recognition, motion estimation, and image restoration Image Texture gives us information about the spatial arrangement of color or intensities in an image or selected region of an image.
III.
PRINCIPAL COMPONENT
ANALYSIS (PCA)
Principal component analysis (PCA) is a statistical procedure that uses orthogonal transformation to convert a set of observations of possibly correlated variables into a set of values of linearly uncorrelated variables called principal components. The number of principal components is less than or equal to the number of original variables. This transformation is defined in such a way that the first principal component has the largest possible variance (that is, accounts for as much of the variability in the data as possible), and each succeeding component in turn has the highest variance possible under the constraint that it is orthogonal to (i.e., uncorrelated with) the preceding components. Principal components are guaranteed to be independent if the data set is jointly normally distributed. PCA is sensitive to the relative scaling of the original variables
PCA is the simplest of the true eigenvector-based multivariate analyses. Often, its operation can be thought of as revealing the internal structure of the data in a way that best explains the variance in the data. If a multivariate dataset is visualised as a set of coordinates in a high-dimensional data space (1 axis per variable), PCA can supply the user with a lower-dimensional picture, a projection or "shadow" of this object when viewed from its (in some sense; see below) most informative viewpoint. This is done by using only the first few principal components so that the dimensionality of the transformed data is reduced.
PCA is closely related to factor analysis. Factor analysis typically incorporates more domain specific assumptions about the underlying structure and solves eigenvectors of a slightly different matrix. PCA is also related to canonical correlation analysis (CCA). CCA defines coordinate systems that optimally describe the cross-covariance between two datasets while PCA defines a new orthogonal coordinate system that optimally describes variance in a single dataset.
IV.
Local binary patterns (LBP)
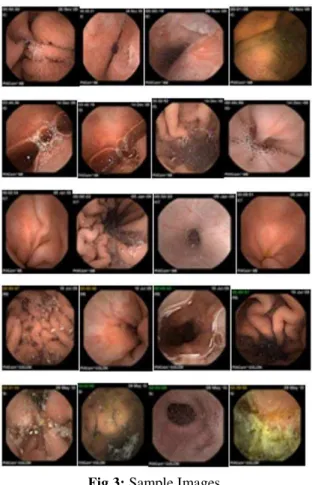
Local binarypatterns (LBP) is a type of feature used for classification in computer vision. LBP is the particular case of the Texture Spectrum model proposed in 1990. LBP was first described in 1994. It has since been found to be a powerful feature for texture classification; it has further been determined that when LBP is combined with the Histogram of oriented gradients (HOG) classifier, it improves the detection performance considerably on some datasets.Fig 3: Sample Images
V.
SIMULATION RESULTS
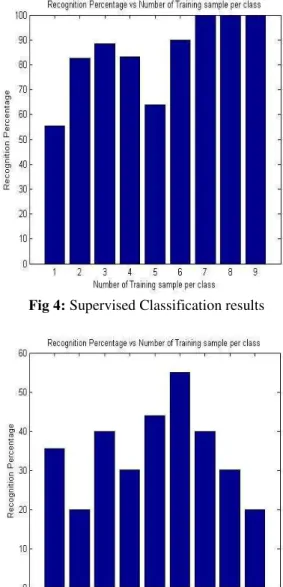
Fig 4: Supervised Classification results
Fig 5: Unsupervised Classification results
Fig 6: PCA Classification results
VI.
CONCLUSION
In this paper, a novel approach of Bowel tumor detection in small intestine using Supervised learning technique is proposed. A database of Bowel tumor images of around 50 with both affected and unaffected classes is considered for analysis from VGM hospital, Coimbatore. Simulation is carried out in groups of 5classes. Simulation resultsshows an efficiency of around 52.33% using PCA. Using both Supervised and Unsupervised classification techniques a result of around 99% and 55% is obtained respectively.
VII.
FUTURE WORK
The analysis can be further enhanced by considering more datasets as well as by considering various parameters such as age, other diseases etc.
VIII.
ACKNOWLEDGEMENT
Thanks for VGM Hospital, Coimbatore for providing us the dataset needed for this project. Also special thanks to Dr. N. Santhiyakumari , Professor, Head of ECE, KIOT, Salem for providing valuable suggestions.
REFERENCES
[1] Sae Hwang, M. EmreCelebi “Polyp detection in Wireless Capsule Endoscopy videos based on image segmentation and geometric feature” ICASSP 2010: 678-681 [2] Bourbakis, N. “Detecting abnormal patterns
in WCE images” Bioinformatics and Bioengineering, 2005. BIBE2005. Fifth IEEE Symposium -21 Oct. 2005 Page(s):232 – 238.
[3] Karargyris, A “Detection of Small Bowel Polyps and Ulcers in Wireless Capsule Endoscopy Videos” Biomedical Engineering, IEEE Transactions on (Volume:58 Issue: 10) Oct. 2011.
[4] V. S. Kodogiannis, M. Boulougoura, J. N. Lygouras, I. Petrounias “A neuro-fuzzy-based system for detecting abnormal patterns in wireless-capsule endoscopic images” Journal neruocomputing archive Volume 70 Issue 4-6, January,2007
[5] GuolanLv, Shanghai Jiao, Shanghai “Bleeding detection in wireless capsule endoscopy images based on color invariants and spatial pyramids using support vector machines” Engineering in Medicine and Biology Society,EMBC, 2011 Annual International Conference of the IEEE 30 2011-Sept. 3 2011
of Computer Applications (0975 – 8887) Volume 15– No.4, February 2011
[7] V. S. Kodogiannis, M. Boulougourab, E. Wadge and J.N. Lygourasc,“The usage of soft-computing methodologies in interpreting capsuleendoscopy,” Engineering Applications of Artificial Intelligence, vol.20, pp. 539–553, 2007. [8] G. Idden, G. Meron, A. Glukhovsky and P.
Swain, “Wireless capsuleendoscopy,” Nature, pp.415-417, 2000.
[9] M. Pennazio, “Capsule endoscopy: Where are we after 6 years ofclinical use?,” Digestive and Liver Disease, vol. 38, pp. 867–878,2006.
[10] D. Maroulis, D. Iakovidis, A. Karkanis and D. Karras, “CoLD: aversatile detection system for colorectal lesions in endoscopy video-frames,” Computer Methods and Programs in Biomedicine, vol. 70,pp. 151-166, 2003.