Bagging Support Vector Machines for Leukemia Classification
Gokmen Zararsiz1, Ferhan Elmali1, Ahmet Ozturk1 1 Erciyes University, Faculty of Medicine, Department of
Biostatistics and Medical Informatics Kayseri, 38039, Turkey
Abstract
Leukemia is one of the most common cancer type, and its diagnosis and classification is becoming increasingly complex and important. Here, we used a gene expression dataset and adapted bagging support vector machines (bSVM) for leukemia classification. bSVM trains each SVM seperately using bootstrap technique, then aggregates the performances of each SVM by majority voting. bSVM showed accuracy between 87.5% - 92.5%, area under ROC curve between 98.0% - 99.2%, F-measure between 90.5% - 92.7% and outperformed single SVM and other classification methods. We also compared our results with other study results which used the same dataset for leukemia classification. Experimental results revealed that bSVM showed the best performance and can be used as a biomarker for the diagnose of leukemia disease.
Keywords: Bagging, Leukemia diagnosis, Microarray, Support vector machines.
1. Introduction
Leukemia is one of the most common cancer type, and its early diagnosis and classification is becoming increasingly complex and important. To control the disease and get the chance of curing depends on the earlier time of treatment. Also, it is very crucial to diagnose leukemia as early as possible before the spread of cancer cells to internal organs. Cytomorphology, multiparameter immunophenotyping, cytogenetics, fluorescence in situ hybridization and polymerase chain reaction-based assays are the current classification schemes to discriminate leukemia subtypes [1, 2].
The development of microarray technology provides easily monitoring thousands of gene expressions simultaneously and the gene expression data obtained from this technology is valuable for cancer classification [3]. Microarray technology is also used in a number of studies for the diagnosis of leukemia disease [2, 4, 5].
Also, researchers have used machine learning techniques to gene expression datasets for the diagnosis of diseases [4, 6, 7, 8]. However, there have been lots of methods proposed to solve this problem and using the optimal
classification technique is crucial for accurate classification of gene expression data [9].
In this paper, we adapted bagging idea to support vector machines for the classification of leukemia disease and compared our results with other methods and other study results. The paper is organized as following: section 2 address the background of SVM, bagging SVM and the dataset used in this study. Results are given in section 3 and the paper concludes in section 4.
2. Methods
2.1 Support Vector Machines
SVM’s, proposed by Vapnik [10], are popular pattern recognition tools and were used in many fields such as bioinformatics, cancer diagnosis, image classification,text mining and feature selection [11]. SVM’s popularity is coming from its strong mathematical foundation which is based on statistical learning theory and structural risk minimization, its capacity to high dimensional datasets, its effective handling to nonlinear classification using kernel functions and its accurate performance [12]. For classification problems, an SVM constructs a hyperplane or set of hyperplanes in a high dimensional space and the key idea of the SVM is to maximize the margin by dividing the input space into two parts while minimizing the total classification errors.
For a given training data = {( , )} ∈ ℝ × {−1, +1} the aim of the classification is to find a function ( ( ) = ) that correctly classifies the patterns of the training data correctly, where is a n-dimensional vector and is its label. The hyperplanes can be defined as 〈 . 〉 + = 0 ; ∈ ℝ , ∈ ℝ and the data is then linearly seperable, if such a hyperplane exists (Fig. 1). Hyperplane margins (‖ ‖ ) must be maximized to find the optimal hyperplane and Lagrange multipliers ( ) are used to solve this problem [13]. The decision function can
be formulated as ( ) = ∑ 〈 . 〉 + .
IJCSI International Journal of Computer Science Issues, Vol. 9, Issue 6, No 1, November 2012 ISSN (Online): 1694-0814
www.IJCSI.org 355
SVM can also solve nonlinear classification problems with mapping the input vectors to a higher dimensional space using kernel functions , = 〈∅( ). ∅ 〉 [14]. Then, the decision function can be written as
( ) = ∑ ( , ) + . There are four commonly used kernel functions: linear, polynomial, radial basis function (RBF) and sigmoid:
1. Linear: , = .
2. Polynomial: , = . + 1
3. RBF: , = − − ⁄2
4. Sigmoid: , = ℎ . −
Fig. 1: (a) Classification by SVM’s, (b) Solving nonlinear classification problems using kernel functions [15]
For multi-class problems, binary SVMs are combined in either one-against-one or one-against-all scheme [16] and details can be found in [17].
2.2 Bagging Support Vector Machines
Bagging SVM (bSVM), or bootstrap aggregating SVM, is an ensemble bootstrap method which incorporates the
benefits of bootstrap and aggregating techniques by creating individuals for its ensemble by training each SVM classifier on a random subset of the training set.
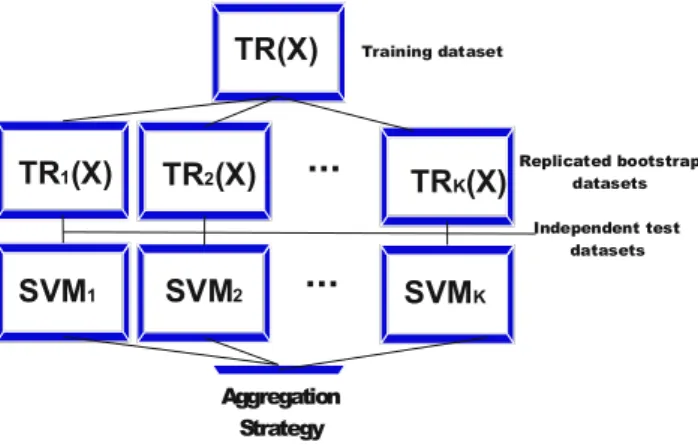
For a given dataset TR(X), K replicated training datasets are first randomly generated by bootstrapping technique with replacement. Next, SVM is applied for each bootstrap datasets. Finally, the estimation of bSVM is obtained by aggregating independently trained SVM’s in an appropriate aggregation technique. The general architecture of bSVM is shown in (Fig. 1).
In this study, we used majority voting aggregation technique due to its simplicity and popularity. Majority voting selects the class label that achieves the highest number of vote from each SVM models. Least squares estimation (LSE) based weighting and the double-layer hierarchical combining techniques are the other mostly used aggregation techniques for this purpose [18].
TR(X)
TR (X)
1TR (X)
2TR (X)
KSVM
1SVM
2SVM
K...
...
Aggregation Strategy
Training dataset
Replicated bootstrap datasets
Independent test datasets
Fig. 2: A general architecture of bagging SVM’s
2.3 Experimental Dataset
We used Golub's leukemia dataset [4] for experimental evaluation. This dataset contains bone marrow samples of acute leukemia patients in diagnosis: 19 B-lineage acute lymphoblastic leukemia (ALL), 8 T-lineage ALL samples; and 11 acute myeloid leukemia (AML) samples. Using signal-to-noise ratio, genes were ranked and top 999 genes were selected using Slonim's permutation test (3) at 0.05 significance level. For dimension reduction, we performed Independent Component Analysis (ICA) [19] and selected 37 components, which explain the 99.6% of the total variance. Finally, we obtained a 38x37 matrix for classification.
3. Results
We applied bSVM to leukemia dataset using most common kernel functions: linear, polynomial, RBF and IJCSI International Journal of Computer Science Issues, Vol. 9, Issue 6, No 1, November 2012
ISSN (Online): 1694-0814
www.IJCSI.org 356
sigmoid. For comparison, we applied SVM to dataset using same functions, but without bagging. We also compared our results with several classification methods. For all classification models, we performed 5-fold cross validation technique, and calculated several performance measures. Moreover, we tested bSVM’s efficacy by comparing with the results of other studies. Results are given in Table 1.
bSVM performed a 90.0% accuracy for linear function, 87.5% accuracy for polynomial function, 92.5% accuracy for radial basis function and 90.0% accuracy for sigmoid function. bSVM outperformed single SVM methods, only equally performed for the polynomial function. Also with a 92.5% accuracy, bSVM outperformed other classification methods and the methods used in other studies.
Table 1: Classification results of Leukemia dataset
Method AR(%) AUC(%) FM(%)
Bagging SVM
Linear 90.0 98.6 90.5
Polynomial 87.5 98.0 86.5
RBF 92.5 98.0 92.7
Sigmoid 90.0 99.2 90.5
Single SVM
Linear 87.5 98.8 87.8
Polynomial 87.5 98.0 86.5
RBF 87.5 98.0 87.8
Sigmoid 87.5 98.8 87.8
Other Classification Methods
Random Forest 87.1 97.7 90.0
C&RT 82.1 88.0 87.2
C4.5 78.9 87.8 83.3
k-Nearest Neighbor 86.8 97.9 87.8
Naive Bayes 84.6 96.2 86.5
Other Studies
Zhenyu Wang - NF [20] 91.5 - -
A.C. Tan&D. Gilbert - Single C4.5
[21] 91.2 - -
A.C. Tan&D. Gilbert - Bagging C4.5
[21] 91.2 - -
A.C. Tan&D. Gilbert - Adaboost C4.5
[21] 91.2 - -
AR: Accuracy Rate, AUC: Area Under Curve, FM: F-measure.
Also, the results of Area Under Curve (AUC) and F measure (FM) were similar. Sigmoid kernel bSVM with a 99.2% AUC and RBF kernel bSVM with a 92.7% FM showed the highest performances.
3. Conclusions
In this study, we adapted bagging idea to support vector machines and proposed bSVM for the classification of leukemia disease. bSVM trains each SVM seperately using
bootstrap technique, then aggregates the performances of each SVM by an aggregation strategy, such as majority voting.
Results, obtained from Golub’s leukemia dataset revealed that bSVM outperforms single SVM and other classification methods and can be used as a biomarker for the classification of leukemia disease.
References
[1] R.J. Olsen, C.C. Chang, J.L. Herrick, et al. “Acute Leukemia Immunohistochemistry - A Systematic Diagnostic Approach”, Arch Pathol Lab Med, Vol. 132, 2008, pp. 462-475.
[2] A. Kohlmann, C. Schoch, Martin Dugas, et al. “Pattern Robustness of Diagnostic Gene Expression Signatures in Leukemia”, Genes, Chromosomes & Cancer, Vol. 42, 2005, pp. 299-307.
[3] C. Ray, “Cancer Identification and Gene Classification using DNA Microarray Gene Expression Patterns”, IJCSI International Journal of Computer Science Issues, Vol. 8, No. 2, 2011, pp. 155-160.
[4] T.R. Golub, D.K. Slonim, P. Tamayo, et al. “Molecular Classification of Cancer: Class Discovery and Class Prediction by Gene Expression Monitoring”, Science, Vol. 286, 1999, pp. 531-537.
[5] M.E. Ross, X. Zhou, G. Song, et al. “Classification of pediatric acute lymphoblastic leukemia by gene expression profiling”, Blood, Vol. 102, 2003, pp. 2951-2959.
[6] T. Chandrasekhar, K. Thangavel and E.N. Sathishkumar, “Verdict Accuracy of Quick Reduct Algorithm using Clustering and Classification Techniques for Gene Expression Data”, IJCSI International Journal of Computer Science Issues, Vol. 9, No. 1, 2012, pp. 357-363.
[7] A. Bhattacharjee, W.G. Richards, J. Staunton, et al. “Classification of Human Lung Carcinomas by mRNA Expression Profiling Reveals Distinct Adenocarcinoma Subclasses”, Proc. Natl. Acad. Sci., Vol. 98, 2001, pp. 13790-13795.
[8] M. Bittner, P. Meltzer, Y. Chen, et al. “Molecular Classification of Cutaneous Malignant Melanoma by Gene Expression Profiling”, Nature, Vol. 406, 2000,pp. 536-540.
[9] S.B. Cho and H.H. Won, “Machine Learning in DNA Microarray Analysis for Cancer Classification”, In Proc. First Asia-Pacific Bioinformatics Conference, 2003, pp.189-198.
[10] V. Vapnik. “The Nature of Statistical Learning Theory”, New York: Springer-Verlag, 1995.
[11] J. Xie, J. Wang, and S. Jiang, “Clustering Support Vector Machines for Unlabeled Data Classification”, ICTM, 2009, pp. 34-38.
[12] M. Pirooznia and Y. Deng, “SVM Classifier – a comprehensive java interface for support vector machine classification of microarray data”, BMC Bioinformatics, Vol. 7, 2006, pp.4-25.
IJCSI International Journal of Computer Science Issues, Vol. 9, Issue 6, No 1, November 2012 ISSN (Online): 1694-0814
www.IJCSI.org 357
[13] R. Schachtner, D. Lutter, K. Stadlthanner, et al. “Routes to identify marker genes for microarray classification”, In Proc. 29th Annual International Conference of the IEEE EMBS, 2007, pp. 4617-4620.
[14] V.B. Deepa and P. Thangaraj, “Classification of EEG data using FHT and SVM based on Bayesian Network”, IJCSI International Journal of Computer Science Issues, Vol. 8, No. 2, 2011, pp. 239-243.
[15] http://www.imtech.res.in/raghava/rbpred/algorithm.html [16] S. Arora, D. Bhattacharjee, M. Nasipuri, et al.
“Performance Comparison of SVM and ANN for Handwritten Devnagari Character Recognition”, IJCSI International Journal of Computer Science Issues, Vol. 7, No. 6, 2010, pp. 18-26.
[17] J. Milgram, M. Cheriet and R. Sabourin, ““One Against One” or “One Against All”: Which One is Better for Handwriting Recognition with SVMs?”, In Proc. Tenth International Workshop on Frontiers in Handwriting Recognition, 2006.
[18] H.C. Kim, S. Pang, H.M. Je, et al. “Support Vector Machine Ensemble with Bagging”, In Lecture notes in computer science, Vol. 2388, 2002, pp. 397-408. [19] A. Ansari, A.B. Shafie and A.B.M. Said, “Independent
Component Analysis Using Random Projection For Data Pre-Processing”, IJCSI International Journal of Computer Science Issues, Vol. 9, No. 3, 2012, pp. 200-204. [20] Z. Wang. “Neuro-Fuzzy Ensemble Approach for
Microarray Cancer Gene Expression Data Analysis”, In Proc. International Symposium on Evolving Fuzzy Systems, 2006.
[21] A.C. Tan and D. Gilbert, “Ensemble Machine Learning on Gene Expression Data for Cancer Classification”, Applied Bioinformatics, Vol. 2, No. 3, 2003, pp. 75-83. [22] S. Mukherjee, P. Tamayo, D. Slonim, et al. “Support
Vector Machine Classification of Microarray Data”, CBCL, 1998, pp. 1-10.
[23] K.R. Seeja and Shweta, “Microarray Data Classification Using Support Vector Machine” International Journal of Biometrics and Bioinformatics, Vol. 5, No. 1, 2001, pp. 10-15.
[24] M.P.S. Brown, W.N. Grundy, D. Lin, et al. “Knowledge-based analysis of microarray gene expression data by using support vector machines” Proc. Natl. Acad. Sci., Vol. 97, No. 1, 2000, pp. 262-267.
[25] T.S. Furey, N. Cristianini, N. Duffy, et al. “Support vector machine classification and validation of cancer tissue samples using microarray expression data”, Bioinformatics, Vol.16, No.10, 2000, pp. 906-914.
Gokmen Zararsiz was born in 1986 at Bursa, Turkey. He has acquired his MSc Degree in Department of Biostatistics and Medical Informatics in Erciyes University. He has 5 published international/national articles and over 10 articles under review in international/national journals. He has participated to many congress and symposiums and have about 40 conference proceedings. Also, he got 2 oral and 2 poster presentation awards in these congress. He is a member
of many associations including International Society for Computational Biology (ISCB) and Statistics Without Borders (SWB). He is now writing a book chapter about statistical analysis of miRNA datasets, which will be published by Springer, in “Methods in Molecular Biology”. His area of interest is biostatistics, data mining, machine learning, bioinformatics and gamlss modelling.
Ferhan Elmali was born in 1979 at Kiel, Germany. He has acquired his MSc and PhD degrees in Department of Biostatistics in Eskisehir Osmangazi University. He has many published international/national articles. He has participated to many congress and symposiums and have many conference proceedings. His working areas are survival analysis, ROC analysis, regression analysis and exact tests.
Ahmet Ozturk was born in 1967 at Kayseri, Tukey. He has acquired his MSc degree in Department of Biostatistics and Medical Informatics in Erciyes University and his PhD degree in same department in Eskisehir Osmangazi University. He has many published international/national articles. His working areas are constructing children growth curves, gamlss modelling and multivariate statistics.
IJCSI International Journal of Computer Science Issues, Vol. 9, Issue 6, No 1, November 2012 ISSN (Online): 1694-0814
www.IJCSI.org 358