VennPainter: A Tool for the Comparison and
Identification of Candidate Genes Based on
Venn Diagrams
Guoliang Lin
1,3☯, Jing Chai
1,3,4,5☯, Shuo Yuan
2, Chao Mai
2, Li Cai
2,7, Robert W. Murphy
4,6,
Wei Zhou
2*, Jing Luo
1,3*
1Key Laboratory for Animal Genetic Diversity and Evolution of High Education in Yunnan Province, School of Life Sciences, Yunnan University, Kunming, 650091, China,2School of Software, Yunnan University, Kunming, 650091, Yunnan, China,3State Key Laboratory for Conservation and Utilization of Bio-resource, Yunnan University, Kunming, 650091, Yunnan, China,4State Key Laboratory of Genetic Resources and Evolution, Kunming Institute of Zoology, The Chinese Academy of Sciences, Kunming, 650223, Yunnan, China,5Kunming College of Life Science, University of Chinese Academy of Sciences, Kunming, 650000, China,6Centre for Biodiversity and Conservation Biology, Royal Ontario Museum, Toronto, M5S 2C6, Canada,7School of Computer and Science, Fudan University, Shanghai, 200433, China
☯These authors contributed equally to this work.
*[email protected](WZ);[email protected](JL)
Abstract
VennPainter is a program for depicting unique and shared sets of genes lists and
generat-ing Venn diagrams, by usgenerat-ing the Qt C++ framework. The software produces Classic Venn,
Edwards
’
Venn and Nested Venn diagrams and allows for eight sets in a graph mode and
31 sets in data processing mode only. In comparison, previous programs produce Classic
Venn and Edwards’
Venn diagrams and allow for a maximum of six sets. The software
incorporates user-friendly features and works in Windows, Linux and Mac OS. Its graphical
interface does not require a user to have programing skills. Users can modify diagram
con-tent for up to eight datasets because of the Scalable Vector Graphics output. VennPainter
can provide output results in vertical, horizontal and matrix formats, which facilitates sharing
datasets as required for further identification of candidate genes. Users can obtain gene
lists from shared sets by clicking the numbers on the diagram. Thus, VennPainter is an
easy-to-use, highly efficient, cross-platform and powerful program that provides a more
comprehensive tool for identifying candidate genes and visualizing the relationships among
genes or gene families in comparative analysis.
Introduction
In comparative genomics, the visualization of results can help viewers discover correlations
and trends in large datasets [
1
–
4
]. Many methods can visualize statistical analysis (e.g., scatter
diagrams, line graphs, and histograms) [
2
,
3
,
5
–
8
], biological networks (e.g., pathway and
func-tional networks) [
7
,
9
–
11
] and comparisons of large-scale
‘
omic
’
data (e.g., clusters, heatmaps,
and circsters) [
1
,
3
,
4
,
6
,
12
]. Venn diagrams, first developed by John Venn in 1880 [
13
], are
a11111
OPEN ACCESS
Citation:Lin G, Chai J, Yuan S, Mai C, Cai L, Murphy RW, et al. (2016) VennPainter: A Tool for the Comparison and Identification of Candidate Genes Based on Venn Diagrams. PLoS ONE 11(4): e0154315. doi:10.1371/journal.pone.0154315
Editor:Nicholas J. Provart, University of Toronto, CANADA
Received:November 22, 2015
Accepted:April 12, 2016
Published:April 27, 2016
Copyright:© 2016 Lin et al. This is an open access article distributed under the terms of theCreative Commons Attribution License, which permits unrestricted use, distribution, and reproduction in any medium, provided the original author and source are credited.
Data Availability Statement:VennPainter is available onhttps://github.com/linguoliang/
VennPainter/, The GFF files are downloaded from
NCBI genome database.
widely used for comparing multiple genomic, transcriptomic and proteomic datasets due to
their ease-of-interpretation and graphical simplicity [
14
–
21
]. These diagrams help to identify
candidate genes and gene networks for downstream analyses. For example, the simple n-Venn
diagram is a collection of n simple intersecting closed curves in the plane. It indicates the
rela-tionships among datasets, including intersections, sums, complements [
13
,
22
]. The curves
divide the plane into 2
n-1 distinct intersections, each defined by its intersection of the interior
or exterior of each of the curves [
23
]. Generally, the Classic Venn diagram deciphers no more
than four sets. The development of Symbolic Logic has facilitated several approaches for
con-structing Venn diagram with more than five sets, including Classic, Edwards
’
, Lewis Carroll
’
s
and Nested Venn diagrams [
24
,
25
]. Edwards
’
and Nested methods might generate Venn
dia-gram for an infinite number sets, but the partition of sets among multiple datasets might have
complex associations because distinct open regions increase exponentially with the increase
in set-number. This makes it difficult to generate intuitive diagrams that display associations
among datasets.
Many open access programs can generate Venn diagrams, such as Venny [
26
],
VennDia-gram [
27
], BioVenn [
28
], GeneVenn [
29
], 4-way Venn Diagram Generator, DrawVenn,
Venn-Master [
30
], VennPlex [
31
], VennTure [
32
] and others. However, these programs have some
limitations. For example, DrawVenn requires the manual drawing of diagrams and it cannot
process data. VennMaster [
30
] provides area-proportional Euler diagrams for functional GO
analysis of microarrays only. VennPlex [
31
] compares and visualizes datasets with
differen-tially regulated data points. Powerful VennDiagram [
27
] generates Venn and Euler diagrams
in R and it provides a large number of customizable features. Unfortunately, its command-line
operation is not user-friendly. VennTure [
32
] can generate six-sets Venn diagrams with a
graphic user interface (GUI), yet it consumes large amounts of memory and has low
computa-tional efficiency. Venny [
26
], BioVenn [
28
], GeneVenn [
29
], and 4-way Venn Diagram
Gener-ator are web applications. Despite their power and being user-friendly, none of them can
evaluate more than four datasets. The latest program, jVenn [
33
], can handle six input lists at
most but only provides Classic and Edwards
’
Venn diagrams.
Available programs generate no more than six-set Venn diagrams and only support Classic
and Edwards
’
Venn layouts. Larger datasets often present an insurmountable challenge to
deci-phering and drawing Venn diagrams of shared relationships manually. This complexity might
explain the dearth of applications [
34
–
37
]. To rectify this limitation and address Venn-based
demands, we report the development of VennPainter, a program that introduces a new nested
Venn layout.
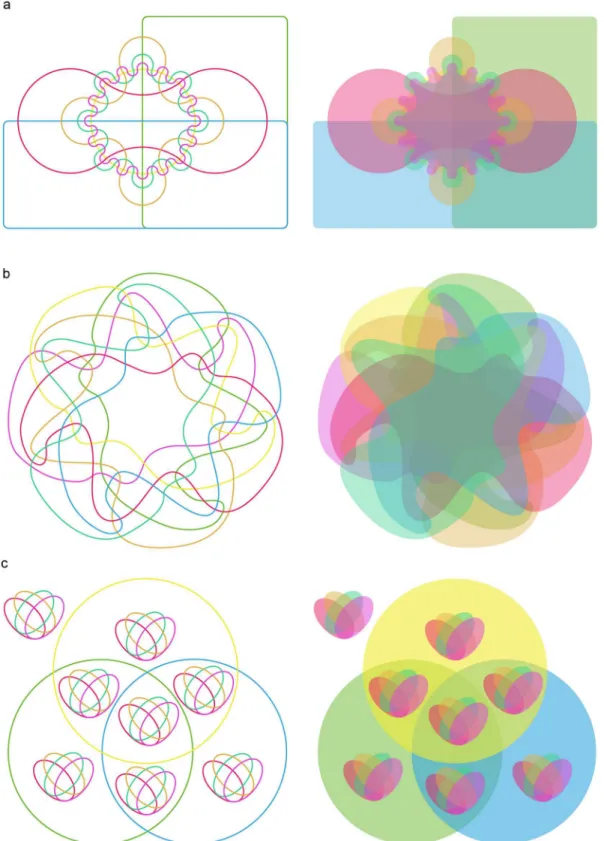
Fig 1
illustrates seven-set Edwards
’
(
Fig 1a
) and Classic
’
s (
Fig 1b
) Venn diagrams.
The former illustrates that intersections become smaller with increasing numbers of sets,
which presents a challenge for interpretation. The irregular curves of the latter approach are
equally challenging. In comparison, the nested Venn (
Fig 1c
) is far more easily interpreted.
VennPainter incorporates the nested Venn layout and increases the number of allowable
data-sets up to eight with diagram output. It also offers text output of up to 31 datadata-sets for
down-stream analyses. Further, VennPainter elevates computational efficiency.
Implementation and Method
VennPainter and its availability
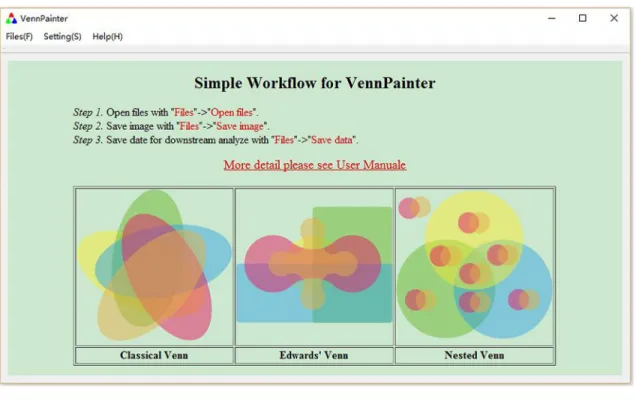
VennPainter (
Fig 2
) was developed with Qt 4.8.5 under its LGPL v2.1 license. The Qt C++
framework was chosen for its cross-platform capabilities, open-source nature, and secure
lan-guage construction for communicating between objects (signals and slots) (
http://qt-project.
org/
). For data sets ranging from nine to 31, VennPainter provides vertical, horizontal and
matrix text-based formats for the benefit of downstream analyses. The user manual and basic
VennPainter: A Tool for the Comparison and Identification of Candidate Genes Based on Venn Diagrams
designed the study. The other funders (the last two projects in the above list) had no role in study design, data collection and analysis, decision to publish, or preparation of the manuscript.
Fig 1. Venn diagrams for seven sets. (a)Edward’s Venn diagram constructed with cogwheels, which become smaller with increasing numbers of sets. With seven sets, this made it hard to fill intersections with a number.(b)Venn diagram constructed with irregular curves. Some intersections are unclear.(c)
Nested Venn diagram places its intersections more evenly and regularly, which facilitates accurate interpretation.
Fig 2. VennPainter GUI.The simple graphical user interface (GUI) for VennPainter.(a)A simple workflow appears on the canvas after loading VennPainter.
(b)After loading data, the GUI control panel will appear for customizing colors.
doi:10.1371/journal.pone.0154315.g002
instructions appear in the initial interface of the program, and can be downloaded together
with VennPainter at
https://github.com/linguoliang/VennPainter/
.
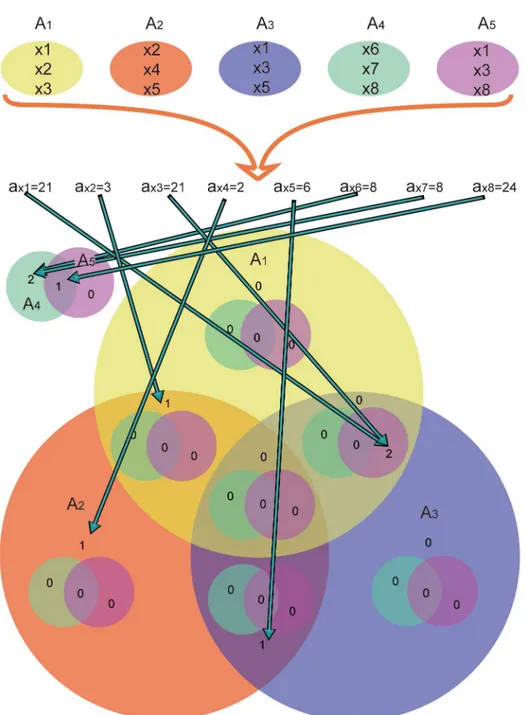
Algorithm
VennPainter uses set-theory to generate Venn diagrams. The intersection is defined as follow:
A
\
B
¼
f
x
:
x
2
A
^
x
2
B
g
and its complement:
B
n
A
¼
B
\
A
∁¼
f
x
:
x
2
B
^
x
2
=
A
g
Technically, integer
a
xis assigned to label element
x
.
8
x
2
[
ni¼1
A
i;
1
n
31
a
xcan represent the following:
a
x¼
X
ni¼1
b
i;
1
n
31
and
b
i¼
2
i 1;
x
2
A
i0
;
x
2
=
A
i(
Thus, if
a
x1=
a
x2, then
x
1 and
x
2 belong to the same intersection. VennPainter labels every
intersection
U
mwith an integer
c
Um
in the Venn diagram (
S1
,
S2
and
S3
Figs). If
a
x¼
c
Um, then
x
2
U
m. The
fl
owchart (
Fig 3
) shows how VennPainter works.
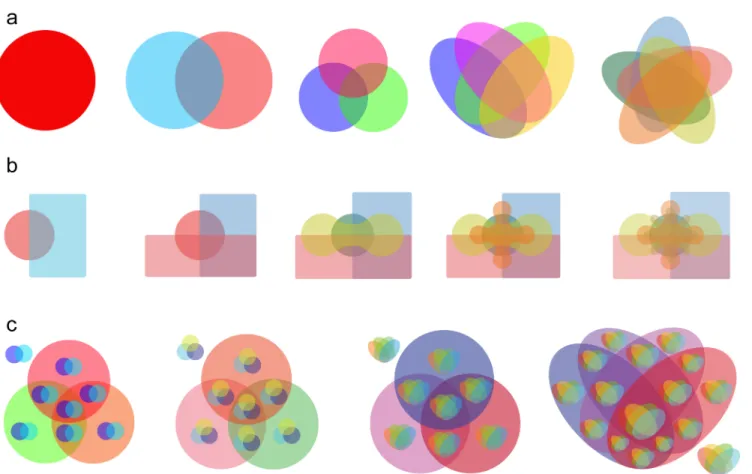
Adapted Venn Diagrams in VennPainter
Users can select Classic Venn, Edwards
’
Venn and Nested Venn diagrams [
25
] (
Fig 4a–4c
).
Input and Output
Results and Discussion
Example Application
To demonstrate the functions of VennPainter, we use it to depict shared gene sets in the
gold-fish x common carp hybrid system using eight annotated gene lists generated from RNA-seq
data (
S4 Fig
) [
37
]. The Nested Venn diagram shows unique and shared relationships of eight
sets by inlaying four unique-shared diagrams into the other four sets
’
unique sharing diagram.
The number in the center-most area (27,681) in the black rectangle shows the shared genes by
Fig 3. Work flow of VennPainter.The workflow has three steps: 1, calculate all label elements; 2, find the corresponding label in the Venn diagram; and 3, count all intersections and draw Venn diagrams.doi:10.1371/journal.pone.0154315.g003
all eight samples (
S4 Fig
). In a very intuitive manner, Nested Venn shows that each sample had
more than 200 unique genes. It efficiently obtains candidate genes and facilitates downstream
analyses of GO enrichment and KEGG annotation [
37
].
We evaluate the following seven primate gene-lists from GFF files (NCBI Genome database;
S1 Table
) using VennPainter:
Homo sapiens
,
Gorilla gorilla
,
Macaca mulatta
,
Nomascus
leuco-genys
,
Pongo abelii
,
Pan paniscus
, and
Rhinopithecus roxellana
. A comparison of our analyses
with that of Zhou
et al
. 2014 [
36
] is informative. Analyses by the latter authors discovered 38
unique or shared sets, only 14 sets were marked with gene numbers, and 10,244 genes or
gene families were shared by the seven primates (
Fig 6a
). In contrast, VennPainter depicts 127
intersections that a seven-set Venn diagrams should resolve, and these primates share 8,452
annotated genes (
Fig 6b
). Their Venn diagram did not depict all possible logical relationships
among all the sets.
Benchmark Test
To evaluate VennPainter
’
s relative performance, we use benchmarking data (
Table 1
). The
benchmarking database contains four files of about 0.5MB each. Comparisons use an Intel
core i5-5200U, 12GB memory, and Win 10 (64-bit). jVenn and Venny use Google Chrome
47.0.2526.111 m (64-bit). In comparison, jVenn, Venny and VennDiagram consume 3554
milliseconds (ms), 979 ms and 1078 ms, respectively, while VennPainter only costs 137 ms.
Fig 4. Venn diagrams and Nested Venn in VennPainter. (a)Classic Venn diagram depicting from one to five datasets.(b)Edwards’Venn diagrams for from two to six datasets.(c)Nested Venn diagrams showing from five to eight variables. Nested Venn diagrams uses single-level Classic Venn diagrams to construct multi-level ones, which are easier to interpret than other forms of Venn diagrams when the datasets reaches more than six.Vennture crashes after 8.4
10
5ms. Thus, VennPainter is more than seven times faster than
other tested programs. The increased speed owes to VennPainter bring programmed in C++,
while Venny and jVenn were programmed by JavaScript and VennDiagram by R.
Platforms and GUI
Several features make VennPainter more efficient at processing data than other available tools.
VennPainter works with Windows, Linux and Mac operating systems (
Table 1
) and it has a
concise GUI that eliminates the need for programming skills. The simple clicking on a number
in any diagram promotes downstream analyses. Unlike other programs, VennPainter provides
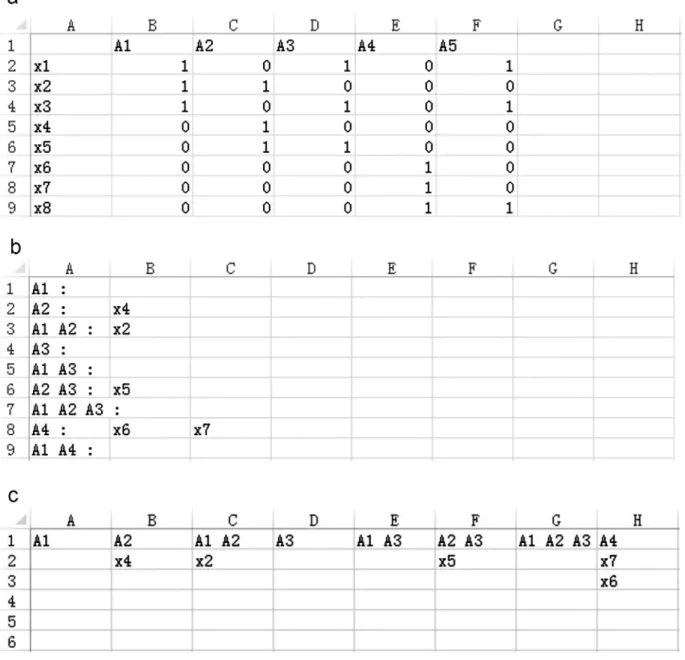
Fig 5. Output shared datasets.The Horizontal, Vertical and Matrix formats of output datasets.(a)Matrix format, first row contains all datasets and the first column contains all dataset elements; remaining columns denote if an element belongs to the dataset. Matrix used to construct a network.(b)Horizontal format, each line represents one intersection shared by datasets, which are listed before the colon.(c)Vertical format, identical to the Horizontal format with exchanged columns and rows.doi:10.1371/journal.pone.0154315.g005
three diagrams including Classic Venn, Edwards
’
Venn and Nested Venn diagrams for
flexibil-ity. Nested Venn is the default depiction when evaluating for more than six sets because regions
have a more evenly distribution than Edwards
’
Venn and are more orderly than classic Venn
[
34
]. This approach makes it easy to fill in and visualize numbers. Nested Venn diagrams are
particularly effective when considering more than six datasets, and VennPainter extends the
capacity of processing up to eight datasets. So far, only VennPainter can achieve this
compari-son. Thus, VennPainter can applied to all shared data that need to be extract from dataset(s)
for genomic and transcriptomic comparison.
Fig 6. Comparisons of genes among seven primates.(a)The incomplete seven-sets Venn diagram generated by the method referenced in Zhouet al. (2014) [36]. It contains 38 unique or shared sets and many intersections are lost. It is not a general method of drawing a Venn diagram. (b) The full Nested Venn diagram depicting 127 regions was generated by VennPainter.
doi:10.1371/journal.pone.0154315.g006
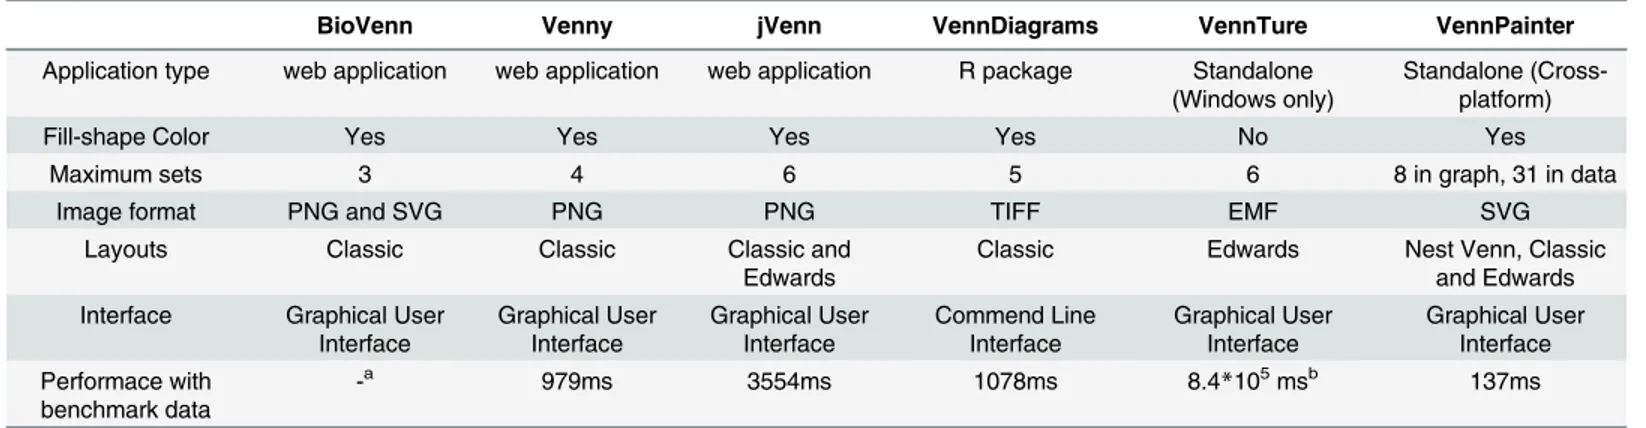
Table 1. Comparison of BioVenn, Venny, jVenn, VennDiagrams, VennTure, and VennPainter.
BioVenn Venny jVenn VennDiagrams VennTure VennPainter
Application type web application web application web application R package Standalone (Windows only)
Standalone (Cross-platform)
Fill-shape Color Yes Yes Yes Yes No Yes
Maximum sets 3 4 6 5 6 8 in graph, 31 in data
Image format PNG and SVG PNG PNG TIFF EMF SVG
Layouts Classic Classic Classic and
Edwards
Classic Edwards Nest Venn, Classic
and Edwards Interface Graphical User
Interface
Graphical User Interface
Graphical User Interface
Commend Line Interface
Graphical User Interface
Graphical User Interface Performace with
benchmark data
-a 979ms 3554ms 1078ms 8.4
*105msb 137ms
a: BioVenn is based on browser/server architecture. It is impossible to be estimated in local machine.
b: Time was estimated when VennTure ran out of memory (2GB). VennTure is a win32 program that cannot manage more than 2GB memory.
Supporting Information
S1 Fig. Labeled Classic Venn diagram.
This is an example of a labeled Classic Venn diagram
with 5 sets.
(TIF)
S2 Fig. Labeled Edwards
’
Venn diagram.
This is an example of labeled Edwards
’
Venn
dia-gram with 5 sets.
(TIF)
S3 Fig. Labeled Nested Venn diagram.
This is an example of labeled Nested Venn diagram
with 5 sets.
(TIF)
S4 Fig. Nested Venn with eight data sets.
Example from the goldfish x common carp hybrid
system with Nested Venn. The right smaller diagram in the green rectangle shows uniquely
shared sets only among four datasets (f18, f22-1, f22-2, f22-3), while the larger left diagram
includes all eight shared relationships by inlaying the right four into every intersection area
showing another unique shared set among datasets for R
♀
, C
♂
, f1 and f2. For example, the
number in the red rectangle, 53, which is over R
♀
and f18, means that R
♀
and f1 shared 53
items only. The Nested Venn diagram shows that each sample has more than 200 unique genes
and all samples share 27,681 genes. Data sets are from Liu et al. (2016) [
37
].
(TIF)
S1 Table. GFF file information.
(PDF)
Acknowledgments
This research was supported by the National Natural Science Foundation of China (91331105,
31360514 and 61363021), Program for Innovative Research Team (in Science and Technology)
in University of Yunnan Province, and the State Key laboratory of Genetics, Resources and
Evolution, Kunming Institute of Zoology, CAS.
Author Contributions
Conceived and designed the experiments: WZ JL. Performed the experiments: GLL. Analyzed
the data: GLL JC. Contributed reagents/materials/analysis tools: SY CM LC WZ. Wrote the
paper: GLL JC JL. Revised the manuscript: RM WZ JL.
References
1. Cain AA, Kosara R, Gibas CJ (2012) Genosets: Visual analytic methods for comparative genomics. PloS ONE 7(10): e46401. doi:10.1371/journal.pone.0046401PMID:23056299
2. Bare JC, Koide T, Reiss DJ, Tenenbaum D, Baliga NS (2010) Integration and visualization of systems biology data in context of the genome. BMC Bioinformatics 11: 382. doi:10.1186/1471-2105-11-382
PMID:20642854
3. Goecks J, Eberhard C, Too T, Nekrutenko A, Taylor J (2013) Web-based visual analysis for high-throughput genomics. BMC Genomics 14: 397. doi:10.1186/1471-2164-14-397PMID:23758618 4. Baran R, Robert M, Suematsu M, Soga T, Tomita M (2007) Visualization of three-way comparisons of
omics data. BMC Bioinformatics 8: 72. PMID:17335588
5. Thorvaldsen S, Fla T, Willassen NP (2010) DeltaProt: a software toolbox for comparative genomics. BMC Bioinformatics 11: 573. doi:10.1186/1471-2105-11-573PMID:21092291
6. Phanstiel DH, Boyle AP, Araya CL, Snyder MP (2014) Sushi.R: flexible, quantitative and integrative genomic visualizations for publication-quality multi-panel figures. Bioinformatics 30(19): 2808–2810. doi:10.1093/bioinformatics/btu379PMID:24903420
7. Conesa A, Gotz S, Garcia-Gomez JM, Terol J, Talon M, Robles M (2005) Blast2GO: a universal tool for annotation, visualization and analysis in functional genomics research. Bioinformatics 21(18): 3674–
3676. PMID:16081474
8. Rasko DA, Myers GS, Ravel J (2005) Visualization of comparative genomic analyses by BLAST score ratio. BMC Bioinformatics 6: 2. PMID:15634352
9. Forman JJ, Clemons PA, Schreiber SL, Haggarty SJ (2005) SpectralNET—an application for spectral graph analysis and visualization. BMC Bioinformatics 6: 260. PMID:16236170
10. Morris JH, Apeltsin L, Newman AM, Baumbach J, Wittkop T, Su G, et al. (2011) clusterMaker: a multi-algorithm clustering plugin for Cytoscape. BMC Bioinformatics 12: 436. doi: 10.1186/1471-2105-12-436PMID:22070249
11. Demchak B, Hull T, Reich M, Liefeld T, Smoot M, Ideker T, et al. (2014) Cytoscape: the network visuali-zation tool for GenomeSpace workflows. F1000Research 3: 151. doi:10.12688/f1000research.4492.2
PMID:25165537
12. Hu Y, Yan C, Hsu CH, Chen QR, Niu K, Komatsoulis GA, et al. (2014) OmicCircos: A Simple-to-Use R Package for the Circular Visualization of Multidimensional Omics Data. Cancer Informatics 13: 13–20.
13. Ruskey F, Weston M (1997) A survey of Venn diagrams. Electronic Journal of Combinatorics 4.
14. Tobias CM, Sarath G, Twigg P, Lindquist E, Pangilinan J, Penning BW, et al. (2008) Comparative geno-mics in switchgrass using 61,585 high-quality expressed sequence tags. The Plant Genome 1(2): 111–124.
15. Thomson NR, Clayton DJ, Windhorst D, Vernikos G, Davidson S, Churcher C, et al. (2008) Compara-tive genome analysis ofSalmonella enteritidisPT4 andSalmonella gallinarum287/91 provides insights into evolutionary and host adaptation pathways. Genome Research 18(10): 1624–1637. doi:10.1101/ gr.077404.108PMID:18583645
16. Beare PA, Unsworth N, Andoh M, Voth DE, Omsland A, Gilk SD, et al. (2009) Comparative genomics reveal extensive transposon-mediated genomic plasticity and diversity among potential effector pro-teins within the genus Coxiella. Infection and Immunity 77(2): 642–656. doi:10.1128/IAI.01141-08
PMID:19047403
17. Wilkinson P, Waterfield NR, Crossman L, Corton C, Sanchez-Contreras M, Vlisidou I et al. (2009) Com-parative genomics of the emerging human pathogenPhotorhabdus asymbioticawith the insect patho-genPhotorhabdus luminescens. BMC genomics 10: 302. doi:10.1186/1471-2164-10-302PMID:
19583835
18. Bauer J, Antosh M, Chang C, Schorl C, Kolli S, Neretti N, et al. (2010) Comparative transcriptional pro-filing identifies takeout as a gene that regulates life span. Aging (Albany NY) 2(5): 298–310.
19. Chen Y, Stine OC, Badger JH, Gil AI, Nair GB, Nishibuchi M, et al. (2011) Comparative genomic analy-sis ofVibrio parahaemolyticus: serotype conversion and virulence. BMC Genomics 12: 294. doi:10. 1186/1471-2164-12-294PMID:21645368
20. Pan G, Xu J, Li T, Xia Q, Liu S-L, Zhang G, et al. (2013) Comparative genomics of parasitic silkworm microsporidia reveal an association between genome expansion and host adaptation. BMC Genomics 14: 186. doi:10.1186/1471-2164-14-186PMID:23496955
21. Zhang Y, Zou X, Ding Y, Wang H, Wu X, Liang B (2013) Comparative genomics and functional study of lipid metabolic genes in Caenorhabditis elegans. BMC Genomics 14: 164. doi: 10.1186/1471-2164-14-164PMID:23496871
22. Henderson DW (1963) Venn diagrams for more than four classes. American Mathematical Monthly 70 (4): 424–426.
23. Bultena B (2013) Face-balanced, Venn and polyVenn diagrams: University of Victoria.
24. Edwards AWF (2004) Cogwheels of the mind: the story of Venn diagrams: JHU Press.
25. Radcliffe NJ (2010) Nested Venn Diagrams. Available:http://www.stochasticsolutions.com/pdf/ NestedVenn.pdf.
26. Oliveros J (2007) Venny. An interactive tool for comparing lists with Venn Diagrams. Available:http:// bioinfogp.cnb.csic.es/tools/Venny/index.html.
27. Chen H, Boutros PC (2011) VennDiagram: a package for the generation of highly-customizable Venn and Euler C in R. BMC Bioinformatics 12: 35. doi:10.1186/1471-2105-12-35PMID:21269502 28. Hulsen T, de Vlieg J, Alkema W (2008) BioVenn–a web application for the comparison and visualization
29. Pirooznia M, Nagarajan V, Deng Y (2007) GeneVenn-A web application for comparing gene lists using Venn diagrams. Bioinformation 1(10):420–422. PMID:17597932
30. Kestler HA, Müller A, Kraus JM, Buchholz M, Gress TM, Liu H, et al. (2008) VennMaster: area-propor-tional Euler diagrams for funcarea-propor-tional GO analysis of microarrays. BMC Bioinformatics 9: 67. doi:10. 1186/1471-2105-9-67PMID:18230172
31. Cai H, Chen H, Yi T, Daimon CM, Boyle JP, Peers C, et al. (2013) VennPlex–A novel Venn diagram program for comparing and visualizing datasets with differentially regulated datapoints. PLoS ONE 8: e53388. doi:10.1371/journal.pone.0053388PMID:23308210
32. Martin B, Chadwick W, Yi T, Park S-S, Lu D, Ni B, et al. (2012) VENNTURE–a novel Venn diagram investigational tool for multiple pharmacological dataset analysis. PLoS ONE 7: e36911. doi:10.1371/ journal.pone.0036911PMID:22606307
33. Bardou P, Mariette J, Escudié F, Djemiel C, Klopp C (2014) jVenn: an interactive Venn diagram viewer. BMC bioinformatics 15: 293. doi:10.1186/1471-2105-15-293PMID:25176396
34. Zhang Q-J, Zhu T, Xia E-H, Shi C, Liu Y-L, Zhang Y, et al. (2014) Rapid diversification of five Oryza AA genomes associated with rice adaptation. Proceedings of the National Academy of Sciences USA 111 (46): E4954–62.
35. Chen Z-Y, Guo X-J, Chen Z-X, Chen W-Y, Liu D-C, Zheng YL, et al. (2015) Genome-wide characteriza-tion of developmental stage- and tissue-specific transcripcharacteriza-tion factors in wheat. BMC Genomics 16(1): 125.
36. Zhou X, Wang B, Pan Q, Zhang J, Kumar S, Sun X, et al. (2014) Whole-genome sequencing of the snub-nosed monkey provides insights into folivory and evolutionary history. Nature Genetics 46: 1303–1310. doi:10.1038/ng.3137PMID:25362486
37. Liu S, Luo J, Chai J, Ren L, Zhou Y, Huang F, et al. (2016) Genomic incompatibilities in the diploid and tetraploid offspring of the goldfish× common carp cross. Proceedings of the National Academy of Sci-ences USA 113(5):1327–1332.
38. Ferraiolo J, Jun F, Jackson D (2000) Scalable vector graphics (SVG) 1.0 specification. World Wide Web Consortium Available:https://www.w3.org/TR/1999/WD-SVG-19991203.pdf.
39. Quint A (2003) Scalable vector graphics. IEEE Multimedia 10(3): 99–102.