ACPD
6, 4171–4211, 2006Modelling soil dust aerosol in the Bod ´el ´e
depression
I. Tegen et al.
Title Page
Abstract Introduction
Conclusions References
Tables Figures
◭ ◮
◭ ◮
Back Close
Full Screen / Esc
Printer-friendly Version
Interactive Discussion
EGU Atmos. Chem. Phys. Discuss., 6, 4171–4211, 2006
www.atmos-chem-phys-discuss.net/6/4171/2006/ © Author(s) 2006. This work is licensed
under a Creative Commons License.
Atmospheric Chemistry and Physics Discussions
Modelling soil dust aerosol in the Bod ´el ´e
depression during the BoDEx campaign
I. Tegen1, B. Heinold1, M. Todd2, J. Helmert1, R. Washington3, and O. Dubovik4
1
Leibniz Institute for Tropospheric Research, Leipzig, Germany 2
Department of Geography, University College London, UK 3
Oxford University Centre for the Environment, University of Oxford, UK 4
NASA Goddard Space Flight Center, Greenbelt, MD, USA
Received: 7 March 2006 – Accepted: 12 March 2006 – Published: 24 May 2006
ACPD
6, 4171–4211, 2006Modelling soil dust aerosol in the Bod ´el ´e
depression
I. Tegen et al.
Title Page
Abstract Introduction
Conclusions References
Tables Figures
◭ ◮
◭ ◮
Back Close
Full Screen / Esc
Printer-friendly Version
Interactive Discussion
EGU
Abstract
We present regional model simulations of the dust emission events during the Bod ´el ´e Dust Experiment (BoDEx) that was carried out in February and March 2005 in Chad. A
box model version of the dust emission model is used to test different input parameters
for the emission model, and to compare the dust emissions computed with observed 5
wind speeds to those calculated with wind speeds from the regional model simula-tion. While field observations indicate that dust production occurs via self-abrasion of saltating diatomite flakes in the Bod ´el ´e, the emission model based on the assumption of dust production by saltation and using observed surface wind speeds as input pa-rameters reproduces observed dust optical thicknesses well. Although the peak wind 10
speeds in the regional model underestimate the highest wind speeds occurring on 10– 12 March 2005, the spatio-temporal evolution of the dust cloud can be reasonably well reproduced by this model. Dust aerosol interacts with solar and thermal radiation in the regional model; it is responsible for a decrease in maximum daytime temperatures by about 5K at the beginning the dust storm on 10 March 2005. This direct radiative 15
effect of dust aerosol accounts for about half of the measured temperature decrease
compared to conditions on 8 March. Results from a global dust model suggest that the dust from the Bod ´el ´e is an important contributor to dust crossing the African Savannah region towards the Gulf of Guinea and the equatorial Atlantic, where it can contribute up to 40% to the dust optical thickness.
20
1 Introduction
Wind-blown dust emitted from soil surfaces in arid and semi-arid regions contributes significantly to the global aerosol optical thickness (IPCC, 2001), and dust plumes emerging from continents are prominent features in satellite retrievals of atmospheric particles. The dust aerosol particles scatter and partly absorb solar radiation, and, 25
ACPD
6, 4171–4211, 2006Modelling soil dust aerosol in the Bod ´el ´e
depression
I. Tegen et al.
Title Page
Abstract Introduction
Conclusions References
Tables Figures
◭ ◮
◭ ◮
Back Close
Full Screen / Esc
Printer-friendly Version
Interactive Discussion
EGU particle sizes are found near dust source regions) they have the potential to change
out-going terrestrial radiation fluxes (“greenhouse effect”) (Lacis and Mishchenko, 1995).
The magnitude and even the sign of dust radiative forcing remains uncertain (IPCC, 2001). While in the global annual mean the radiative forcing by dust at the
top-of-atmosphere (TOA) is estimated to range from−1.4 to 1 W m−2 (Mhyre and Stordahl,
5
2001; Perlwitz et al., 2001), dust events can locally cause radiative forcing over oceans
in the solar spectrum as high as−130 W m−2(Haywood et al., 2003). In contrast,
Hay-wood et al. (2005) recently estimated a longwave radiative effect of up to +50 W m−2
in cloud-free regions of the Sahara. The presence of atmospheric dust reduces sur-face temperatures and changes atmospheric heating rates as well as the hydrological 10
cycle (e.g., Miller et al., 2004). Dust may influence cloud properties (e.g., Wurzler et al., 2000), the formation of ice clouds (e.g., Ansmann et al, 2005), atmospheric chem-istry via heterogeneous surface reactions (e.g., Dentener et al., 1996; Bonasoni et al., 2004), and nutrient delivery to marine (e.g. Martin, 1990; Jickells et al., 2005) and ter-restrial ecosystems (Chadwick et al., 1999; Okin et al., 2004). Estimates of global soil 15
dust emissions range from 1000 to 3000 Mt year−1(IPCC, 2001). The largest sources
of dust are located in North Africa; about 50–70% of global dust emissions are esti-mated to originate from the Saharan desert (Goudie and Middleton, 2001; Mahowald et al., 2005). Observational evidence indicates a considerable increase in dust emis-sions from the Sahara in past decades (N’Tschayi Mbourou et al., 1997; Prospero and 20
Lamb, 2003).
Not all desert surfaces are effective sources of dust aerosol. Analyses of multi-year
satellite retrievals of the Absorbing Aerosol Index from the Total Ozone Mapping Spec-trometer (TOMS AAI; Herman et al., 1997) reveal that enclosed topographic depres-sions can be particularly active sources of dust, so-called “hot-spots” of dust emission 25
ACPD
6, 4171–4211, 2006Modelling soil dust aerosol in the Bod ´el ´e
depression
I. Tegen et al.
Title Page
Abstract Introduction
Conclusions References
Tables Figures
◭ ◮
◭ ◮
Back Close
Full Screen / Esc
Printer-friendly Version
Interactive Discussion
EGU between the Tibesti Mountains and Lake Chad, is the most active dust source in the
Sahara desert (Prospero et al., 2002; Washington et al., 2003); at this location the pres-ence of dust is detected throughout the year, although a pronounced seasonal cycle is evident with peak emission in winter/spring (Washington and Todd, 2005; Washington et al., 2006). That the Bod ´el ´e depression is such a dominant dust source is due to the 5
coincidence of an extensive source of diatomite sediment, which is the source of the major dust plumes emerging from the region, and high velocity winds associated with the Bod ´el ´e Low Level Jet (Washington and Todd, 2005; Washington et al., 2006; Todd et al., 2006).
Dust emissions cannot be measured directly at large scales, therefore estimates 10
of dust aerosol distribution and its effects are generally based on model calculations
that use the best available information on soil properties and meteorology to simulate dust fluxes. Most global dust models prescribe enclosed topographic depressions as preferential sources for dust aerosol emission (e.g., Ginoux et al., 2001; Tegen et al., 2002; Zender et al., 2003), but lack of information about soil and particle properties 15
in these regions, which are often difficult to access, lead to large uncertainties in the
computation of dust emission fluxes. In particular, for the remotely situated Bod ´el ´e depression few data exist that can be used as input for dust emission models.
In February and March 2005 a group of international scientists carried out a field study in the Bod ´el ´e depression (Bod ´el ´e Dust Experiment, BoDEx) (Giles, 2005; Wash-20
ington et al., 2006; Todd et al., 2006) aiming at improved knowledge about particle properties and the understanding of dust emission processes in this important dust
source region. The BoDEx campaign field site “Chicha” was located at 16◦53′′N,
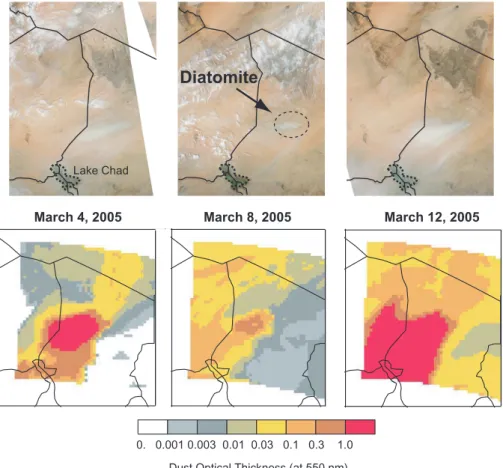
18◦33′′E, at the eastern border of massive diatomite deposits (Fig. 1). These deposits
had formed at the bottom of paleo-lake Chad, and are suspected to be very effective
25
ACPD
6, 4171–4211, 2006Modelling soil dust aerosol in the Bod ´el ´e
depression
I. Tegen et al.
Title Page
Abstract Introduction
Conclusions References
Tables Figures
◭ ◮
◭ ◮
Back Close
Full Screen / Esc
Printer-friendly Version
Interactive Discussion
EGU produced in the Bod ´el ´e is highly reflective at solar wavelengths (Todd et al., 2006). This
finding is in agreement with recent retrievals of relatively high single scattering albe-dos of Saharan dust at various sites (Dubovik et al., 2002a). From field observations Todd et al. (2006) suggest the dust emission from the area of diatomite sediment to be
1.2±0.5 Tg day−1during substantial dust plume events.
5
Here we present results of dust models constrained by observations from the BoDEx field experiment. The aim of this study is (i) to test the applicability of the physical description of the emission parameterization when comparing the results to optical thickness measurements taken directly in the active source area, and (ii) determine the importance of the radiative forcing by atmospheric dust load for the surface temperature 10
changes measured at the field site during a major dust event.
2 Observations during BoDEx
Compilations of lake status data (e.g., Damnati et al., 2000), and recent analysis of remotely-sensed surface data (Schuster et al., 2005) confirm that during the middle
Holocene ca. 6000 years before present in the Bod ´el ´e depression, centred near 17◦N,
15
18◦E, the paleo-lake Mega-Chad covered a surface area five times larger compared to
conditions at the late Holocene (Coe, 1998). Substantial layers of diatomite sediment formed from the shells of freshwater diatoms in the deepest part of this paleo-lake, which now covers an area of ca. 10 800 km (see Fig. 6) and forms a highly productive desert dust source, seemingly the most active in the world. Diatomite is a porous 20
sediment consisting of ca. 90% silicon dioxide, with bulk densities that can be as low
as 1 g cm−3. At the BoDEx site the density of diatomite samples was determined as
2.1 g cm−3.
The BoDEx multidisciplinary field experiment took place from 28 February to 13
March 2005. The observation site “Chicha” is located at 16◦53′N, 18◦33′E in 179 m
25
ACPD
6, 4171–4211, 2006Modelling soil dust aerosol in the Bod ´el ´e
depression
I. Tegen et al.
Title Page
Abstract Introduction
Conclusions References
Tables Figures
◭ ◮
◭ ◮
Back Close
Full Screen / Esc
Printer-friendly Version
Interactive Discussion
EGU during BoDEx included temperature, wind speed, humidity, solar and UV radiation and
air pressure (Washington et al., 2006). Aerosol optical properties were measured dur-ing the field experiment usdur-ing a Cimel C-318 sun-sky spectral radiometer of the type used in the Aerosol Robotic Network (AERONET: Holben et al., 1998), measuring sun and sky radiances at wavelengths of 440, 670, 870, and 1020 nm. The retrieval algo-5
rithm (Dubovik et al., 2006) is a revised version of the standard AERONET retrieval technique (Dubovik and King, 2000). The algorithm inverts measurements of aerosol
optical thickness and diffuse sky radiation and derives aerosol particle size distribution
in the range from 0.05 and 15µm and the complex refractive index at the 4
wave-lengths. The new retrieval scheme assumes the aerosols as a mixture of spherical and 10
non-spherical aerosol components, and the fraction of aerosol non-sphericity is de-rived as an additional retrieval parameter. The mixture of randomly oriented spheroids is used for modelling optical properties of the non-spherical aerosol component. The spheroid mix (aspect ratio distribution) is refined (compare to earlier studies by Dubovik et al., 2002b) from analysis of detailed polarimetric properties of desert dust sample 15
measured in the laboratory (Volten et al. 2001). In addition, Dubovik et al. (2006) in-cluded additional minor constraints for limiting the concentrations of fine particles with
radii 0.05µm. Surface albedos were assumed based on surface reflectance
clima-tologies derived from satellite observations (Moody et al., 2005). Additional optical thickness measurements were taken by handheld Microtops sun photometers, mea-20
suring aerosol optical thicknesses (AOTs) every 30 min at the wavelength of 440, 675,
870 and 1020 nm. Todd et al. (2006) show that the AOT retrievals by the different
instruments agree well with each other during times when both instruments were oper-ating, therefore the Microtops instrument could be used to fill gaps in the observational AOT record when the Cimel instrument was not operating (notably during severe dust 25
emission events).
ACPD
6, 4171–4211, 2006Modelling soil dust aerosol in the Bod ´el ´e
depression
I. Tegen et al.
Title Page
Abstract Introduction
Conclusions References
Tables Figures
◭ ◮
◭ ◮
Back Close
Full Screen / Esc
Printer-friendly Version
Interactive Discussion
EGU
16 m s−1, dust production reportedly occurred by a “self-abrasion” process of saltating
diatomite flakes, which partly disintegrate when colliding mid-air or on impact with the ground (Giles, 2005). At this location fine dust particles are apparently produced by disintegration of the saltators themselves, and not by dislocation of small particles from soil aggregates at the soil surface through the impact of saltating sand grains, as de-5
scribed e.g. in Lu and Shao (1999). Dust production at the field site occurred when the
surface wind speed exceeded 10 m s−1(Todd et al., 2006), which is a higher threshold
value compared to the often observed value of dust production starting at surface wind
speeds exceeding 6–7 m s−1(e.g., Gillette, 1978) .
3 Model description
10
3.1 Dust emission
Size-resolved dust emission fluxes for the BoDEx location and time period of the field study are computed using the model described in Tegen et al. (2002), which is based on the emission scheme developed by Marticorena et al. (1997). Dust emission is initiated by saltating soil particles, which produce smaller dust particles that can be 15
transported over large distances.
The model computes dust emission fluxesF in non-vegetated areas depending on
surface wind friction velocities, surface roughness, soil particle size distribution, soil moisture, and snow cover, as
F =αρa
g u
3
∗ X
i
1+u∗tri
u∗
1−
u2∗tr
i
u2∗
si
(1−Aveg)(1−Asnow) (1)
20
whereαis the ratio between dust flux and horizontal saltation flux,ρais the air density,
g is the gravitational constant, u∗ is the surface friction velocity, u∗tr is the threshold
ACPD
6, 4171–4211, 2006Modelling soil dust aerosol in the Bod ´el ´e
depression
I. Tegen et al.
Title Page
Abstract Introduction
Conclusions References
Tables Figures
◭ ◮
◭ ◮
Back Close
Full Screen / Esc
Printer-friendly Version
Interactive Discussion
EGU
size fractioni,Avegis the part of the area covered by vegetation, andAsnowis the part
of the area covered by snow.
Soil particle size distributions were derived from soil texture data (Zobler, 1986), assuming each texture class to be a composite of four particle size modes (clay, silt, fine sand, coarse sand). These size classes are assumed to be lognormally distributed with 5
mode diameters at 2µm, 15µm, 158µm and 720µm (Tegen et al., 2002). Enclosed
topographic depressions including the Bod ´el ´e were treated as preferential “hot-spot” source areas, and the soils in these areas were initially specified to consist of uniformly
textured particles with mode diameters of 15µm, which disaggregate into 2µm dust
particles during saltation events. Surface wind friction velocities are computed from 10
surface wind speeds and surface roughness data, assuming neutral stability conditions
u∗=u(z) κ
ln(z/z0)
, (2)
whereuis the surface wind speed at reference heightz,κ is the von Karman constant
andz0is the aerodynamic roughness length. The threshold friction velocities for
initia-tion of dust emission are computed depending on soil particle size distribuinitia-tion following 15
Marticorena and Bergametti (1995), but assuming constant surface roughness within each model gridcell. The ratios between the vertical dust and horizontal saltation fluxes
also depend on the soil texture, and range fromα=10−7cm−1for coarse sand or clay
soils, toα=10−5cm−1 in gridcells containing “hot spot” sources (Tegen et al., 2002).
Thus the size distribution of the mobilized dust depends on both the surface properties 20
and the surface wind speed.
The dust emission model has already been used with a global offline transport model
ACPD
6, 4171–4211, 2006Modelling soil dust aerosol in the Bod ´el ´e
depression
I. Tegen et al.
Title Page
Abstract Introduction
Conclusions References
Tables Figures
◭ ◮
◭ ◮
Back Close
Full Screen / Esc
Printer-friendly Version
Interactive Discussion
EGU
3.2 Box model
While dust emissions and transport during the BoDEx campaign are simulated with a regional model (see below), the observations do not provide all input parameters needed to compute dust emission fluxes for the region. In particular, the soil size distributions of the deflatable soil particles as well as the ratio of vertical dust flux to 5
horizontal saltation flux are still unknown. As full regional dust simulations for the pe-riod of the field experiment are computationally too expensive for testing more than very few parameter combinations, a box model version of the dust emission scheme
was used to test different parameterizations. The box model computes dust emissions
at the Chicha field site using the observed surface wind speeds at 2 m height that 10
were reported every 2 min. Emission fluxes (in g m−2 s−1) were computed for
parti-cles with radii between 0.1µm and 750µm divided into 24 size bins. Direct emission
flux measurements are not available for model validation, although measurements of
dust optical thicknesses (DOTs) from the different sunphotometer instruments and
re-trievals of size distributions from the Cimel sunphotometer are available. To facilitate 15
comparison with these measurements, a first-order estimate of DOTs was obtained from the computed emission fluxes with a simplified treatment of dry deposition of the emitted dust particles. When dust emission takes place in the model (i.e. when the surface wind friction velocity exceeds the threshold value during a 14-min time step),
the emitted dust is distributed homogeneously in an atmospheric column of heightH.
20
The column is divided into 6 layers of heightsH/6 each. Depending on the particle size,
dust falls back to the surface with the gravitational settling velocityvs=2ρgr9η2, whereρ
is the particle density, r is the particle radius and η is the kinematic viscosity of air.
During time steps when no dust emission takes place into the atmospheric column, dust is removed from lowest layer in addition to the gravitational settling by turbulent 25
mixing depending on the aerodynamic resistancera=κu1
∗(z)
lnzz
0
ACPD
6, 4171–4211, 2006Modelling soil dust aerosol in the Bod ´el ´e
depression
I. Tegen et al.
Title Page
Abstract Introduction
Conclusions References
Tables Figures
◭ ◮
◭ ◮
Back Close
Full Screen / Esc
Printer-friendly Version
Interactive Discussion
EGU
this removal was approximated by assuming a residence timeλ=L/(1.4u) (whereLis
varied between 200 km and 400 km) anduis the 2-m wind speed; the factor 1.4 takes
into account the increase of the wind speed with height. From these computations of dust removal we obtain size-resolved atmospheric dust mass loads, from which aerosol
optical thicknessesτat 500 nm wavelength are computed according to
5
τ=X
i
3Qext(500 nm, ri)Mi
4riρ
(3)
whereQextis the specific particle extinction efficiency,ρis the particle density andMi
is the aerosol mass load of size fractioni characterized by the effective radiusri (Lacis
and Mishchenko, 1995). In addition to computing the temporal change of DOT at the Chicha site, the volume load of each size bin is computed from the mass load to obtain 10
the volume size distribution for 4 individual time steps on days 4, 6, 7 and 9 March 2005; the results are compared to the retrieved volume size distribution from the Cimel
sunphotometer (Todd et al., 2006). The initial mixing heightH of dust during emission
events is unknown, but from initial regional model results (described below) we find that that model mixes the dust up to heights between 500 and 1000 m. The density of 15
diatomite is set to 2.1 g cm−3in agreement with the measurements (it should be noted
that a different measurement of the bulk density of the Bodele diatomite resulted in a
lower value of 0.9 g cm−3).
Alfaro et al. (1997) related the size d of dust particles that are released from soils
through saltation to the kinetic energy of the saltating particle, which is used to break up 20
the aggregates, the cohesion energyE of the kaolinite particles was found to be an
ex-ponential function of the particle sizeE=14.9e(−0.53d)
. Similarly, here we assume that the minimum size of released particles depends on the kinetic energy of the saltators, with dust released in one or two size modes. With the assumption that dust produced during BoDEx originates from breaking up of saltating diatomite flakes, we do not make 25
a-priori-assumptions for the dominant size mode of soil particles that become available
ACPD
6, 4171–4211, 2006Modelling soil dust aerosol in the Bod ´el ´e
depression
I. Tegen et al.
Title Page
Abstract Introduction
Conclusions References
Tables Figures
◭ ◮
◭ ◮
Back Close
Full Screen / Esc
Printer-friendly Version
Interactive Discussion
EGU ground, soil particle diameters of up to 5 mm were allowed in the box model to account
for the possibility of mobilization of macroscopic diatomite flakes. We assume that the mass of the produced dust is directly proportional to the mass of the saltators, and allow for one or two size modes of disaggregated dust particles in the clay and silt
size range, between 1 and 20µm. We also test reducing the kinetic energy necessary
5
for disaggregation of the saltating particles compared to the value derived in Alfaro et al. (1997) to account for possibly lower binding energies of diatomite compounds compared to clay aggregates.
The emission factorαthat related the horizontal flux of saltating particles to the
verti-cal dust flux is computed a-posteriori by verti-calibrating the model results with the observed 10
dust optical thickness, such that the mean value of aerosol optical thickness measure-ments agreed with the mean value of the DOT model results at those time intervals for which measurements were available.
We computed a statisticA(as defined in Cakmur et al., 2006) to quantify the
agree-ment between the modelled optical thickness time series and size distribution for 6 time 15
intervals at the Chicha site with the observations
A=
1
NM
P i
(XiM −XiO)
2
1 2NM
P
i
(XiM)2+P
i
(XiO)2
(4)
whereXiOare the observations,XiM are the modelled values, and the sum is over allNM
observations. A=1 indicates no agreement between the model and the observations,
whileA=0 indicates perfect agreement of model and measurements.
20
3.3 Regional model LM MUSCAT
ACPD
6, 4171–4211, 2006Modelling soil dust aerosol in the Bod ´el ´e
depression
I. Tegen et al.
Title Page
Abstract Introduction
Conclusions References
Tables Figures
◭ ◮
◭ ◮
Back Close
Full Screen / Esc
Printer-friendly Version
Interactive Discussion
EGU Wetterdienst) as meteorological driver, and the online-coupled 3-D chemistry tracer
transport model MUSCAT (MUltiScale Chemistry Aerosol Transport Model: Knoth and Wolke, 1998, Wolke und Knoth, 2000). MUSCAT is based on time-dependent mass balance equations considering chemical reactions and microphysical processes, and is used for simulations of physico-chemical and aerosol dynamic fields on the mesoscale. 5
Advection is computed by a third-order upstream scheme, temporal integration is car-ried out by an implicit-explicit method (Wolke and Knoth, 2000). Clouds, precipitation, local wind systems and mesoscale convection are computed depending on topogra-phy. The dust emission fluxes in this model are computed with surface winds and soil moisture fields from the meteorological model LM, dust is transported as passive tracer 10
in 5 independent size bins covering the size range from 0.1–25µm with the MUSCAT
tracer scheme. The aerosol deposition parameterization in LM-MUSCAT is modified to
account for dust aerosol particle density and washout efficiency. The performance of
this regional dust model so far has been tested for two well-documented events of Sa-haran dust transport to Europe in August and October 2001 (Heinold et al., submitted). 15
For the period of the BoDEx field study, a horizontal resolution of 7 km was used for
the area between the coordinates (12.60◦N; 11.63◦E), (10.30◦N; 25.00◦E), (22.17◦N;
29.08◦E), (25.09◦N; 12.10◦E), which covers the surroundings of the Chicha site as well
as a considerable area upstream, ensuring that dust transported to the field site is sim-ulated as well as the locally produced dust (Fig. 1). The model has 40 vertical layers, 20
the lowest layer reaching 68 m above ground. Surface roughness data for the regional model are derived from the POLDER bidrectional reflectance measurements
(Marti-corena et al., 2004), which are available at 1/15◦ resolution. The surface roughness
was assumed to be 0.001 cm for model gridcells where surface roughness measure-ments were not available and topography and land cover data indicate the presence 25
ACPD
6, 4171–4211, 2006Modelling soil dust aerosol in the Bod ´el ´e
depression
I. Tegen et al.
Title Page
Abstract Introduction
Conclusions References
Tables Figures
◭ ◮
◭ ◮
Back Close
Full Screen / Esc
Printer-friendly Version
Interactive Discussion
EGU
properties (extinction efficiency, single scattering albedo, and asymmetry parameter)
used to compute changes in radiative fluxes in the LM are calculated for each size bin with the refractive derived from the Cimel sunphotometer measurements taken during the Bod ´el ´e field study (Todd et al., 2006) at visible wavelengths, and from Volz (1973) at infrared wavelengths employing Mie theory based on an algorithm by Mishchenko 5
et al. (2002) (Table 1). Computed optical properties are adopted in the LM radiation scheme by spectral integration for each of the three solar and five longwave IR bands (Table 1). The change in energy fluxes is allowed to impact on the meteorology, and feeds back on dust emissions and atmospheric distributions of the dust. The BoDEx case was simulated twice in the regional model, once computing soil dust as radiatively 10
active tracer, which impacts on the meteorological fields of LM, and once without dust. LM takes into account the radiative forcing of five aerosol types in terms of constant optical thickness distributions, for these model experiments this prescribed forcing was
turned offfor the desert aerosol type.
3.4 Global emissions, offline model
15
The new parameterization for computing size resolved emissions for the Bod ´el ´e “hot
spot” dust source has been implemented into the global offline dust model, which is
described in detail in Tegen et al. (2002). Dust emissions and transport are computed with meteorological fields from the ECMWF ERA15 reanalysis. The model uses satel-lite derived surface roughness length data from microwave backscattering observations 20
(Prigent at al., 2005) as input parameter for computing global-scale dust emissions, which are available at 0.25 degree resolution for unvegetated regions. Dust emissions
were computed at 0.5◦ spatial resolution with a 6-h time step, the emission fields are
then integrated to 3.75◦
×5◦ horizontal resolution, which is the resolution of the tracer
transport model. Dust deposition is by dry and wet deposition as described in Tegen 25
et al. (2002). For the year 1987 dust emissions were computed with two different dust
ACPD
6, 4171–4211, 2006Modelling soil dust aerosol in the Bod ´el ´e
depression
I. Tegen et al.
Title Page
Abstract Introduction
Conclusions References
Tables Figures
◭ ◮
◭ ◮
Back Close
Full Screen / Esc
Printer-friendly Version
Interactive Discussion
EGU one model experiment was carried out with dust emissions from the Bod ´el ´e region from
15◦E–20◦E and 12◦N–18◦N set to zero to evaluate the contribution of Bod ´el ´e dust to
the global and regional dust optical thickness.
4 Results
4.1 Box model results
5
A series of box model experiments were carried out, in particular to evaluate which soil size and initial dust size distribution leads to agreement with the sunphotome-ter observations of aerosol optical thickness and size distribution retrievals. The size distribution from the sunphotometer retrievals is not used directly as model input, as initially deflated large particles settle quickly from the atmosphere, thus the observed 10
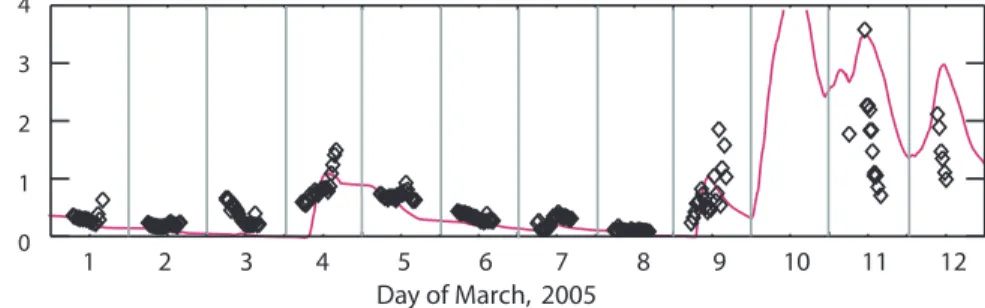
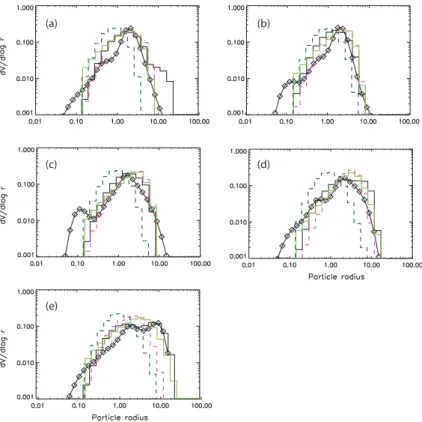
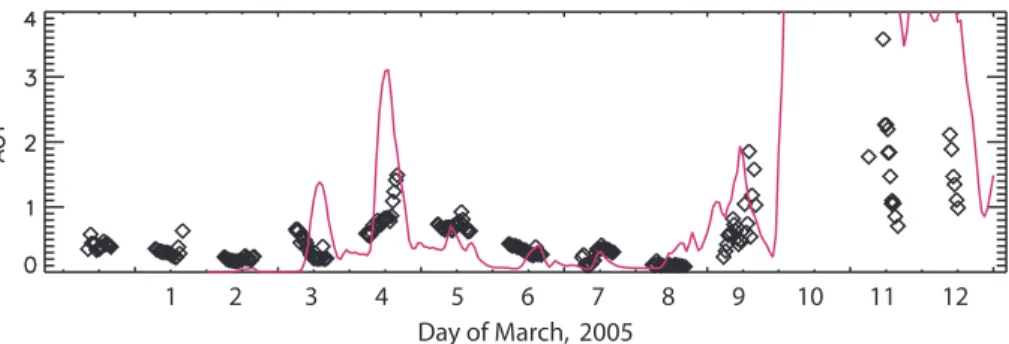
atmospheric size distribution does not necessarily reflect the initial size distribution of the deflated particles. We compare the DOT model results with measured aerosol op-tical thicknesses (Fig. 2) at the field site, and compare the modelled size distributions with retrievals derived from the Cimel sunphotometer measurements on days 4, 6, and 7 March (Fig. 3a-d). Figure 3e shows the results for 9 March, which is not used for the 15
quantitative comparison as the retrieval is unreliable at this time, but this retrieval at the beginning of the dust storm indicates a possible presence of dust particles larger
than 2µm. The retrieval at this day is problematic because it was based on the
obser-vations at higher Sun, when the possibility of stray light saturation of the sky radiances corresponding to small scattering angles. Also, later on 9 March, the presence of cir-20
rus clouds was evident, i.e. cirrus cloud contamination may be present in the inverted measurement (in general cirrus cloud presence is hard to detect from measurements
by themselves). Good agreement, with values for A ranging between 0.25 and 0.3
(computed as arithmetic mean of the agreement factorsAfor calibrated DOT and for
normalized size distributions at the 4 selected times), is obtained for a variety of param-25
ACPD
6, 4171–4211, 2006Modelling soil dust aerosol in the Bod ´el ´e
depression
I. Tegen et al.
Title Page
Abstract Introduction
Conclusions References
Tables Figures
◭ ◮
◭ ◮
Back Close
Full Screen / Esc
Printer-friendly Version
Interactive Discussion
EGU
and dust size modes for combinations of particle radii between 1 and 15µm. In
con-trast, the agreement between box model results and observations is worse for the size parameterization from Tegen et al. (2002) (see Sect. 3.1), with a “best” minimum value
ofA=0.41. The agreement is generally better for cases where the aggregate binding
energy of the particles and thus the kinetic energy of the saltators that is necessary to 5
enable the release of the fine dust are reduced by about one order of magnitude com-pared to the value derived for kaolinite aggregates in Alfaro et al. (1997). A parameter
combination that give good agreement (A=0.26) is for soil particle size of 100µm, dust
sizes of 1µm (30%) and 10µm (70%), and kinetic energy required to release fine dust
reduces by the factor of 20 compared to Alfaro et al. (1997) (Figs. 2 and 3). The DOT 10
(Fig. 2) agrees well for all days except on the afternoon of 9 March, when the model results lie below the sunphotometer retrievals. Observations indicated the presence of cirrus clouds at that time, which may have led to an overestimate in aerosol optical thickness retrievals. Similarly good agreement is found when assuming a mono-modal
dust size distribution with a mode radius at 1µm, but a larger geometric standard
de-15
viation of 3 compared to the value of 2 in the original parameterization of the size
distribution (A=0.25) (Fig. 3). The comparison between modelled and retrieved size
distribution clearly shows that parameterization for dust production in hot spot areas following Tegen et al. (2002) leads to dust size modes which are too small compared to
the observations (Fig. 3). Still, the results remain similar for different parameterizations
20
of soil properties.
While the results shown in Figs. 2 and 3 were derived using the wind speed measure-ments that were taken during the field experiment, we use the box model also to test the performance of the surface wind speeds from the regional model LM. The com-parison of surface wind speed observations and hourly LM model results computed 25
ACPD
6, 4171–4211, 2006Modelling soil dust aerosol in the Bod ´el ´e
depression
I. Tegen et al.
Title Page
Abstract Introduction
Conclusions References
Tables Figures
◭ ◮
◭ ◮
Back Close
Full Screen / Esc
Printer-friendly Version
Interactive Discussion
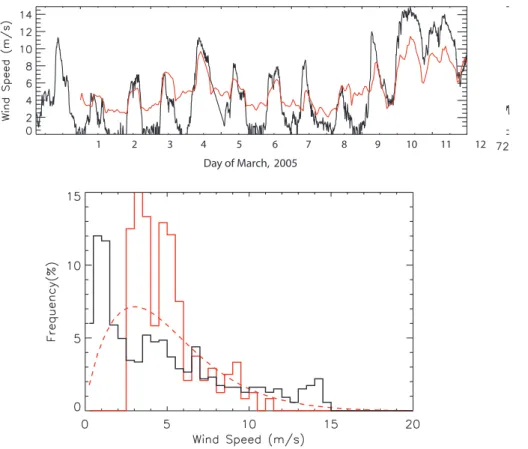
EGU modelled wind speed data (Fig. 4b) supports the finding that neither the minimum nor
maximum wind speeds are matched by the model, even with the high spatial resolution
of 7 km. The maximum model wind speeds in the LM do not exceed 11.5 m s−1, while in
ca. 15% of the time intervals during the BoDEx period the measured 2-m wind speeds
are above 10 m s−1
. Even at this high resolution, the error in modelled surface wind 5
speeds is causing errors in the dust emission computation for the dust storm days, since the dependence of dust emission on surface wind speeds is highly non-linear.
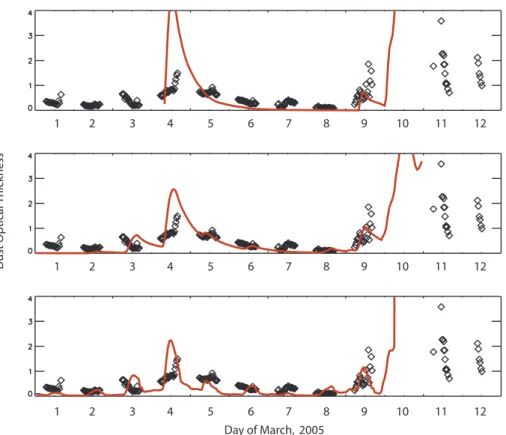
We simulated dust emissions with the box model using hourly 10-m wind speeds from the LM regional model in addition to the computations using the observed winds
(Fig. 5). As above, the emission factor α was chosen such that average dust optical
10
thicknesses from the model matched observations for those times when measurements were available. Because of the low maximum LM wind speeds, the computation of dust emissions directly with the LM winds rather than with the observed wind speeds produces a DOT time series that is mismatched compared to the observations (Fig. 5a). In order to match average DOT, the model produces much too high optical thickness 15
on 4 March compared to the observations, while being too low between this event and the dust storm staring on 9 March. Also, the increase in dust optical thicknesses during the strong dust event on 9 March starts too late in the model when compared to the observations. Using lower threshold velocities for initiation of dust emissions improves the model results compared to the observations. For the current event we find that 20
the use threshold friction velocities lowered by a factor of 0.66 results in a DOT time series that matches the observations satisfactorily (Fig. 5b). This approach to account for underestimation of maximum wind speeds had been used in the global dust model in Tegen et al. (2004) and Prigent et al. (2005), where threshold friction velocity for dust emission was lowered to a value that ensured agreement of the number of dust 25
events in the model with globally observed dust storm frequencies (Engelstaedter et
al., 2003). As a different approach to account for the underestimation of peak wind
ACPD
6, 4171–4211, 2006Modelling soil dust aerosol in the Bod ´el ´e
depression
I. Tegen et al.
Title Page
Abstract Introduction
Conclusions References
Tables Figures
◭ ◮
◭ ◮
Back Close
Full Screen / Esc
Printer-friendly Version
Interactive Discussion
EGU subgriscale variability of surface winds (Lunt and Valdes, 2002; Cakmur et al., 2003).
Grini et al. (2005) use a Weibull probability distribution for surface wind speed which is
described by a shape factork=0.94·u−2and a scale factor c=u/Γ(1+1/k) where u is
the surface wind speed at 10 m andΓis the Gamma function. We tested the emission
model assuming this Weibull probability distribution for the modelled surface winds 5
(Fig. 5c). The resulting modelled dust optical thicknesses match the observations well for the most part of the BoDEx period, but increase to unrealistically high DOT values of more than 100 for the strong dust event after 9 March, which indicates that the
subgridscale variability of high surface wind speeds (above 11 m s−1) does not follow
the same type of Weibull distribution as for lower wind speeds. 10
4.2 Regional model results
The emission parameterization in the regional dust model was chosen such that the size of saltating particles was represented by a lognormal mono-modal size distribution
represented by a 100µm mode radius. The particles degrade during saltation into
smaller dust particles consisting of 70% particles with a mode radius of 10µm, and
15
30% particles with 1µm mode radius. To account for the underestimation of peak
wind speeds in the model, the threshold friction velocity was lowered by 0.66, and we assumed a 20-fold smaller kinetic energy needed to break up the saltating diatomite particles compared to the results from Alfaro et al. (1997) derived for break-up of clay
aggregates. The particle density was set to a value of 2 g cm−3.
20
While aerosol retrievals by remote sensing over the highly reflecting desert surface
are difficult, MODIS true colour images are available for the BoDEx period for the Chad
region (Fig. 6, top). Dust can by distinguished by white streaks in these images on the days 4 March, 9 March and 10–12 March, while on 8 March the low atmospheric dust contents allows the diatomite layer to be distinguished towards the lower right part of 25
ACPD
6, 4171–4211, 2006Modelling soil dust aerosol in the Bod ´el ´e
depression
I. Tegen et al.
Title Page
Abstract Introduction
Conclusions References
Tables Figures
◭ ◮
◭ ◮
Back Close
Full Screen / Esc
Printer-friendly Version
Interactive Discussion
EGU Comparing the DOTs simulated with the regional model for the BoDEx events shows
reasonable agreement between the model and measurements (Fig. 7). On 4 March, dust emissions are overestimated by the model, and the strong increase in DOT on 10 March occurs too early in the model. The overestimate of dust optical thickness on 4 March indicates a possible overcompensation of the adjustment of the wind speed 5
threshold on this day, and shows the need for improvement in the computation of wind friction velocities in this region. The overestimation of night-time wind speeds in LM
does not affect the dust emissions, since the threshold friction velocity for initiating dust
emission is not reached. The total dust emission for the days with the strongest dust
emission, 10 to 12 March computed by the regional model is 104 g m−2at the Chicha
10
site. In comparison, Todd et al. (2006) estimate an emission of 324 g m−2
(±40%) for
those days from the Cimel sunphotometer retrievals of dust volume and assuming the
total exposed diatomite layer of∼10.8×10⁹m2 equally contributes to dust production.
The discrepancy of the emission estimates can be partly explained by the underesti-mate of the maximum wind speeds in the model, and the uncertainty of the assumption 15
that the whole diatomite layer is equally effective in producing dust aerosol.
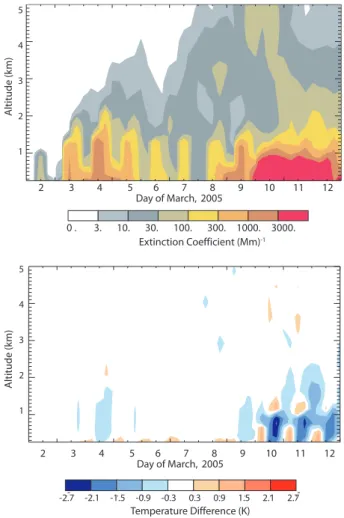
The change with time of the vertical distribution of the dust extinction from the model at the Chicha site is shown in Fig. 8a. During emission events dust is mixed up to ap-proximately 1 km into the atmosphere. The temperature change due to dust (Fig. 8b)
computed as difference in modelled LM temperature for the case where dust is
ra-20
diatively interactive and the LM results without dust added as radiatively active tracer shows a distinct cooling at daytime at the lower part of the dust cloud for the dust storm days. At night-time, dust causes a slight warming in the order of 1K near the surface due to its absorption of outgoing thermal radiation.
The difference between net radiation fluxes for the model case including dust
radia-25
tive forcing and the case without dust impact on radiation depends on the dust optical
thickness itself, at the Chicha site the computed net radiative flux difference changes
from −9.2 W m−2 on 8 March, 12:00 UTC when dust was low, to −219.3 W m−2 on
ACPD
6, 4171–4211, 2006Modelling soil dust aerosol in the Bod ´el ´e
depression
I. Tegen et al.
Title Page
Abstract Introduction
Conclusions References
Tables Figures
◭ ◮
◭ ◮
Back Close
Full Screen / Esc
Printer-friendly Version
Interactive Discussion
EGU
two experiments increased from−44.7 to−511.6 W m−2. The modelled change in
sur-face solar radiation of 590 W m−2 between these days is in good agreement with the
decrease by 562 W m−2
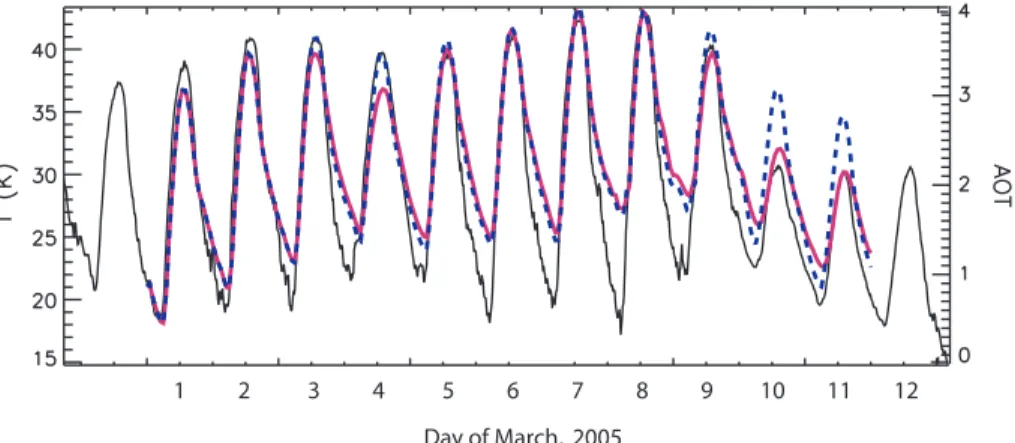
of the measured solar radiation fluxes, considering the uncer-tainties in these measurements. If dust aerosol is included and the radiative forcing by dust permitted to influence model temperatures, we find that the measured day-5
time temperatures and their change with time is much better matched compared to the model results without dust forcing (Fig. 9). We directly compare the surface tempera-tures from the regional model and the measurements taken at the field site. Between the days 8 March and 10 March – before and after the start of the dust storm – the max-imum daytime temperature decreases by about 12 K. In the model run without radiative 10
forcing by dust, the maximum temperature decrease between these days is only 6 K lower than the observations. In contrast, the 11 K temperature decrease for the model run which includes dust forcing agrees with the observation (Fig. 9). Thus, the forcing by dust aerosol accounts for about half of the observed temperature decrease for the dust storm event, confirming the assumption stated by Todd et al. (2006). The over-15
estimate of night-time temperatures by both model experiments may be caused by the inability of the models to produce a well defined boundary layer. The maximum night-time increase and maximum daynight-time decrease of 2-m temperatures for the model run including dust at the Chicha location compared to DOT (Fig. 10) indicate that dust opti-cal thicknesses above 0.5 do not lead to a further increase in night-time temperatures, 20
while the daytime maximum reduction in modelled surface temperatures caused by dust is nearly linearly dependent on the DOT.
4.3 Global model results
It is still unclear to what extent the parameterization used for the dust emission from the Bod ´el ´e can be extrapolated to other “hot spot” dust emission regions. However, when 25
ACPD
6, 4171–4211, 2006Modelling soil dust aerosol in the Bod ´el ´e
depression
I. Tegen et al.
Title Page
Abstract Introduction
Conclusions References
Tables Figures
◭ ◮
◭ ◮
Back Close
Full Screen / Esc
Printer-friendly Version
Interactive Discussion
EGU
dust emissions increase by about a factor of 2 from 1600 Mt year−1to 3000 Mt year−1
compared to the old parameterization. However, this increase mostly occurs in the
particle size range between 10 and 1000µm radius, while emission fluxes of smaller
particles, which can be transported over large distances, remain nearly the same com-pared to the earlier parameterization. The modelled optical thickness distribution and 5
concentration of far-travelled dust is therefore not greatly affected by implementing the
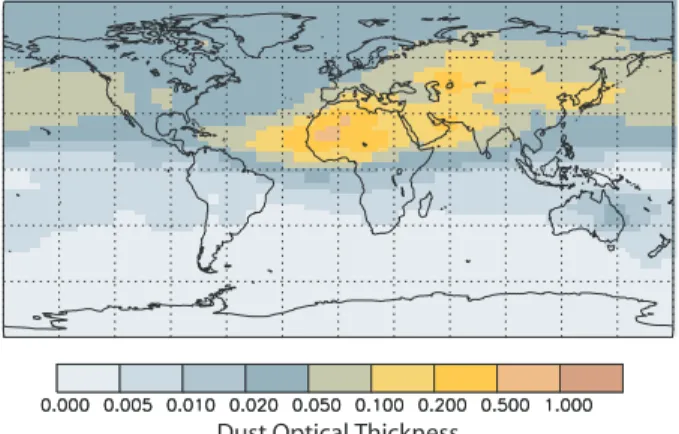
new parameterization on the global scale beyond the immediate regions containing large dust hot spots (Fig. 11). To test the contribution of the dust from the Bod ´el ´e region to the total dust emerging from North African sources, we compare two model runs for the example year 1987, with dust emissions from the Bod ´el ´e area set to zero in 10
15◦E–20◦E and 12◦N–18◦N. The percent difference in dust optical thickness for these
two experiments (Fig. 12) show that Bod ´el ´e dust plays an important role in the south-ern Sahara, the Sahel, the Gulf of Guinea and equatorial Atlantic and the Amazon basin in all seasons except northern Hemisphere summer. At that time, the peak wind
speeds in the global model are not sufficient to produce large amounts of dust. This
15
seasonal cycle is consistent with observations of dust plumes from MODIS and TOMS AOT climatology (Washington and Todd, 2005). It should be noted that the contribu-tion of Bod ´el ´e dust transported south-westward over the Sahel is particularly strong in the northern hemisphere winter months, at the same time when widespread biomass burning occurs in the savannah regions. Thus, mixtures of dust particles and biomass 20
smoke in this region may actually contain a considerable amount of diatomite particles,
which can have considerably different surface properties compared to quartz/clay
ag-gregates. Over most of the North Atlantic Ocean, where highest dust concentrations are found, dust from the more western regions of the Sahara like Mauritania dominate over the contribution from Bod ´el ´e dust. For example, at the Cape Verde Islands, where 25
ACPD
6, 4171–4211, 2006Modelling soil dust aerosol in the Bod ´el ´e
depression
I. Tegen et al.
Title Page
Abstract Introduction
Conclusions References
Tables Figures
◭ ◮
◭ ◮
Back Close
Full Screen / Esc
Printer-friendly Version
Interactive Discussion
EGU be further investigated.
5 Discussion and conclusions
We used a dust emission model combined with different transport models to interpret
the first results from the BoDEx field experiment from March 2005. While uncertainties in the parameterization of input parameters of the dust emission model remain for this 5
region, we summarize our findings as follows:
1. Emissions from the diatomite deposits in the Bod ´el ´e depression computed with the emission model by Marticorena and Bergametti (1995) result in dust aerosol optical thicknesses and size distributions that are consistent with the retrievals by sunphotometers during the BoDEx campaign. Discrepancies between model and 10
observations can mostly be attributed to deficiencies in the surface wind speed in the regional model LM in the Bodele area. The size distribution of particles released by the saltation of diatomite flakes was derived considering the kinetic energy of the saltating particles similar to Alfaro et al. (1997), where the assump-tion of smaller binding energy of the particles by about one order of magnitude 15
compared to the clay aggregates from that publication gave a better agreement with the observation. Ultimately it will be necessary to develop a new scheme to fully describe the process of self-abrasion of mobilized diatomite flakes, which are disaggregating into fine dust particles when colliding with each other or impact onto the ground.
20
2. Global model results assuming that all preferential sources can be parameterized identically indicate that dust from the Bod ´el ´e depression contributes up to 40% of dust optical thickness over the tropical Atlantic, and higher than 50% in the Sa-hel region in the northern hemisphere winter months, when mixing with biomass
smoke can be expected. This is of particular interest as diatomite has different
25
ACPD
6, 4171–4211, 2006Modelling soil dust aerosol in the Bod ´el ´e
depression
I. Tegen et al.
Title Page
Abstract Introduction
Conclusions References
Tables Figures
◭ ◮
◭ ◮
Back Close
Full Screen / Esc
Printer-friendly Version
Interactive Discussion
EGU much more strongly with atmospheric gases and cloud water. In addition, dust
from the Bod ´el ´e may play an important role for fertilizing the Amazon rain forest. The contribution of the Bodele dust to the optical thickness of the northern Atlantic dust is small.
3. Diatomite deposits are highly reflective at solar wavelengths resulting in high sin-5
gle scattering albedo of dust from this area (Todd et al., 2006). However, these optical properties are not necessarily representative for dust from other regions of the Sahara that may have higher content of iron oxides and clay minerals, and dominate large parts of dust optical thickness over North Africa and the North Atlantic Ocean outside of the tropics. The extent to which the magnitude of this 10
contribution depends on the global model itself needs to be explored.
4. The Bod ´el ´e dust event could be reasonable well reproduced by the regional model, although peak wind speeds were lower than the measurements even with the high spatial resolution of 7 km. More attention will have to be given to turbu-lent mixing in the boundary layer in the regional model. Model results show that 15
during the dust storm dust causes a daytime temperature reduction of about 5 K between 8 March before, and 10 March after the start of the dust storm. This ac-counts for about half of the temperature decrease measured in the field during this
time period. This radiative effect of the dust aerosol is stabilizing the atmosphere,
and feedback on dust production itself will be further investigated in a forthcoming 20
publication.
Dust from the Bod ´el ´e, which probably has a large contribution of diatomite particles,
may have quite different surface properties compared to dust observed in e.g. the
northern Sahara, which is mostly described by a mixture of clay aggregates. It may
have different radiative properties, and have different effects on atmospheric chemistry
25
and cloud formation compared to the usual clay and quartz compounds. The role of
ACPD
6, 4171–4211, 2006Modelling soil dust aerosol in the Bod ´el ´e
depression
I. Tegen et al.
Title Page
Abstract Introduction
Conclusions References
Tables Figures
◭ ◮
◭ ◮
Back Close
Full Screen / Esc
Printer-friendly Version
Interactive Discussion
EGU should be further clarified in upcoming field experiments with focus on Saharan dust,
like the SAMUM field experiment which will take place in 2006 in Morocco.
Acknowledgements. The research was partly supported by the DFG (German Science Foun-dation) in the framework of SAMUM. The Royal Geographical Society Gilchrist Educational trust provided funding for the field campaign. A. Wilson of the Centre for Ecology and Hydrol-5
ogy, UK kindly supplied the Cimel instrument for this project; NERC EPFS and NASA GSFC are acknowledged for providing the Microtops instruments. We thank R. Wolke for help with the model development.
References
Alfaro, S., Gaudichet, A., Gomes, L., and Maill ´e, M.: Modeling the size distribution of a soil 10
aerosol produced by sandblasting, J. Geophys. Res., 102, 11 239–11 249, 1997.
Ansmann, A., Mattis, I., M ¨uller, D., Wandinger, U., Radlach, M., Althausen, D.,
and Damoah, R.: Ice formation in Saharan dust over central Europe observed
with temperature/humidity/aerosol Raman lidar, J. Geophys. Res., 110, D18S12,
doi:10.1029/2004JD005000, 2005. 15
Bonasoni, P., Cristofanelli, P., Calzolari, F., Bonafe, U., Evangelisti, F., Stohl, A., Sajani, S. Z., van Dingenen, R., Colombo, T., and Balkanski, Y.: Aerosol-ozone correlations during dust transport episodes, Atmos. Chem. Phys., 4, 1201–1215, 2004.
Cakmur, R. V., Miller, R. L., and Torres, O.: Incorporating the effect of small scale
circulations upon dust emission in an AGCM, J. Geophys. Res., 109, D07201, 20
doi:10.1029/2003JD004067, 2004.
Cakmur, R. V., Miller, R. L., Perlwitz, J., Geogdzhayev, I. V., Ginoux, P., Koch, D., Kohfeld, K. E., Tegen, I., and Zender C. S.: Constraining the global dust emission and load by
mini-mizing the difference between the model and observations, J. Geophys. Res., 111, D06207,
doi:10.1029/2005JD005791, 2006. 25
Chadwick, L. A., Derry, O. A., Vitousek, P. M., Huebert, B. J., and Hedin, L. O.: Changing sources of nutrients during four million years of ecosystem development, Nature, 397, 491– 497, 1999.
Coe, M. T.: A linked global model of terrestrial hydrologic processes: Simulation of modern rivers, lakes, and wetlands, J. Geophys. Res., 103, 8885–8899, 1998.
ACPD
6, 4171–4211, 2006Modelling soil dust aerosol in the Bod ´el ´e
depression
I. Tegen et al.
Title Page
Abstract Introduction
Conclusions References
Tables Figures
◭ ◮
◭ ◮
Back Close
Full Screen / Esc
Printer-friendly Version
Interactive Discussion
EGU
Damnati, B.: Holocene lake records in the Northern Hemisphere of Africa, J. of African Earth Sci., 31(2), 253–262, 2000.
Dentener, F. J., Carmichael, G. R., Zhang, Y., Lelieveld, J., and Crutzen, P. J.: Role of mineral aerosol as reactive surface in the global troposphere, J. Geophys. Res., 101, 22 869–22 889, 1996.
5
Doms, G. and Sch ¨attler, U.: The nonhydrostatic limited area model LM (Lokal Modell) of DWD: Part1: Scientific Documentation, DWD, GB Forschung und Entwicklung, 1999.
Dubovik, O. and King, M. D.: A flexible algorithm for retrieval of aerosol optical properties from sun and sky radiance measurements, J. Geophys. Res., 105, 20 673–20 696, 2000.
Dubovik, O., Holben, B. N., Eck, T. F., Smirnov, A., Kaufman, Y. J., King, M. D., Tanr ´e, D., and 10
Slutsker, I.: Variability of absorption and optical properties of key aerosol types observed in worldwide locations, J. Atmos. Sci., 59, 590–608, 2002a.
Dubovik, O., Holben, B. N., Lapyonok, T., Sinyuk, A., Mishchenko, M. I., Yang, P., and Slutsker, I.: Non-spherical aerosol retrieval method employing light scattering by spheriods, Geophys. Res. Lett., 29, 54-1–54-4, 2002b.
15
Dubovik, O., Sinyuk, A., Lapyonok, T., Holben, B. N., Mishchenko, M., Yang, P., Eck, T. F., Volten, H., Munoz, O., Veihelmann, B., van der Zande, W. J., Leon, J.-F., Sorokin, M., and Slutsker, I.: The application of spheroid models to account for aerosol particle non-sphericity in remote sensing of desert dust, J. Geophys. Res., in press, 2006.
Engelstaedter, S., Kohfeld, K. E., Tegen, I., and Harrison, S. P.: Controls of dust emissions 20
by vegetation and topographic depressions: An evaluation using dust storm frequency data, Geophys. Res. Lett., 30(6), 1294, doi:10.1029/2002GL016471, 2003.
Giles, J.: The dustiest place on Earth, Nature, 434, 816–819, 2005.
Gillette, D.: A wind tunnel simulation of the erosion of soil: Effect of soil texture, sandblasting,
wind speed, and soil consolidation on dust production, Atmos. Environ., 12, 1735–1743, 25
1978.
Ginoux, P., Chin, M., Tegen, I., Prospero, J., Holben B., Dubovik O., and Lin, S.-J.: Global simulation of dust in the troposphere: Model description and assessment, J. Geophys. Res., 106, 20 255–20 273, 2001.
Goudie, A. and Middleton, N.: Saharan dust storms: Nature and consequences, Earth-Sci. 30
Rev., 56, 179–204, 2001.
Grini, A., Myhre, G., Zender, C. S., and Isaksen, I. S.: Model simulations of dust sources and
ACPD
6, 4171–4211, 2006Modelling soil dust aerosol in the Bod ´el ´e
depression
I. Tegen et al.
Title Page
Abstract Introduction
Conclusions References
Tables Figures
◭ ◮
◭ ◮
Back Close
Full Screen / Esc
Printer-friendly Version
Interactive Discussion
EGU
Geophys. Res., 110, D02205, doi:10.1029/2004JD005037, 2005.
Haywood, J. M., Francis, P., Osborne, S., Glew, M., Loeb, N., Highwood, E., Tanr ´e, D., Myhre,
G., Formenti, P., and Hirst, R.: Radiative properties and direct radiative effect of Saharan
dust measured by the C-130 aircraft during SHADE: 1. Solar spectrum, J. Geophys. Res., 108, 8577, doi:10.1029/2002JD002687, 2003.
5
Haywood, J. M., Allan, R. P., Culverwell, I., Slingo, T., Milton, S., and Edwards, J.: Can desert dust explain the outgoing longwave radiation anomaly over the Sahara during July 2003?, J. Geophys. Res., 110, D05105, doi:10.1029/2004jd005232, 2005.
Herman, J. R., Bhartia, P. K., Torres, O., Hsu, C., Seftor, C., and Celarier, E.: Global distribution of UV-absorbing aerosols from Nimbus 7/TOMS data, J. Geophys. Res., 102, 16 911–16 922, 10
1997.
Holben, B. N., Eck, T. F., Slutsker, I., Tanre, D., Buis, J. P., Setzer, A., Vermote, E., Reagan, J. A., Kaufman, Y., Nakajima, T., Lavenu, F., Jankowiak, I., and Smirnov, A.: AERONET – A federated instrument network and data archive for aerosol characterization, Rem. Sens. Environ., 66, 1–16, 1998.
15
IPCC (Intergovernmental Panel on Climate Change): Radiative forcing of climate change, in: Climate Change 2001, Cambridge Univ. Press, New York, Cambridge University Press, 2001.
Jickells, T. D, An, Z. S., Andersen, K. K., Baker, A. R., Bergametti, G., Brooks, N., Cao, J. J., Boyd, P. W., Duce, R. A., Hunter, K. A., Kawahata, H., Kubilay, N., LaRoche, J., Liss, 20
P. S., Mahowald, N. M., Prospero, J. M., Ridgwell, A. J., Tegen, I., and Torres, R.: Global iron connections between desert dust, ocean biogeochemistry, and climate, Science, 308, 67–71, 2005.
Knoth, O. and Wolke, R.: An explicit-implicit numerical approach for atmospheric chemistry-transport modelling, Atmos. Environ., 32, 1785–1797, 1998.
25
Lacis, A. A. and Mishchenko, M. I.: Climate forcing, climate sensitivity, and climate response: A radiative modeling persepctive on atmospheric aerosols, in: Aerosol Forcing of Climate: Report of the Dahlem Workshop on Aerosol Forcing of Climate, Berlin 1994, April 24–29, edited by: Charlson, R. J. and Heintzenberg, J., John Wiley Sons, Chichester, England/New York, 1995.
30
Lu, H. and Shao, Y.: A new dust model for dust emission by saltation bombardment, J. Geophys. Res., 104, 16 827–16 841, 1999.
obser-ACPD
6, 4171–4211, 2006Modelling soil dust aerosol in the Bod ´el ´e
depression
I. Tegen et al.
Title Page
Abstract Introduction
Conclusions References
Tables Figures
◭ ◮
◭ ◮
Back Close
Full Screen / Esc
Printer-friendly Version
Interactive Discussion
EGU
vations and study of sensitivities, J. Geophys. Res., 107, doi:10.1029/2002JD00231, 2002. Mahowald, N. M., Baker, A. R., Bergametti, G., Brooks, N., Due, R. A., Jickells, T. D., Kubilay,
N., Prospero, J. M., and Tegen, I.: The atmospheric global dust cycle and iron inputs to the ocean, Global Biogeochem. Cycles, 19, GB4030, doi:10.1029/2005GB002541, 2005. Marticorena, B. and Bergametti, G.: Modeling the atmospheric dust cycle: 1. Design of a soil-5
derived dust emission scheme, J. Geophys. Res., 100, 16 415–16 430, 1995.
Marticorena, B., Bergametti, G., Aumont, B., Callot, Y., N’Doume, C., and Legrand, M.: Mod-eling the atmospheric dust cycle: 2. Simulation of Saharan dust sources, J. Geophys. Res., 102, 4387–4404, 1997.
Marticorena, B., Chazette, P., Bergametti, G., Dulac, F., and Legrand, M.: Mapping the aero-10
dynamic roughness length of desert surfaces from the POLDER/ADEOS bi-directional re-flectance product, Int. J. Rem. Sens., 25, 603–626, 2004.
Martin, J. H.: Glacial-Interglacial CO2 Change: The Iron Hypothesis, Paleoceanography, 5, 1–13, 1990.
Miller, R., Tegen, I., and Perlwitz, J.: Surface radiative forcing by soil dust aerosols and the 15
hydrologic cycle, J. Geophys. Res., 109, D04203, doi:10.1029/2003JD004085, 2004. Mishchenko, M. I., Travis, L. D., and Lacis, A. A.: Scattering, absorption, and emission of light
by small particles, Cambridge University Press, Cambridge, UK, 2002.
Myhre, G. and Stordal, F.: Global sensitivity experiments of the radiative forcing due to mineral aerosols, J. Geophys. Res., 106, 18 193–18 204, 2001.
20
N’Tschayi Mbourou, G., Bertrand, J. J., and Nicholson, S. E.: The diurnal and seasonal cycles of wind-borne dust over Africa north of the equator, J. Appl. Meteorol., 36(7), 868–882, 1997.
Moody, E. G, King, M. D., Platnick, S., Schaafa, C. B., and Gao, F.: Spatially complete global spectral surface albedos: Value-added datasets derived from terra MODIS land products, 25
IEEE Trans. Geosci. Rem. Sens., 43, 144–158, 2005.
Okin, G. S., Mahowald, N., Chadwick, O. A., and Artaxo, P.: Impact of desert dust on the biogeochemistry of phosphorus in terrestrial ecosystems, Global Biogeochem. Cycles, 18, GB2005, doi:10.1029/2003GB002145, 2004.
Perlwitz, J., Tegen, I., and Miller, R.: Interactive soil dust aerosol model in the GISS GCM. Part 30
I: Sensitivity of the soil dust cycle to radiative properties of dust aerosols, J. Geophys. Res., 106, 18 167–18 192, 2001.
ACPD
6, 4171–4211, 2006Modelling soil dust aerosol in the Bod ´el ´e
depression
I. Tegen et al.
Title Page
Abstract Introduction
Conclusions References
Tables Figures
◭ ◮
◭ ◮
Back Close
Full Screen / Esc
Printer-friendly Version
Interactive Discussion
EGU
roughness length in arid and semi-arid regions over the globe with the ERS scatterometer, J. Geophys. Res., 110, D09205, doi:10.1029/2004JD005370, 2005.
Prospero, J. M., Ginoux, P., Torres, O., Nicholson, S. E., and Gill, T. E.: Environmental char-acterization of global sources of atmospheric soil dust identified with the NIMBUS 7 TOMS absorbing aerosol product, Rev. Geophys., 40, 1002, doi:10.1029/2000RG000095, 2002. 5
Prospero, J. M. and Lamb, P. J.: African droughts and dust transport to the Caribbean: Climate change implications, Science, 302, 1024–1027, 2003.
Schuster, M., Roquin, C., Duringer, P., Brunet, M., Caugy, M., Fontugne, M., Mackaye, H. T., Vignaud, P., and Ghienne, J. F.: Holocene Lake Mega-Chad palaeoshorelines from space, Quatern. Sci. Rev., 24, 1821–1827, 2005.
10
Seinfeld, J. H. and Pandis, S. N.: Atmospheric Chemistry and Physics: From Air Pollution to Climate Change, John Wiley, New York, 1997.
Stier, P., Feichter, J., Kinne, S., Kloster, S., Vignati, E., Wilson, J. D., Ganzeveld, L., Tegen, I., Werner, M., Balkanski, Y., Schulz, M., Boucher, O., Minikin, A., and Petzold, A.: The aerosol-climate model ECHAM5-HAM, Atmos. Chem. Phys., 5, 1125–1156, 2005.
15
Tegen, I., Harrison, S. P., Kohfeld, K. E., Prentice, I. C., Coe, M. C., and Heimann, M.: Impact of vegetation and preferential source areas on global dust aerosol: Results from a model study, J. Geophys. Res., 107, 4576, doi:10.1029/2001JD000963, 2002.
Tegen, I., Werner, M., Harrison, S. P., and Kohfeld, K. E.: Relative importance of climate and land use in determining present and future global soil dust emission, Geophys. Res. Lett., 20
31, L05105, doi:10.1029/2003GL019216, 2004.
Todd, M. C., Washington, R., Martins, V., Lizcano, G., Dubovik, O., M’Bainayel, S., and Engel-staedter, S.: Properties of mineral dust from the Bod ´el ´e depression, Northern Chad during BodEx 2005, J. Geophys. Res., in press, 2006.
Volten, H., Munoz, O., Rol, E., de Haan, J. F., Vassen, W., Hovenier, J. W., Muinonen, K., and 25
Nousiainen, T.: Scattering matrices of mineral aerosol particles at 441.6 nm and 632.8 nm, J. Geophys. Res., 106, 17 375–17 401, 2001.
Volz, F. E.: Infrared Optical Constants of Ammonium Sulfate, Sahara Dust, Volcanic Pumice, and Flyash, Appl. Opt., 12, 564–568, 1973.
Washington, R. W., Todd, M. C., Middleton, N., and Goudie, A. S.: Dust-storm source areas de-30
termined by the total ozone monitoring spectrometer and surface observations, Ann. Assoc. Amer. Geogr., 93, 297–313, 2003.
ACPD
6, 4171–4211, 2006Modelling soil dust aerosol in the Bod ´el ´e
depression
I. Tegen et al.
Title Page
Abstract Introduction
Conclusions References
Tables Figures
◭ ◮
◭ ◮
Back Close
Full Screen / Esc
Printer-friendly Version
Interactive Discussion
EGU
Bodele Depression, Chad: The role of the low level jet, Geophys. Res. Lett., 32, L17701, doi:10.1029/2005GL023597, 2005.
Washington, R., Todd, M. C., Engelstaedter, S., M’bainayel, S., and Mitchell, F.: Dust and the Low Level Circulation over the Bod ´el ´e Depression, Chad: Observations from BoDEx 2005, J. Geophys. Res., 111, D03201, doi:10.1029/2005JD006502, 2006.
5
Wolke, R. and Knoth, O.: Implicit-explicit Runge-Kutta methods applied to atmospheric chemistry-transport modelling, Env. Mod. and Software, 15, 711–719, 2000.
Wurzler, S., Reisin, T. G., and Levin, Z.: Modification of mineral dust particles by cloud
process-ing and subsequent effects on drop size distributions, J. Geophys. Res., 105, 4501–4512,
2000. 10
Zender, C., Newman, D., and Torres, O.: Spatial Heterogeneity in aerolian erodibility: Uniform, topographic, geomorphic, and hydrologic hypotheses, J. Geophys. Res., 108(D17), 4543, doi:10.1029/2002JD003039, 2003.
Zobler, L.: A world soil file for global climate modeling, Tech. Rep. NASA TM-87802, 32 pp., NASA, Washington, D.C., 1986.
ACPD
6, 4171–4211, 2006Modelling soil dust aerosol in the Bod ´el ´e
depression
I. Tegen et al.
Title Page
Abstract Introduction
Conclusions References
Tables Figures
◭ ◮
◭ ◮
Back Close
Full Screen / Esc
Printer-friendly Version
Interactive Discussion
EGU Table 1. Optical properties of the dust particles used in the regional model LM-MUSCAT for
the 5 size bins.
Spectral Interval Effective radius Qeff ω0 g
(µm) (µm)
ACPD
6, 4171–4211, 2006Modelling soil dust aerosol in the Bod ´el ´e
depression
I. Tegen et al.
Title Page
Abstract Introduction
Conclusions References
Tables Figures
◭ ◮
◭ ◮
Back Close
Full Screen / Esc
Printer-friendly Version
Interactive Discussion
EGU Fig. 1. Location of the field site “Chicha” in the Bod ´el ´e depression, Chad. The domain of the
ACPD
6, 4171–4211, 2006Modelling soil dust aerosol in the Bod ´el ´e
depression
I. Tegen et al.
Title Page
Abstract Introduction
Conclusions References
Tables Figures
◭ ◮
◭ ◮
Back Close
Full Screen / Esc
Printer-friendly Version
Interactive Discussion
EGU
4
3
2
1
0
AO
T
1 2 3 4 5 6 7 8 9 10 11 12 Day of March, 2005
ACPD
6, 4171–4211, 2006Modelling soil dust aerosol in the Bod ´el ´e
depression
I. Tegen et al.
Title Page
Abstract Introduction
Conclusions References
Tables Figures
◭ ◮
◭ ◮
Back Close
Full Screen / Esc
Printer-friendly Version
Interactive Discussion
EGU
(a) (b)
(c) (d)
(e)
Fig. 3. Size distribution for date and times in March 2005: 4 March, 06:30 UTC(a); 6 March,
07:40 UTC(b); 7 March, 07:40 UTC(c); 7 March, 14:17 UTC(d); 9 March, 09:58 UTC(e).
Comparison of Cimel retrievals (symbols) with the size distribution from the best result from
box model with (i) dust sizes modes of 1 and 10µm radius and geometric standard deviation
of 2, (black histograms); (ii) one dust size mode at 1µm radius but with a geometric standard