www.atmos-chem-phys.org/acp/4/351/
SRef-ID: 1680-7324/acp/2004-4-351
Chemistry
and Physics
The vertical distribution of aerosols, Saharan dust and cirrus clouds
in Rome (Italy) in the year 2001
G. P. Gobbi, F. Barnaba, and L. Ammannato
Istituto di Scienze dell’Atmosfera e del Clima, CNR, Roma, Italy
Received: 9 September 2003 – Published in Atmos. Chem. Phys. Discuss.: 14 November 2003 Revised: 16 February 2004 – Accepted: 17 February 2004 – Published: 25 February 2004
Abstract.A set of 813 lidar profiles of tropospheric aerosol and cirrus clouds extinction and depolarization observed in Rome, Italy, between February 2001 and February 2002 is analyzed and discussed. The yearly record reveals a mean-ingful contribution of both cirrus clouds (38%) and Saha-ran dust (12%) to the total optical thickness (OT) of 0.26, at 532 nm. Seasonal analysis shows the planetary boundary layer (PBL) aerosols to be confined below 2 km in winter and 3.8 km in summer, with relevant OT shifting from 0.08 to 0.16, respectively. Cirrus clouds maximise in spring and autumn, in both cases with average OT similar to the PBL aerosols one. With the exception of winter months, Saharan dust is found to represent an important third layer mostly re-siding between PBL aerosols and cirrus clouds, with yearly average OT≈0.03. Saharan dust and cirrus clouds were de-tected in 20% and in 45% of the observational days, re-spectively. Validation of the lidar OT retrievals against col-located sunphotometer observations show very good agree-ment. These results represent one of the few yearly records of tropospheric aerosol vertical profiles available in the liter-ature.
1 Introduction
Current global radiative balance estimates attribute to atmo-spheric aerosols a negative forcing comparable and opposite to the one of greenhouse gases (e.g. Penner et al., 2001). This is the result of a direct effect, produced by the aerosol scattering and absorption of solar radiation, and of an indi-rect (possibly larger) effect related to the aerosol capability of affecting cloud formation and radiative properties (e.g. Ramanathan et al., 2001). These effects take place mainly within and above the planetary boundary layer (PBL),
re-Correspondence to:G. P. Gobbi (g.gobbi@isac.cnr.it)
spectively. The PBL is the region where most of the atmo-spheric aerosol mass is located (e.g. Jaenicke, 1992). At the same time, it is well established that large amounts of min-eral dust from arid regions of the Earth (e.g. Prospero et al., 2002) are lifted well into the free troposphere (e.g. Sakai et al., 2000; Gobbi et al., 2000; Sassen, 2002) and transported over thousands of kilometers (e.g. Duce et al., 1980; Pros-pero et al., 1983; Moulin et al., 1998; Karyampudi et al., 1999).
nasa.gov) and Earthcare (ESA, http://www.esa.int) will be-come operational. Still, ground-based observations will re-main necessary to provide validated and continuous inputs to climate models.
In this paper we present a one-year record of aerosol and cirrus cloud observations made at the southern outskirts of Rome, Italy (41.840◦N–12.647◦E, 130 m a.s.l.) by means of a polarization-sensitive lidar operated in both day and night-time conditions. In this semi-rural location we expect the presence of continental plus combustion-originated aerosols, leading to moderately polluted PBL conditions. Further-more, as in the whole Mediterranean region, we expect a strong input of mineral dust from the Sahara desert (e.g. Moulin et al., 1998). With the aim of providing data suit-able for use in radiative transfer models, the lidar-derived profiles of optical and physical properties of aerosols and cir-rus clouds will be discussed in terms of both their seasonal variability and yearly average characterization.
2 Methods
The lidar system employed in our observations exploits a frequency-doubled Nd:YAG laser, emitting 532 nm, plane-polarized, 30 mJ pulses at 10 Hz. Two co-located telescopes, a 10 cm and a 25 cm one, allow to collect a full backscat-ter profile between 300 m and 14 km from the ground (e.g. Gobbi et al., 2000). Parallel and cross-polarized components (with respect to the laser polarization plane) of the backscat-ter signal are collected and recorded at both telescopes by photon-counting detection chains. Each lidar profile is ob-tained by averaging 6000 laser shots, has a maximum ver-tical resolution of 37.5 m and is calibrated at an aerosol-free height against a monthly standard atmosphere, obtained from a ten-year climatology of radio-soundings launched 30 km West of our site.
Signal analysis is performed according to the approach outlined in Gobbi et al. (2002). In particular, the lidar equation (e.g. Measures, 1984) is solved numerically and the ratio between aerosol extinction and backscatter coeffi-cients (σa/βa)needed to retrieve bothβa and σa from the single-wavelength lidar profile is determined by means of aerosol models providing a functional relationship σa =
f (βa) (e.g. discussion below). The procedure to retrieve the aerosol backscatterβa(z) at each level (z) of the profile can be summarized as follows: 1) The molecular backscat-ter profileβm(z) is computed from the model atmosphere. The lidar trace is calibrated against this βm(z) profile at an aerosol-free level selected by visual analysis of the sig-nal. The calibrated lidar signal then represents the non-attenuated total backscatter profileβt ot(z)=βm(z)+βa(z); 2) the aerosol backscatter βa(z) at each measurement point is determined as βa(z)=βt ot(z)−βm(z); 3) the aerosol ex-tinctionσa(z) at each measurement point is obtained from the σa = f (βa) model relationship on the basis of the
aerosol backscatterβa(z) computed at step 2; 4) at each mea-surement point the calibrated signalβt ot(z) is corrected for both the aerosol and molecular extinction encountered below that point, then providing a new extinction-corrected profile
βt ot′ (z); 5) steps 1–4 are iterated until convergence on inte-grated aerosol backscatter is reached, according to the con-dition: Pi|βa′(zi)−βa(zi)|/Piβa(zi) ≤ 10−3, withi in-dicating thei-th discrete level of the lidar profile. Errors in the retrieval ofβa(z) depend on range and measurement con-ditions as background noise, accuracy of the model atmo-sphere, of theσa/βaratio and of the calibration (e.g. Russell et al., 1979; Measures, 1984). By taking into account all these parameters and following the error analysis method of Russell et al. (1979), typical errors of dβ/β≈20% are found to characterize the backscatter coefficients presented in this paper.
For this analysis, a continental aerosol model (Barnaba and Gobbi, 2004) has been employed as default, while the mineral dust model (Barnaba and Gobbi, 2001) is used dur-ing Saharan dust events. Presence of dust is predicted by means of forecast model analysis (e.g. the DREAM model of the Euro Mediterranean Centre for Insular Coastal Dy-namics of Malta: http://www.icod.org.mt/), confirmed by the lidar depolarization trace, and checked on the basis of back-trajectories. This analysis of particles origin will be further discussed in Sect. 3. Finally, an ice particles model (Gobbi, 1995) is employed for the signal analysis in regions where cirrus clouds are detected. The mean error of the extinction coefficients obtained by these retrievals is of the order of 20– 50% (typically 35%), depending on measurement conditions and aerosol type, e.g. Barnaba and Gobbi (2001), Gobbi et al. (2003).
The lidar-derived variables we will discuss are: 1) the 532 nm aerosol extinction coefficientσa(km−1), 2) the linear depolarization ratio D, and 3) the backscatter ratio R=(βa+
βm)/βm. In our analysis, D is defined as the ratio between cross (⊥)and parallel (//) polarized backscatter signals, i.e. D=S⊥/S//∝(β⊥a+β⊥m)/(β//a +β//m). Therefore, D is a weighted contribution of molecular and aerosol depolariza-tion. While spherical particles as liquid aerosols or small cloud droplets do not generate a depolarized signal, non-spherical (solid) ones as dust or cirrus clouds show parti-cle depolarization Da=(β⊥a)/(β//a)≈40–60% (e.g. Sassen, 1991; Mishchenko and Sassen, 1998; Gobbi et al., 2000). This behavior provides a powerful tool to infer the particu-late thermodynamic phase. In our analysis we shall employ total depolarization D rather than particle depolarization Da, since the latter becomes very unstable at low aerosol contents (small β//a). In molecular (aerosol-free) scattering condi-tions our system detected D≈1.4–2.0%.
(a) (b) (c) (d)
2 3 5 2 3 5
1 10 100
R & D% 0
1 2 3 4 5 6 7 8 9 10 11 12 13 14
Z (
K
M)
2 3 5 2 3 5
1 10 100
R & D%
2 3 5 2 3 5
1 10 100
R & D%
0 1 2 3 4 5 6 7 8 9 10 11 12 13 14
2 3 5 2 3 5
1 10 100
R & D% 2 3 5 2 3 5
0.01 integral OT0.10 1.000.012 3 5integral OT0.102 3 51.000.012 3 5integral OT0.102 3 51.000.012 3 5integral OT0.102 3 51.00
19/12/2001 17.01 UT
02/08/2001 19.15 UT
06/07/2001 18.08 UT 24/03/2001
18.42 UT
Fig. 1. Typical lidar profiles (at 532 nm) representative of:(a)clear winter conditions;(b)summer PBL aerosol and pre-dust conditions; (c)spring dust conditions, and(d)summer dust, liquid cloud and cirrus cloud conditions. The three curves reported in each plot represent vertical profiles of backscatter ratio R (black line), depolarization ratio D(%) (blue line), and (red line) the integral (from ground) of the extinction coefficient, i.e. OT(z), respectively.
measurements made at our Rome Tor Vergata site in the framework of AERONET (the NASA Aerosol Robotic Net-work: http://aeronet.gsfc.nasa.gov). These comparisons will employ the “cloud-screened”, i.e. cloud and cirrus-free OT measurements made by our sunphotometer within one hour from the lidar one. Expected accuracy of the sunphotometer OT observations is±0.02 (e.g. Holben et al., 1998).
3 Observations
A set of 993 lidar profiles was retrieved over 207 measure-ment days between 15 February 2001 and 14 February 2002. Average sampling rate of this record is 4.8 profiles/day. Mea-surements were carried-out at non-synchronous times be-tween 7:00 am and 9:00 pm (UTC), usually spaced by 2– 3 h. Here we shall discuss the cloudless portion of the ob-servations (813 profiles gathered over 198 days), which in-cludes PBL aerosol, Saharan dust and cirrus cloud condi-tions. Statistical analysis of the observations will be carried out by both averaging over the whole dataset (yearly average) and over seasonal periods (i.e. December to February (DJF), March to May (MAM), June to August (JJA) and September to November (SON)). In each case, four average profiles will be provided, referring respectively to: 1) the total set of 813 observations (TOT); 2) the observations collected in no-dust conditions (ND); 3) the observations collected in no-cirrus cloud conditions (NC), and 4) Saharan dust affected
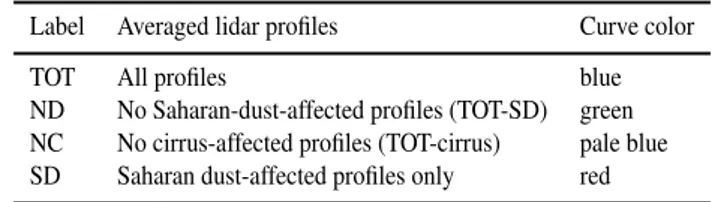
obser-Table 1.Synopsis of the four average profiles discussed in the pa-per. Number of lidar traces considered in averages is reported in Table 2.
Label Averaged lidar profiles Curve color
TOT All profiles blue
ND No Saharan-dust-affected profiles (TOT-SD) green NC No cirrus-affected profiles (TOT-cirrus) pale blue SD Saharan dust-affected profiles only red
vations (SD). It is worth noticing that lidar traces containing cirrus features are only excluded in the NC average profile. The synopsis of the four average profile definitions is given in Table 1.
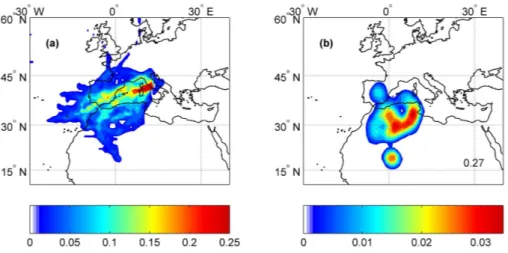
Fig. 2.Backtrajectory analysis of airmasses ending between 3 and 4 km over Rome, during the acquisition of the 180 lidar profiles classified as Saharan dust-affected (SD):(a)geographical density of the computed 1,830 backtrajectories;(b)geographical density of backtrajectories transit (for at least three hours) within the atmospheric mixed layer computed by the HYSPLIT code (Draxler and Rolph, 2003). Densities in Fig. 2b are normalized to the total number of backtrajectories entering the mixed-layer, NML. The ratio between NMLand the total number
of backtrajectories (1830) is reported in the bottom-right corner of Fig. 2b.
Table 2. Number of observational days (OD) and averaged li-dar profiles (LP, in brackets), classified by period of measurement and particulate type. The PBL aerosol case includes dust-less and cirrus-less profiles only. The ND and NC cases can be computed as TOT-Dust and TOT-Cirrus, respectively.
Condition YEAR DJF MAM JJA SON
OD (LP) OD (LP) OD (LP) OD (LP) OD (LP)
Cloudless (TOT) 198 (813) 45 (145) 52 (193) 45 (232) 56 (243) PBL aerosol 163 (428) 39 (122) 34 (49) 41 (140) 49 (117) Dust (SD) 39 (183) 0 (0) 15 (57) 12 (65) 12 (61) Cirrus (CIR) 89 (202) 13 (23) 34 (87) 15 (27) 27 (65)
thickness OT(z) (red line). Figure 1a depicts a typical winter aerosol condition, with OT≈0.1, and boundary layer aerosols confined below 2 km. Depolarization in the aerosol-free re-gion is of the order of 2%. Conversely, Fig. 1b reports a sum-mer case in which PBL aerosols reach up to 3.7 km, an effect due to the stronger convective mixing typical of the warmer seasons. In fact, the increase in backscatter and decrease in depolarization observed at 2.8–3.5 km reveals the level of the “entrainment layer”, the region topping the PBL where stra-tocumulus clouds usually form (e.g. Stull, 1988). This pro-file also illustrates the sensitivity of the depolarization trace to the presence of non-spherical particles. In fact, at that time (19.15 UT of 2 August, 2001) a Saharan dust plume was reaching our site travelling between 5 and 9 km. Even if the dust load was still very low (R<1.2, σa≈0.007 km−1), the sharp increase in depolarization clearly reveals the presence of non-spherical particles.
Examples of the aerosol load associated to fully developed dust events are reported in Figs. 1c and d, respectively. Both
profiles show the correlated increase in both R and D typi-cal of such events (R≈2–5, D≈10–45%), leading to optitypi-cal thicknesses of the order of 0.3–0.5. Saharan dust has depo-larization levels similar to cirrus clouds, while backscatter ra-tios are mostly one order-of-magnitude smaller and lifetimes one order-of-magnitude larger. Together with a broader ver-tical extent of Saharan dust layers, all these features allow for a good discrimination between cirrus clouds and dust. In addition, Fig. 1d shows the behavior of the lidar traces in the presence of liquid and frozen clouds: the sharp increase in R due to the presence of clouds is anticorrelated with respect to D in the first case (6–6.5 km) and correlated with D in the cirrus case (9–10.5 km). These few examples well illus-trate how the lidar-observed scattering properties can allow for discriminating the various types of particles suspended in the atmosphere.
0 10 20 30 40 50
D (%)
0.00 0.05 0.10 0.15
EXT (KM-1)
0 1 2 3 4 5 6 7 8 9 10 11 12 13 14
Z (
K
M
)
NC ND SD TOT
0.0 0.1 0.2 0.3 0.4 0.5
INTEGRAL OT
(b) (c)
(a)
0 1 2 3 4 5 6 7
R (d)
Fig. 3. Yearly average profiles (at 532 nm) of: (a)extinctionσa;(b)depolarization ratio D,(c)integral optical thickness OT(z) and(d)
backscatter ratio R. Curve colors represent the total TOT (blue), no-dust ND (green), no-cirrus NC (pale blue) and Saharan dust SD (red) records, respectively (e.g. Table 1 for synopsis). Standard deviations associated to the ND mean curves are reported for bothσaand D
profiles.
30% higher averages (54% of days affected by cirrus clouds), with minimum occurrence in summer (42%), and maximum occurrence in fall (60%).
In order to verify the “Saharan” origin of the profiles in-cluded in the SD record, five-day backtrajectories ending over Rome, Italy were computed by means of the NOAA Air Resources Laboratory HYSPLIT code (Draxler and Rolph, 2003). In particular, for each of the 183 lidar profiles clas-sified in the SD category, ensembles of ten backtrajectories ending in the region of maximum impact of dust events (3– 4 km) were computed. Properties of these 1830 backtrajec-tories are summarized in Fig. 2 in terms of a) geographical density of backtrajectory paths, and b) geographical density of backtrajectories transit (for at least three hours) within the atmospheric mixed-layer as computed by the HYSPLIT code (Draxler and Rolph, 2003). Densities in Fig. 2b are nor-malized to the total number of backtrajectories entering the mixed-layer. Figure 2a shows the typical advection pattern pertinent to SD profiles to mainly involve North Africa and Western Europe, then ruling out the alternative possibility of long-range transport from other areas. This plot also shows that, upon their final approach to our site, most of the tra-jectories transit over the Mediterranean sea. In addition to that, Fig. 2b reveals that the region of most probable entrain-ment of mixed-layer air into the SD airmasses is the north African-Saharan one, with some minor input from Spain and the Mediterranean sea. However, we verified these latter air-masses did also enter the North-African mixed layer during their travel. Such cases are likely to result into a mixture of Saharan dust with other aerosols, still characterized by a strong depolarization signature (e.g. Gobbi et al., 2003). Overall, the backtrajectory analysis strongly supported the dominance of Saharan dust in the air masses catalogued as SD in this study.
3.1 Yearly averages
Annually-averagedσa, D, integral OT, and R profiles are pre-sented in Figs. 3a, b, c and d, respectively. In each plot, color coding of the curves represents the TOT (blue), ND (green), NC (pale blue) and SD (red) cases, respectively (e.g. Ta-ble 1). As an indication of the variability associated to mea-surements, standard deviations of the dust-less (ND) mean curves are reported in the extinction and depolarization plots (green error bars). In all plots, altitude is referred to mean sea level, the vertical resolution is 225 m and the first bin starts 300 m above the station level (130 m a.s.l.). In comput-ing total OT, extinction of the lowermost 300 m is set equal to the first bin one, an assumption likely to lead to a small underestimation of this parameter.
In Figs. 3a and d, the dust-free (ND) annual profiles show aerosols in the lower troposphere to be confined below 4 km, with 90% of the optical thickness of this layer residing below 2.5 km (Fig. 3c). Cirrus clouds formation is revealed by an increase inσa, D, and R in the region between 6 and 14 km. Therefore, in no-dust conditions a 2 km thick particulate-free gap is found between the PBL aerosol layer and the cir-rus clouds region. Conversely, yearly-average dust-affected profiles (SD) present major departures from ND ones in the region 1.5–10 km. As in the cirrus case, dust is clearly re-vealed by an increase inσa, D, and R. In particular, a two to six-fold increase in aerosol extinction is observed between 2 and 6 km, while some increase in cirrus cloud extinction is noticed between 6 and 10 km (Fig. 3a).
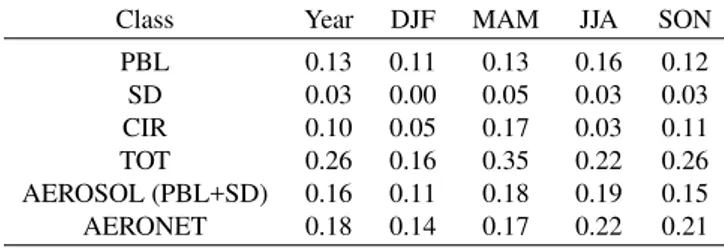
Table 3.Contributions of lower troposphere aerosol (PBL), Saharan dust (SD) and cirrus clouds (CIR) to the total optical thickness of the 0–14 km region (TOT) in the yearly and seasonal analysis. Aerosol (i.e. PBL+SD) optical thickness is reported as AEROSOL for com-parisons with coincidental AERONET sunphotometer (cloud and cirrus-screened data) measurements. Expected typical error is ±35% for the lidar retrievals and±0.02 for the sunphotometer data.
Class Year DJF MAM JJA SON
PBL 0.13 0.11 0.13 0.16 0.12
SD 0.03 0.00 0.05 0.03 0.03
CIR 0.10 0.05 0.17 0.03 0.11
TOT 0.26 0.16 0.35 0.22 0.26
AEROSOL (PBL+SD) 0.16 0.11 0.18 0.19 0.15
AERONET 0.18 0.14 0.17 0.22 0.21
Here, the SD backscatter (∝R-1) in the cirrus region sys-tematically exceeds the ND one between 6 and 10 km, while being very similar above. Such increases in both extinction and backscatter were mostly generated in the period June-November and are likely attributable to an increase in ice nu-clei provided by dust grains, e.g. Sassen (2002). As a matter of fact, in this year dust was observed to reach up to 10 km during three events (May, June, July).
Total depolarization plots in Fig. 3b indicate that the im-pact of particles non-sphericity on radiative transfer should be always considered in the cirrus region and during dust transport events. Furthermore, all depolarization profiles show an increase in the lower PBL, revealing a meaning-ful presence of non-spherical (possibly soil or combustion-generated) particles over our site. Conversely, the small in-crease (to ∼5%) in the NC curve depolarization ratio ob-served at altitudes above 6 km is mainly due to noise.
Overall, the yearly average OT of tropospheric particulate is 0.26 (TOT profile in Fig. 3c). PBL aerosol, dust and cirrus clouds contribute to that with 0.13 (50%), 0.03 (12%) and 0.10 (38%), respectively. It is also worth noticing that the lower troposphere (z<6 km) aerosol optical thickness gets al-most doubled during dust events.
3.2 Seasonal averages
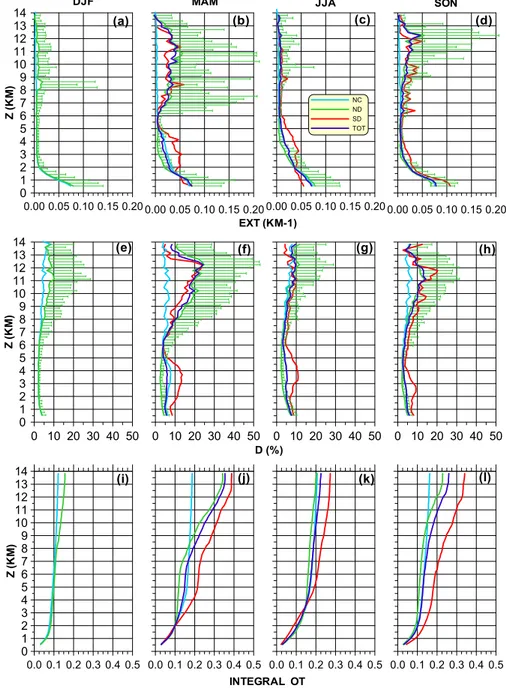
Seasonal average profiles of extinction, depolarization and integral OT are plotted in Fig. 4. Since the parameter of inter-est for climatic studies is extinction, backscatter ratio profiles have not been included in this figure to avoid overloading it. The winter plots (DJF, i.e. December 2001–February 2002) show no Saharan dust profiles since dust transport events did not occur during that period. Therefore, total (TOT) and dust-less (ND) profiles coincide in these plots. The lowest aerosol and cirrus contents are registered in this season, with an average total optical thickness of 0.16 (Fig. 4i) and PBL extinction rapidly reducing to 0.01 km−1(here assumed as a threshold for background conditions) at 2 km (Fig. 4a). At the same time, extinction in the lower PBL reaches its max-imum during this season (Fig. 4a). This is possibly due to both higher relative humidity (leading to enhanced growth of
soluble particles) and to confinement of aerosols to the lower levels due to weaker convective activity. Such an explana-tion is also supported by the minimum depolarizaexplana-tion values recorded at low altitude (Fig. 4e). In winter, the cirrus for-mation region extends between 8 and 13.5 km, with average OT of the order of 0.05 (Fig. 4i).
The spring (MAM) record shows both dust and cirrus max-imum activity. The average total OT of 0.35 (Fig. 4j) is made-up by the contributions of PBL aerosols (0.13), dust (0.05) and cirrus (0.17). Figure 4b shows the dust extinction (SD curve) to substantially exceed the ND profile in the region 1.5–5 km. This translates into a strong impact of dust on the total spring extinction profile (TOT). In fact, while the ND extinction profile crosses the 0.01 km−1value at 2.8 km, the TOT one crosses it at 4.8 km. As can be observed in Fig. 4f, all the way up to 5.5 km dust depolarization is consistently larger than in the ND case, indicating a dominance of non-spherical particles in this region. A similar effect is found in the cirrus region, now extending between 6.5 and 13.5 km.
Summer (JJA) conditions show a marked lifting of the PBL aerosol upper boundary and an increase in its OT, likely associated to a stronger convection. The threshold extinc-tion value of 0.01 km−1is now crossed at 3.8 km (ND curve in Fig. 4c) and PBL aerosol OT reaches maximum values of 0.16, as opposed to the winter minimum of 0.08 (e.g. Figs. 4k and i). Nonetheless, a low cirrus activity leads to a total OT of 0.22, i.e. smaller than the spring (0.35) and fall (0.26) ones. In this season, the cirrus contribution (0.03) to the to-tal OT is of 13% (Fig. 4k), the lowest in the record. Figure 4c shows an evident impact of dust on the extinction profile between 2 and 6 km, with a contribution of 0.03 to the total OT. Conversely, the dust (SD) extinction profile in the PBL below 1.7 km is systematically lower than the no-dust (ND) one. This effect (also visible in the MAM case), is possibly due to the warming and consequent stabilization of the PBL air characterizing Saharan events. In no-dust (ND) condi-tions, depolarization in the lower PBL (Fig. 4g) reaches the maximum value of the year (7%), as opposed to minimum winter values of 4% (Fig. 4e). This behavior suggests both a stronger presence of crustal aerosols and a smaller RH-driven growth of soluble particles.
0 10 20 30 40 50 D (%)
0.0 0.1 0.2 0.3 0.4 0.5 0
1 2 3 4 5 6 7 8 9 10 11 12 13 14
Z (
K
M
)
0.00 0.05 0.10 0.15 0.20 0
1 2 3 4 5 6 7 8 9 10 11 12 13 14
Z (
K
M
)
0.00 0.05 0.10 0.15 0.20 EXT (KM-1)
0.00 0.05 0.10 0.15 0.20
NC ND SD TOT
0.00 0.05 0.10 0.15 0.20
DJF MAM JJA SON
0 10 20 30 40 50 0
1 2 3 4 5 6 7 8 9 10 11 12 13 14
Z (
K
M
)
0 10 20 30 40 50 0 10 20 30 40 50
0.0 0.1 0.2 0.3 0.4 0.5
INTEGRAL OT
0.0 0.1 0.2 0.3 0.4 0.5 0.0 0.1 0.2 0.3 0.4 0.5
(a) (b) (c) (d)
(e) (f) (g) (h)
(i) (j) (k) (l)
Fig. 4. Seasonal (columns) average profiles of 532 nm extinctionσa(first row), depolarization ratio D (second row) and integral optical
thickness OT (third row). Curve colors represent the TOT (blue), ND (green), NC (pale blue) and SD (red) records, respectively (e.g. Table 1 for synopsis). Standard deviations associated to the ND mean curves are reported for bothσaand D profiles.
A summary of the yearly and seasonal average optical thickness OT is reported in Table 3. In this table we sep-arated the contribution of boundary layer aerosols (PBL), Saharan dust particles (SD) and cirrus clouds (CIR) to the to-tal (TOT) optical thickness. This partitioning allows to com-pare the lidar-derived aerosol contribution (i.e. PBL+SD) to the AERONET optical thickness measurements, which are screened to exclude both cloud and cirrus conditions. For this purpose, AERONET yearly and seasonal average OT for our site (Rome Tor Vergata) are also included in Table 3.
positive end of the lidar-derived OT range (0.15±35%), we suspect such an above-average difference to be also due to a non-perfect cirrus-screening of the AERONET record. In fact, autumn was characterized by thinner, i.e. less detectable cirrus clouds with respect to spring 2001 (e.g. Figs. 4d and b).
4 Conclusions
One year (February 2001–February 2002) of lidar observa-tions of tropospheric aerosols and cirrus clouds over Rome (Italy) has been presented and discussed. This record repre-sents one of the few yearly climatologies of tropospheric pro-files available in the scientific literature. With the exception of winter months, Saharan dust was found to represent an optically meaningful layer affecting the region between 1.5 and 6 km, i.e. between PBL aerosols and cirrus clouds. Con-sidered the ubiquitous transport of Saharan dust (e.g. Moulin et al., 1998), we expect this behavior to be rather common to the troposphere of Mediterranean regions. Saharan dust was detected in 20% of the 198 operational days (25% if considering cloudy ones as well), with maximum frequency in spring-summer 2001 (about 28%) and no events in win-ter. On a yearly basis, dust accounted for 19% of the aerosol (cirrus-less) optical thickness. During the spring and fall dust events this contribution rose to 50%.
Lower troposphere (PBL) aerosol OT was maximum in summer (0.16), and minimized in winter (0.08). Most of this aerosol was confined below 3.8 and 2 km, respectively. Doubled depolarization values observed in the summer PBL, indicate a stronger impact on radiation of non-spherical par-ticles with respect to winter. Cirrus clouds were detected in 45% of the operational days. Maximum and minimum in-cidence was registered in spring (65%) and winter-summer (30%), respectively. On the yearly average, cirrus and PBL aerosol contributions to OT were comparable. Presence of dust was often correlated with enhanced cirrus cloud extinc-tion in the region 6–10 km.
With the exception of winter months, these observations indicate a strong presence of non-spherical particulate mat-ter at all tropospheric altitudes. This should be taken into account in both retrievals of aerosol properties performed by means of optical techniques and in the definition of the radia-tive properties of particulate matter suspended in the Earth atmosphere.
Acknowledgements. Part of this work has been carried out under the Italian Space Agency contract “GASTRAN”. The authors gratefully acknowledge the NOAA Air Resources Laboratory (ARL) for the provision of the HYSPLIT transport and dispersion model.
Edited by: B. K¨archer
References
Balis, D., Papayannis, A., Galani, E., Marenco, F., Santacesaria, V., Hamonou, E., Chazette, P., Ziomas, I., and Zerefos, C.: Tro-pospheric Lidar aerosol measurements and sun photometric ob-servations at Thessaloniki, Greece, Atmos. Env., 34, 925–932, 2000.
Barnaba, F. and Gobbi, G. P.: Lidar estimation of tropospheric aerosol extinction, surface area and volume: Maritime and desert-dust cases, J. Geophys. Res., 106 (D3), 3005–3018, 2001 (Correction in J. Geophys. Res., doi:10.1029/2002JD002340, 2002).
Barnaba, F. and Gobbi, G. P.: Modeling the aerosol extinction ver-sus backscatter relationship for lidar applications: maritime and continental conditions, J. Atmos. Ocean. Tech., in press, 2004. Draxler, R. R. and Rolph, G. D.: HYSPLIT (HYbrid Single-Particle
Lagrangian Integrated Trajectory) Model access via NOAA ARL READY Website (http://www.arl.noaa.gov/ready/hysplit4.html), NOAA Air Resources Laboratory, Silver Spring, MD, 2003. Duce, R. A., Unni, C. K., Ray, B. J., Prospero, J. M., Merrill, J.
T.: Long range transport of soil dust from Asia to tropical North Pacific: Temporal variability, Science, 209, 1522–1524, 1980. Del Guasta, M.: Daily cicles in urban aerosols observed in Florence
(Italy) by means of an automatic 532–1064 nm Lidar, Atmos. En-viron., 36, 2853–2865, 2002.
de Reus, M., Krejci, R., Williams, J., Fischer, H., Scheele, R., and Strom, J.: Vertical and horizontal distributions of the aerosol number concentration and size distribution over the northern In-dian Ocean, J. Geophys. Res., 106, D22, 28 629–28 641, 2001. De Tomasi, F. and Perrone, M. R.: Lidar measurements of
tropo-spheric water vapor and aerosol profiles over southeastern Italy, J. Geophys. Res., 108, D9, 10.1029/2002JD002781, 2003. Franke, K., Ansmann, A., Muller, D., Althausen, D., Wagner, F.,
and Scheele, R.: One-year observations of particle lidar ratio over the tropical Indian Ocean with Raman lidar, Geophys. Res. Lett., 28, 4559–4562, 2001.
Gobbi, G. P.: Lidar estimation of stratospheric aerosol properties: Surface, volume, and extinction to backscatter ratio, J. Geophys. Res., 100, 11 219–11 235, 1995.
Gobbi, G. P., Barnaba, F., Giorgi, R., Santacasa, A.: Altitude-resolved properties of a Saharan-Dust event over the Mediter-ranean, Atmos. Environ., 34, 5119–5127, 2000.
Gobbi, G. P., Barnaba, F., Blumthaler, M., Labow, G., and Herman, J.: Observed effects of particles non-sphericity on the retrieval of marine and desert-dust aerosol optical depth by lidar, Atmos. Res., 61, 1–14, 2002.
Gobbi, G. P., Barnaba, F., Van Dingenen, R., Putaud, J. P., Mircea, M., and Facchini, M. C.: Lidar and in situ observations of con-tinental and Saharan aerosol: closure analysis of particles opti-cal and physiopti-cal properties, Atmos. Chem. Phys., 3, 2161–2172, 2003.
Goldfarb, L., Keckhut, P., Chanin, M. L., and Hauchecorne, A.: Cirrus climatological results from lidar measurements at OHP (44◦N–6◦E), Geophys. Res. Lett., 28, 9, 1687–1690, 2001. Hamonou, E., Chazette, P., Balis, D., Dulac, F., Schneider, X.,
Galani, E., Ancellett, G., and Papayannis, A.: Characterization of the vertical structure of Saharan dust export to the Mediter-ranean, J. Geophys. Res., 104, 22 257–22 270, 1999.
98, 12 753–12 766, 1993.
Holben, B. N., Eck, T. F., Slutsker, I., Tanre, D., Buis, J. P., Set-zer, A., Vermote, E., Reagan, J. A., Kaufman, Y., Nakajima, T., Lavenu, F., Jankowiak, I., and Smirnov, A.: AERONET – A fed-erated instrument network and data archive for aerosol character-ization, Rem. Sen. E., 66, 1–16, 1998.
Jaenicke, R.: Nucleation and atmospheric aerosol, edited by Fukuta, N. and Wagner, P. E., pp. 417, Deepak Publ., Hampton, Virginia, 1992.
Karyampudi, V. M., Palm, S. P., Reagan, J. A., Fang, H., Grant, W. B., Hoff, R. M., Moulin, C., Pierce, H. F., Torres, O., Browell, E. V., and Melfi, S. H.: Validation of the Saharan dust plume conceptual model using lidar, Meteosat and ECMWF data, Bull. Am. Meteorol. Soc., 80, 1045–1075, 1999.
Matthias, V. and Bosenberg, J.: Aerosol climatology for the plan-etary boundary layer derived from regular lidar measurements, Atmos. Res., 63, 221–245, 2002.
Measures, R. M: Laser Remote Sensing, J. Wiley, New York., 1984. Mishchenko, M. I. and Sassen, K.: Depolarization of lidar returns by small ice crystals: An application to contrails, Geophys. Res. Lett., 25, 3, 309–312,1998.
Moulin, C., Lambert, C. E., Dayan, U., Masson, V., Ramonet, M., Bousquet, P., Legrand, M., Balkanski, Y. J., Guelle, W., Mar-ticorena, B., Bergametti, G., and Dulac, F.: Satellite climatol-ogy of African dust transport in the Mediterranean atmosphere, J. Geophys. Res., 103, 13 137–13 144, 1998.
Muller, D., Mattis, I., Wandinger, U., Ansmann, A., and Al-thausen, D.: Saharan dust over a central European EARLINET-AERONET site: Combined observations with Raman lidar and sun photometer, J. Geophys. Res., 108, D12, 4345, doi:10.1029/2002JD002918, 2003.
Murayama, T., Sugimoto, N., Uno, I., Kinoshita, K., Aoki, K., Hagiwara, N., Liu, Z., Matsui, I., Sakai, T., Shibata, T., Arao, K., Sohn, B., Won, J., Yoon, S., Li, T., Zhou, J., Hu, H., Abo, M., Iokibe, K., Koga, R., Iwasaka, Y.: Ground-based network observation of Asian dust events of April 1998 in east Asia, J. Geophys. Res., 106, D16, 18 345–18 360, 2001.
Penner, J. E., Andreae, M., Annegarn, H., Barrie, L., Feichter, J., Hegg, D., Jayaraman, A., Leaitch, R., Murphy, D., Nganga, J., and Pitari, G.: Aerosols, their Direct and Indirect Effects, In Cli-mate Change 2001: The Scientific Basis, Cambridge University Press, Cambridge, UK, 2001.
Prospero, J. M., Glaccum, R. A., and Nees, R. T.: Atmospheric transport of soil dust from Africa to South America, Nature, 289, 570–572, 1983.
Prospero, J. M., Ginoux, P., Torres, O., Nicholson, S. E., and Gill, T. E.: Environmental characterization of global sources of atmo-spheric soil dust identified with the Nimbus 7 total ozone map-ping spectrometer (TOMS) absorbing aerosol product, Rev. Geo-phys., 40, 1, 1002, doi:10.1029/2000RG000095, 2002.
Ramanathan, V., Crutzen, P. J., Kiehl, J. T., and Rosenfeld, D.: Aerosols, Climate, and the Hydrological Cycle, Science, 294, 2119–2124, 2001.
Russell, P. B., Swissler, T. J., and McCormick, M. P.: Methodology for error analysis and simulation of lidar aerosol measurements, Appl. Opt., 18, 3783–3797, 1979.
Sakai, T., Shibata, T., Kwon, S., Kim, Y., Tamura, K., and Iwasaka, Y.: Free tropospheric aerosol backscatter, depolarization ratio, and relative humidity measured with the Raman lidar at Nagoya in 1994–1997: contributions of aerosols from the Asian continent and the Pacific ocean, Atmos. Env., 34, 431–442, 2000. Sassen, K.: The polarization lidar technique for cloud research: A
review and current assessment, Bull. Am. Met. Soc., 72, 1848– 1866, 1991.
Sassen, K: Indirect climate forcing over the western US from Asian dust storms, Geophys. Res. Lett., 29, 10, 10.1029/2001GL014051, 2002.
Schneider, J. and Eixmann, R.: Three years of routine Raman lidar measurements of tropospheric aerosols: Backscattering, extinc-tion and residual layer height, Atmos. Chem. Phys., 2, 313–323, 2002.