ACPD
15, 5751–5799, 2015Dust aerosol and optical properties over North Africa
M. Mokhtari et al.
Title Page
Abstract Introduction
Conclusions References
Tables Figures
◭ ◮
◭ ◮
Back Close
Full Screen / Esc
Printer-friendly Version Interactive Discussion
Discussion
P
a
per
|
Discussion
P
a
per
|
Discussion
P
a
per
|
Discussion
P
a
per
|
Atmos. Chem. Phys. Discuss., 15, 5751–5799, 2015 www.atmos-chem-phys-discuss.net/15/5751/2015/ doi:10.5194/acpd-15-5751-2015
© Author(s) 2015. CC Attribution 3.0 License.
This discussion paper is/has been under review for the journal Atmospheric Chemistry and Physics (ACP). Please refer to the corresponding final paper in ACP if available.
Dust aerosol and optical properties
over North Africa simulated with the
ALADIN numerical prediction model
from 2006 to 2010
M. Mokhtari1,2, P. Tulet1,3, C. Fischer1, Y. Bouteloup1, F. Bouyssel1, and O. Brachemi2
1
CNRM/GAME, UMR3589 (Météo-France, CNRS), Toulouse, France
2
Office National de la Météorologie (ONM), Algiers, Algeria
3
LACy, UMR8105 (Université de La Réunion, Météo-France, CNRS), Saint-Denis de La Réunion, France
Received: 26 January 2015 – Accepted: 3 February 2015 – Published: 27 February 2015
Correspondence to: M. Mokhtari (m_morad06@yahoo.fr) and P. Tulet (pierre.tulet@univ-reunion.fr)
ACPD
15, 5751–5799, 2015Dust aerosol and optical properties over North Africa
M. Mokhtari et al.
Title Page
Abstract Introduction
Conclusions References
Tables Figures
◭ ◮
◭ ◮
Back Close
Full Screen / Esc
Printer-friendly Version Interactive Discussion
Discussion
P
a
per
|
Discussion
P
a
per
|
Discussion
P
a
per
|
Discussion
P
a
per
|
Abstract
The seasonal cycle and optical properties of mineral dust aerosols in North Africa were simulated for the period from 2006 to 2010 using the numerical atmospheric model AL-ADIN coupled to the surface scheme SURFEX. The particularity of the simulations is that the major physical processes responsible for dust emission and transport, as well
5
as radiative effects, are taken into account at short timescales and mesoscale reso-lution. The aim of these simulations is to quantify the dust emission and deposition, locate the major areas of dust emission and establish a climatology of aerosol optical properties in North Africa. The mean monthly Aerosol Optical Thickness (AOT) simu-lated by ALADIN is compared with the AOTs derived from the standard Dark Target
10
(DT) and Deep Blue (DB) algorithms of the Aqua-MODIS (MODerate resolution Imag-ing Spectroradiometer) products over North Africa, and with a set of sun photometer measurements located at Banizoumbou, Cinzana, Soroa, Mbour and Capo Verde. The vertical distribution of dust aerosol represented by extinction profiles is also analysed using CALIOP (Cloud-Aerosol Lidar with Orthogonal Polarization) observations.
15
The annual dust emission simulated by ALADIN over North Africa is 878 Tg year−1.
The Bodélé depression appears to be the main area of dust emission in North Africa, with an average estimate of about 21.6 Tg year−1.
The simulated AOTs are in good agreement with satellite and sun photometer ob-servations. The positions of the maxima of the modelled AOTs over North Africa match
20
the observed positions, and the ALADIN simulations satisfactorily reproduce the vari-ous dust events over the 2006–2010 period.
The AOT climatology proposed in this paper provides a solid database of optical properties and consolidates the existing climatology over this region derived from satellites, the AERONET network and Regional Climate Models. Moreover, the
three-25
ACPD
15, 5751–5799, 2015Dust aerosol and optical properties over North Africa
M. Mokhtari et al.
Title Page
Abstract Introduction
Conclusions References
Tables Figures
◭ ◮
◭ ◮
Back Close
Full Screen / Esc
Printer-friendly Version Interactive Discussion
Discussion
P
a
per
|
Discussion
P
a
per
|
Discussion
P
a
per
|
Discussion
P
a
per
|
1 Introduction
Dust aerosols emitted by wind erosion from arid and semi-arid regions of the globe rep-resent more than 40 % of annual tropospheric aerosols (IPCC, 2007). These terrige-nous particles transported by the atmosphere significantly alter the Earth’s radiative budget by absorbing and scattering incoming solar and outgoing terrestrial radiation
5
(Haywood et al., 2001; Sokolik et al., 2001; Houghton et al., 2001). They can affect cloud properties by modifying their radiative properties and precipitation (IPCC, 2007; Twomey, 1959; Albrecht, 1989; Sandu et al., 2008). They also play several roles in bio-geochemical cycles (Martin, 1991; Swap et al., 1992), atmospheric chemistry (Wang et al., 2002; Martin et al., 2003), visibility and human health. Because of the important
10
role that dust might play in future climate change and its potential high impact on the Earth’s ecosystems and natural and human environments, it is important to know where the major dust sources are, how dust concentration varies in space and time and what controls this variability. North Africa is the world’s main source of dust aerosol, with a relative contribution of about 50 % of the total worldwide production (Zender et al.,
15
2003). This region is well suited for studying the impact of aerosols on the radiation bud-get and climate. Therefore, an accurate database of aerosol content in this region is crucial to identifying and quantifying this impact, particularly in Regional Climate Mod-els (RCMs). Changes to this database in numerical modMod-els have a sensitive impact on model performance. For example, various studies (Tompkins et al., 2005; Rodwell,
20
2005) have shown the positive impact of the switch from the Tanré et al. (1984) clima-tology to the Tegen et al. (1997) climaclima-tology for various aspects of the ECMWF model (Morcrette et al., 2009). More recently, Kocha et al. (2012) have shown the impact of dust storms on the cold extra-tropical outbreak and on the African Easterly Jet.
Today, several datasets for aerosol parameters in North Africa are available. The
25
sta-ACPD
15, 5751–5799, 2015Dust aerosol and optical properties over North Africa
M. Mokhtari et al.
Title Page
Abstract Introduction
Conclusions References
Tables Figures
◭ ◮
◭ ◮
Back Close
Full Screen / Esc
Printer-friendly Version Interactive Discussion
Discussion
P
a
per
|
Discussion
P
a
per
|
Discussion
P
a
per
|
Discussion
P
a
per
|
tion positions. Satellite products allow the spatial and temporal variability of atmo-spheric dust aerosol concentrations to be studied (Brooks and Legrand, 2000; Pros-pero et al., 2002; Washington et al., 2003). These products provide a two dimensional (2-D) horizontal representation of dust plumes and offer maximum spatial coverage. Numerous studies have been conducted to reproduce the dust aerosol contents in
5
North Africa based on this type of data. For example, Engelstaedter et al. (2006) used the TOMS (Total Ozone Mapping Spectrometer) AAI (Absorbing Aerosol Index) prod-uct from 1980 to 1992 to identify Saharan dust source regions and create a qualitative description of the annual dust cycle.
In the infrared spectrum, the Meteosat IDDI (Infrared Difference Dust Index) products
10
are also available. Brooks and Legrand (2000) used IDDI to localize the dust emission regions over northern Africa for the period 1984–1993. In addition, very high reso-lution AOT data is now available from satellites such as MODIS, MISR (Multi-angle Imaging SpectroRadiometer) and SEAWIFS (Sea-viewing Wide Field-of-view Sensor) and inversion codes such as Deep Blue (http://gdata1.sci.gsfc.nasa.gov/daac-bin/G3/
15
gui.cgi?instance_id=aerosol_daily). Indeed, a recent comparative study (Bréon et al., 2011) between AOTs derived from POLDER (Polarization and Directionality of Earth’s Reflectances), MODIS, MERIS (Medium Resolution Imaging Spectrometer), SEVIRI (Spinning Enhanced Visible and Infrared Imager) and CALIOP (Cloud-Aerosol Lidar with Orthogonal Polarization) shows that MODIS has the most reliable estimate of total
20
AOT over ocean and land. However, this data encompasses the collective contributions of maritime, continental and desert dust aerosols. Furthermore, the quality of satellite dust products is affected by a number of uncertainties related to the spatial/temporal resolution, atmospheric conditions and range of wavelengths used by each satellite. These error sources are thoroughly discussed in Schepanski et al. (2012). For
exam-25
ACPD
15, 5751–5799, 2015Dust aerosol and optical properties over North Africa
M. Mokhtari et al.
Title Page
Abstract Introduction
Conclusions References
Tables Figures
◭ ◮
◭ ◮
Back Close
Full Screen / Esc
Printer-friendly Version Interactive Discussion
Discussion
P
a
per
|
Discussion
P
a
per
|
Discussion
P
a
per
|
Discussion
P
a
per
|
Numerical modelling provides a three-dimensional view of the atmosphere and can be used to evaluate the individual role of each parameter involved in the optical thick-ness. The Tegen et al. (1997) climatology gives an average distribution valid for one year (1990), obtained from a combination of global distributions of aerosol data from different transport models for soil dust (Tegen and Fung, 1995), sea salt (Tegen et al.,
5
1997), sulfates (Chin et al., 1996) and carbonaceous aerosols (Liousse et al., 1996). However, due to its low spatial resolution (5◦×4◦), the content of dust aerosol over
North Africa is not well represented. Recently, Kinne et al. (2013) proposed a new monthly global climatology, MAC-v1 (Max-Planck-Institute Aerosol Climatology version 1) with a 1◦×1◦resolution. This climatology addresses 3 aerosol properties, namely the
10
AOT, which provides information on the amount of aerosol, the SSA (Single scattering albedo), which provides information on absorption and the Ap (Angstrøm parameter), which provides information on size distribution.
Based on both satellite-derived monthly AOTs and a regional/chemistry model, Nabat et al. (2013) proposed a three-dimensional (3-D) monthly climatology of aerosol
15
distribution over the Mediterranean Sea.
Initiatives have already been taken to use operational Numerical Weather Prediction (NWP) and regional models at high resolution and short timescales. These efforts in-clude the WMO Sand and Dust Storm Warning Advisory and Assessment (SDS-WAS) programme, whose mission is to achieve comprehensive, coordinated and sustained
20
observations and modelling of sand and dust storms in order to improve the monitor-ing of such storms, increase understandmonitor-ing of the dust processes and enhance dust prediction capabilities.
In this study, data and results from simulations using the ALADIN model over North Africa from 2006 to 2010 are presented. This model takes into account the different
25
ACPD
15, 5751–5799, 2015Dust aerosol and optical properties over North Africa
M. Mokhtari et al.
Title Page
Abstract Introduction
Conclusions References
Tables Figures
◭ ◮
◭ ◮
Back Close
Full Screen / Esc
Printer-friendly Version Interactive Discussion
Discussion
P
a
per
|
Discussion
P
a
per
|
Discussion
P
a
per
|
Discussion
P
a
per
|
is evaluated with the AOTs derived from the standard Dark Target and Deep Blue al-gorithms of the Aqua-MODIS products over North Africa and a set of sun photometer measurements located at Banizoumbou, Cinzana, Soroa, Mbour and Capo Verde. In order to validate the ALADIN vertical distribution of aerosols, we use the mean extinc-tion profiles derived from CALIOP.
5
The paper is organised as follows. A brief description of the ALADIN model and the methodology for analysing the data is given in Sect. 2. The numerical results of dust emission, dry and wet deposition, AOT, and extinction coefficients are discussed in Sect. 3. The comparison of the modelled data with Aqua-MODIS products, AERONET datasets, surface concentration observation and CALIOP observation is presented in
10
Sect. 4. Section 5 is devoted to the concluding discussion.
2 Tools and methods
2.1 Model description and dust transport
The spectral hydrostatic atmospheric numerical prediction model ALADIN is used in this study. ALADIN is a primitive equations model using a two-time-level
semi-15
Lagrangian semi-implicit time integration scheme and a digital filter initialisation (Bub-nová et al., 1995; Radnóti, 1995). The atmospheric prognostic variables of the model comprise the wind horizontal components, temperature, and specific humidity fields of water vapour and the four types of hydrometeors (cloud droplets, ice crystals, rain and snow), as well as the turbulent kinetic energy. The influence of subgrid
physi-20
cal processes (radiation, microphysics, turbulence, convection, gravity waves, surface processes) on the evolution of the model’s prognostic variables is represented with physical parameterizations. The radiative transfer in the atmosphere (gaseous, clouds, ozone, and aerosols) and with the surface is described using the RRTM scheme (Rapid Radiative Transfer Model) for longwave radiation (Mlawer et al., 1997) and the six-band
25
ACPD
15, 5751–5799, 2015Dust aerosol and optical properties over North Africa
M. Mokhtari et al.
Title Page
Abstract Introduction
Conclusions References
Tables Figures
◭ ◮
◭ ◮
Back Close
Full Screen / Esc
Printer-friendly Version Interactive Discussion
Discussion
P
a
per
|
Discussion
P
a
per
|
Discussion
P
a
per
|
Discussion
P
a
per
|
1991). Several phenomena linked to the subgrid orography, such as gravity waves, their reflection and trapping, as well as upstream blocking, are taken into account (Catry et al., 2008). The transport in the atmospheric boundary layer is represented with a dif-fusion scheme based on prognostic turbulent kinetic energy (Cuxart et al., 2000) using the Bougeault and Lacarrère (1989) mixing length, and on a mass flux shallow
convec-5
tion scheme using a CAPE closure (Bechtold et al., 2001). Deep convection is repre-sented with a mass flux scheme based on a moisture convergence closure (Bougeault, 1985). A statistical cloud scheme (Smith, 1990; Bouteloup et al., 2005) is used for the representation of stratiform clouds. Microphysical processes linked to resolved precipi-tations such as auto-conversion, collection, evaporation, sublimation, melting and
sed-10
imentation are explicitly represented (Lopez, 2002). Surface processes are calculated using the externalized surface scheme SURFEX (SURFace EXternalisée) (Masson et al., 2013) which includes the Interaction Soil Biosphere Atmosphere (ISBA) scheme (Noilhan and Planton, 1989). This model configuration is very close to the operational configurations used at Météo-France – in ALADIN Overseas applications, for instance
15
– and in about 16 National Weather Services members of the ALADIN consortium. Dust transport and optical properties are calculated using the three-moment Organic Inorganic Log-normal Aerosol Model (ORILAM) (Tulet et al., 2005). ORILAM predicts the evolution of the aerosol composition, along with the number, mean radius, and standard deviation of the aerosol distribution (Binkowski and Roselle, 2003). Dry
de-20
position is calculated according to Seinfeld and Pandis (1997) using the resistance concept from Wesely (1989). Sedimentation of aerosols is driven by the gravitational velocity (Tulet et al., 2005).
The wet removal of dust aerosols is calculated using the SCAVenging submodel (Tost et al., 2006; Tulet et al., 2010). The dry deposition and sedimentation are driven
25
ACPD
15, 5751–5799, 2015Dust aerosol and optical properties over North Africa
M. Mokhtari et al.
Title Page
Abstract Introduction
Conclusions References
Tables Figures
◭ ◮
◭ ◮
Back Close
Full Screen / Esc
Printer-friendly Version Interactive Discussion
Discussion
P
a
per
|
Discussion
P
a
per
|
Discussion
P
a
per
|
Discussion
P
a
per
|
2.2 Dust emission model
The dust fluxes are calculated using the Dust Entrainment And Deposition (DEAD) model (Zender et al., 2003). The physical parameterizations in the DEAD scheme are based on the Marticorena and Bergametti (1995) scheme, in which dust is calculated as a function of saltation and sandblasting. The dust mobilization starts when the wind
5
friction velocity over an erodible surface exceeds a threshold value (Bagnold, 1941; Chepil, 1951). This threshold friction velocity is controlled primarily by surface and soil conditions (surface roughness, soil size distribution . . . ).
DEAD was implemented in the ISBA scheme embedded in SURFEX (Grini et al., 2006). Recently this emission parameterization has been improved by Mokhtari
10
et al. (2012), in order to better account for the soil aggregate distribution.
The erodible soil fraction is related to bare and rock soil. These surface types are derived from the global dataset of land surface ECOCLIMAP at 1 km resolution which combines the global land cover maps at 1/120◦ resolution and satellite information
(Masson et al., 2003). Two hundred and fifteen ecosystems were obtained by
com-15
bining existing land cover and climate maps, in addition to using Advanced Very High Resolution Radiometer (AVHRR) satellite data. Therefore, ECOCLIMAP is designed to satisfy both the tile approach of SURFEX-each grid box is made of four adjacent surfaces for nature, urban areas, sea or ocean and lake-and the vegetation types of ISBA. The mass fractions of clay, sand and silt are provided from the global 10 km
20
FAO soil datasets. Soil texture is classified following the USDA (1999) (United States Department of Agriculture) textural classification with 12 basic textural definitions. Soil aggregate size distributions are defined for each texture.
For the size distribution of the emitted dust, we adopted Crumeyrolle et al.’s proposal (2011) based on the measurements taken during the AMMA Special Observation
Pe-25
ACPD
15, 5751–5799, 2015Dust aerosol and optical properties over North Africa
M. Mokhtari et al.
Title Page
Abstract Introduction
Conclusions References
Tables Figures
◭ ◮
◭ ◮
Back Close
Full Screen / Esc
Printer-friendly Version Interactive Discussion
Discussion
P
a
per
|
Discussion
P
a
per
|
Discussion
P
a
per
|
Discussion
P
a
per
|
2.3 2006–2010 simulations
The ALADIN model is coupled to the ARPEGE global model, which provides the ini-tial and boundary conditions every 3 h. To simulate the 2006–2010 period, successive simulations of two consecutive days (48 h) are simulated, starting from 1 January 2006 through 31 December 2010. The final term of each simulation is used as the initial
con-5
dition for the dust concentration of the next simulation. The numerical integrations are performed over a fairly large domain (4◦S–40◦N, 40◦W–50◦E) including all dust
emis-sion sources in the Sahara and those of the Western part of the Arabian Desert. This choice minimizes the prediction errors in dust concentrations due to lateral coupling, as no dust modelling is included in the coupling global model. Here, care was taken
10
to ensure that no dust emission zone was present outside and near the limited area domain. The post-processing domain was intentionally decreased in order to facilitate the exploitation of results; it extends from 2◦N to 38◦N and from 39◦W to 45◦E. The
horizontal resolution is 20 km×20 km with 60 vertical levels; from the surface to 67 km. The time step is 600 s.
15
3 Results
3.1 Dust emissions
3.1.1 Annual dust emissions and Interannual variability
Figure 1 shows the annual mean dust emissions over the Sahara averaged from 2006 to 2010 simulated by ALADIN coupled on-line with the ORILAM aerosol scheme and
20
the DEAD version of Mokhtari et al. (2012). The major dust sources are located over the Bodélé Depression with an annual mean dust flux around 2 kg m−2year−1, the centre of Niger (400–600 g m−2year−1), the oriental and occidental great Erg in Algeria (200–
ACPD
15, 5751–5799, 2015Dust aerosol and optical properties over North Africa
M. Mokhtari et al.
Title Page
Abstract Introduction
Conclusions References
Tables Figures
◭ ◮
◭ ◮
Back Close
Full Screen / Esc
Printer-friendly Version Interactive Discussion
Discussion
P
a
per
|
Discussion
P
a
per
|
Discussion
P
a
per
|
Discussion
P
a
per
|
400 g m−2year−1), the southeastern region of Libya and Sudan (100–200 g m−2year−1),
and along the border between Egypt and Libya (100–200 g m−2year−1).
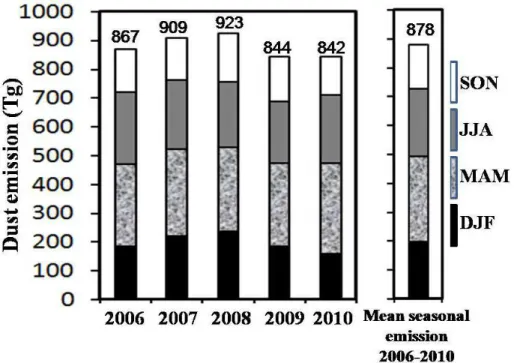
The averaged annual dust emission over the whole Sahara and for the 5 years of simulation is 878 Tg year−1. Annual dust emissions vary from 843 Tg in 2010 to 924 Tg
in 2008. Table 2 compares the annual mean dust flux in this study and in other recent
5
global and regional dust model studies. Important differences in the annual mean dust flux can be observed between these studies. The largest value of the annual mean dust flux is simulated by Ginoux et al. (2004) and is equal to 1430 Tg year−1, which is twice as large as the value simulated by Marticorena and Bergametti (1996) (665– 586 Tg year−1). Our estimation lies between that obtained by Ginoux et al. (2004) and
10
that of Marticorena and Bergametti (1996), and is in good agreement with the value ob-tained by d’Almeida (1986), Callot et al. (2000), Laurent et al. (2008) and Zender et al. (2003). Over the Bodélé depression (10 800 km2), the annual mean dust emission is estimated at 21.4 Tg year−1. Although this region represents only 0.13 % of the Sahara, its contribution is around 2.4 % of the annual mean dust flux of the whole Sahara. This
15
finding is in good agreement with previous studies of this region (Zender et al., 2003). Based on field observations, Todd et al. (2007) suggest that the emission of aerosols minerals from the Bodélé Depression is 1.18±0.45 Tg day−1during a substantial dust
event.
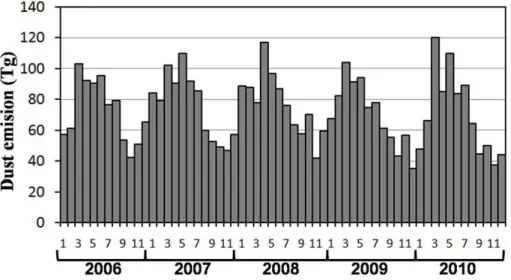
Figure 2 presents the monthly emissions in Tg from January 2006 to
Decem-20
ber 2010. This figure shows that the largest monthly emissions are generally obtained in spring. During the 5 year simulated period, a maximum (120 Tg month−1) is simulated
in March 2010 and the minimum (35 Tg month−1) is obtained in December 2009.
3.1.2 Seasonality of the dust emissions
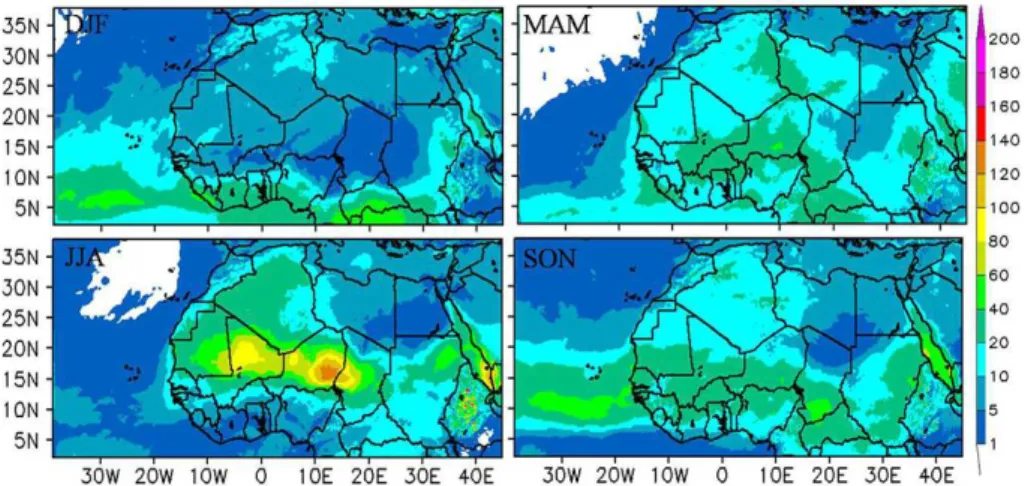
Figure 3 shows the seasonal mean dust emissions from 2006 to 2010. The seasonal
25
ACPD
15, 5751–5799, 2015Dust aerosol and optical properties over North Africa
M. Mokhtari et al.
Title Page
Abstract Introduction
Conclusions References
Tables Figures
◭ ◮
◭ ◮
Back Close
Full Screen / Esc
Printer-friendly Version Interactive Discussion
Discussion
P
a
per
|
Discussion
P
a
per
|
Discussion
P
a
per
|
Discussion
P
a
per
|
in autumn, except over the Bodélé region. In summer, dust emission remains strong in the Western Sahara, while it decreases in the Eastern Sahara. In winter, dust emis-sion sources are mainly located in the Bodélé depresemis-sion and the centre of Niger. These regions are indeed frequently exposed to the Harmattan wind during the dry monsoon season, which is a favourable configuration for dust emission. In spring and
5
autumn, dust emission remains significant over the Bodélé Depression, but the dust emission activity decreases in summer. This seasonality is in agreement with the six-year simulation by Laurent et al. (2008) (1996–2001) and the simulation by Schmechtig et al. (2011) for 2006.
Figure 4 presents the seasonal mean and interseasonal dust emissions over the
10
Sahara during the 5 year period. Our simulations estimate the seasonal mean dust emissions in spring at around 296 Tg. In summer, the seasonal emissions remain sig-nificant, at about 233 Tg. In winter and autumn, our estimations are 196 and 150 Tg, respectively. This seasonality is consistent with that obtained by Tanaka and Chiba (2005) for the period 1979–2003 over North Africa. Tanaka and Chiba (2005) estimate
15
the largest emission in spring, which is similar to our results, but with a value greater than in our study using ALADIN (500 Tg). For the other seasons-winter, summer and autumn-our modelled estimations are very similar to those simulated by Tanaka and Chiba (2005).
3.2 Dry deposition 20
The annual dry deposition of mineral dust over North Africa is another estimated prod-uct of the ALADIN integrations. Generally, regions of dry deposition are located near dust emission regions, as most of the emitted dust mass is of the coarse type, which settles quickly. Thus, in the Bodélé Depression, the dust mass subject to dry deposition is at its maximum (400–800 g m−2year−1), and corresponds to around half the annual
25
ACPD
15, 5751–5799, 2015Dust aerosol and optical properties over North Africa
M. Mokhtari et al.
Title Page
Abstract Introduction
Conclusions References
Tables Figures
◭ ◮
◭ ◮
Back Close
Full Screen / Esc
Printer-friendly Version Interactive Discussion
Discussion
P
a
per
|
Discussion
P
a
per
|
Discussion
P
a
per
|
Discussion
P
a
per
|
come in second, with dry deposition values between 100–300 g m−2year−1. The
moun-tainous and rocky deserts have a dry deposition ranging from 40–100 g m−2year−1. The seasonal mean dry deposition flux is shown in Fig. 5. The southern boundary of the dry deposition area is modulated by the position of the Inter Tropical Convergence Zone (ITCZ). In winter, the maximum of the seasonal dust deposition flux is located
5
at the Bodélé Depression and Southern Niger, with a value reaching 200 g m−2. The
geographical extension of the dry deposition areas is very large, especially towards the south and the west of the Sahara, which are the main areas of dust transport (Swap et al., 1992; Kaufman et al., 2005). The area of dust deposition of more than 10 g m−2
extends southward to about 5◦N and covers the subtropical Atlantic. In spring, the 10
mean seasonal dust deposition flux is high over the great Eastern and Western Erg in Algeria (150 g m−2), but decreases over the Bodélé Depression and Niger. In this
season, the southern limit of the extension of the mean seasonal dry deposition area (>10 g m−2) is at 10◦N. In summer, this limit is located around 15◦N, in connection with the establishment of the West African monsoon and the migration of the ITCZ towards
15
the north. This season is characterized by high precipitation over West Africa, which is very efficient at suppressing dust emission and generates significant washout. In autumn, in conjunction with the decrease of the dust emission activity over the Sahara, the mean seasonal dust deposition decreases, except in the Bodélé Depression.
3.3 Wet deposition 20
In this section, we show that the use of a three-dimensional NWP model such as AL-ADIN significantly improves the climatology of wet deposition of dust aerosols. Indeed, the model provides a representation of large-scale and mesoscale precipitating pro-cesses, with a spatial and temporal resolution and operational-like calibration of the schemes, which provides insight into regional and seasonal aspects of wet deposition.
25
ar-ACPD
15, 5751–5799, 2015Dust aerosol and optical properties over North Africa
M. Mokhtari et al.
Title Page
Abstract Introduction
Conclusions References
Tables Figures
◭ ◮
◭ ◮
Back Close
Full Screen / Esc
Printer-friendly Version Interactive Discussion
Discussion
P
a
per
|
Discussion
P
a
per
|
Discussion
P
a
per
|
Discussion
P
a
per
|
eas depends mainly on the distribution of large-scale and convective precipitations and the direction of dust plume transport. In winter, during the dry West African monsoon season, the mean wet deposition fluxes simulated by ALADIN do not exceed 10 g m−2 in the Sahara and Sahelian regions. In contrast, wet deposition is very active (20 to 60 g m−2) in the band from 0 to 10◦N over the gulf of Guinea and the Atlantic Ocean. 5
In spring, the highest mean wet deposition flux is observed over the south of Niger, with values exceeding 40 g m−2. Summer is the season of the wet African monsoon, characterized by large convective systems over the Sahelian regions. These systems play a key role in the wet deposition of mineral dust aerosols. Since these convec-tive systems produce aerosols in the gust front, the associated aerosols are to a large
10
extent washed out by precipitation (Flamant et al., 2007; Tulet et al., 2010). As a conse-quence, in our simulation, ALADIN simulates the maximum wet deposition in the band from 15 to 20◦N. This band corresponds to western Chad, central Niger, Mali and Mau-ritania, with average values of 60–140 g m−2. Autumn is characterized by the turning of
the African monsoon and the southward displacement of the ITCZ, in conjunction with
15
a decrease in precipitation and wet deposition over the Sahelian region. We note that, beyond 10◦N, wet deposition processes are more e
fficient than dry deposition.
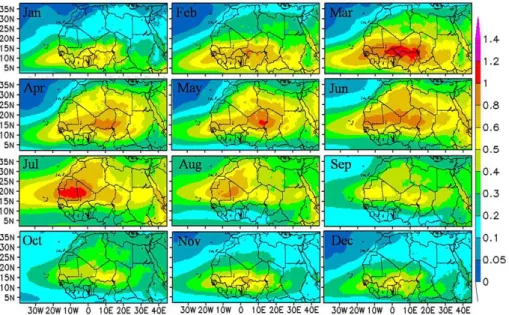
3.4 Monthly variation of aerosol optical thickness
Figure 7 shows the monthly aerosol optical thickness averaged from 2006 through 2010 over North Africa. The monthly variation is characterized by two maxima of AOT
20
exceeding 1.2. The first maximum is simulated in March and is located over the Sa-helian region in West Africa. This maximum is correlated with the high dust emissions observed in the Bodélé depression and the centre of Niger. The second maximum is simulated in July and is located over Mauritania and Mali. This maximum is related to the appearance of the heat low in these regions and to the northward movement of the
25
ACPD
15, 5751–5799, 2015Dust aerosol and optical properties over North Africa
M. Mokhtari et al.
Title Page
Abstract Introduction
Conclusions References
Tables Figures
◭ ◮
◭ ◮
Back Close
Full Screen / Esc
Printer-friendly Version Interactive Discussion
Discussion
P
a
per
|
Discussion
P
a
per
|
Discussion
P
a
per
|
Discussion
P
a
per
|
dust are significant in spring and summer, with a monthly peak of 0.5 in July. Note that, using both satellites and a regional chemistry model, Nabat et al. (2013) found a value of 0.3 of AOT for these regions with a peak in June.
In terms of extension, the spatial distribution of AOTs follows the preferred dust trans-port direction in North Africa. The large values of AOT (0.6 to 1.2) are located in the
5
south of the domain, between 5 and 20◦N of latitude, from December to March. In con-trast, beyond 20◦N of latitude, the AOTs do not exceed 0.4 for this period. From April to August, the regions with large AOTs (0.6 to 1.2) follow the northward displacement of the ITCZ. Accordingly, in the ALADIN simulation, these regions extend fairly far north (>10◦N), covering major parts of the Western Sahara and the Sahelian regions. In
10
addition, a band of high AOT (0.4 to 0.8), associated with the westward transport of dust aerosols towards the Atlantic Ocean, is simulated between 10 and 25◦N. From September to November the dust aerosol activity decreases and the regions of high AOT (0.6 to 0.8) are localised to only part of the Sahelian region and the Bodélé De-pression. The spatial distribution of AOT simulated by ALADIN is well correlated with
15
the monthly average of the AAI (Absorbing Aerosol Index) derived from TOMS data, found by Engelstaedter et al. (2006) for the 1980–1992 period, especially for May, June, July and August. However, noticeable differences are observed between AOT and AAI fields in winter, especially for the month of March, which corresponds to a minimum of AAI and a maximum of AOT.
20
3.5 Monthly variation of extinction coefficients
The vertical distribution of aerosols in the troposphere is important for assessing their effects on climate, and is a key parameter in the objective evaluation of radiative forc-ing (Li et al., 2005; Kinne et al., 2006; Zhu et al., 2007). Meloni et al. (2005) found that the intensity of shortwave radiative forcing at the top of the atmosphere is strongly
25
ACPD
15, 5751–5799, 2015Dust aerosol and optical properties over North Africa
M. Mokhtari et al.
Title Page
Abstract Introduction
Conclusions References
Tables Figures
◭ ◮
◭ ◮
Back Close
Full Screen / Esc
Printer-friendly Version Interactive Discussion
Discussion
P
a
per
|
Discussion
P
a
per
|
Discussion
P
a
per
|
Discussion
P
a
per
|
for the vertical coordinate. The vertical distribution is represented by the vertical cross section of the extinction coefficients averaged longitudinally from 30◦W to 40◦E and
from 2006 to 2010 (Fig. 8). The maximum of the extinction coefficient is simulated in January and February and reaches 0.36 km−1. This maximum is located in the lowest layer (<100 m) between 12 and 17◦N with a vertical inclination toward the south. The 5
southward inclination observed above 1.5 km of altitude is due to the location of dust aerosols in the Saharan Atmospheric Layer (SAL) and their transport by the Harmat-tan wind above the monsoon flux. This vertical structure is mainly observed in winter during the dry West African monsoon. In this season, a strong gradient of extinction coefficients can be observed at the surface around the ITCZ (5–15◦N), with values
10
varying from 0.09 to 0.36 km−1. In altitude, over the monsoon flux (1.5 to 3 km), the
extinction coefficients are relatively large (0.09 km−1). The annual minimum of the max-imum values of extinction are simulated in September and October and do not exceed 0.12 km−1, with a vertical extension limited to below 4 km. In summer, the onset of the
West African monsoon and the northward movement of the ITCZ confine the transport
15
of dust to the south. Instead, dust is mixed and transported vertically by convective systems to high altitudes (6 km). At the surface, the limit of the southern extension of the extinction coefficient (>0.06 km−1) marks the position of the ITCZ. This limit varies
between 2◦N in winter and 15◦N in summer.
4 Comparison and evaluation 20
4.1 Comparison of simulation outputs to Aqua-MODIS observations
We use the Aqua-MODIS products (Tanré et al., 1997; Levy et al., 2007) to evaluate the AOTs simulated by ALADIN. This instrument is a multi-spectral radiometer, designed to retrieve aerosol microphysical and optical properties over ocean and land. Two prod-ucts of Aqua-MODIS are considered in this study: the MODIS Dark Target (DT) and
25
ACPD
15, 5751–5799, 2015Dust aerosol and optical properties over North Africa
M. Mokhtari et al.
Title Page
Abstract Introduction
Conclusions References
Tables Figures
◭ ◮
◭ ◮
Back Close
Full Screen / Esc
Printer-friendly Version Interactive Discussion
Discussion
P
a
per
|
Discussion
P
a
per
|
Discussion
P
a
per
|
Discussion
P
a
per
|
products provide aerosol retrieval over global oceans and most land areas with almost daily coverage. However, the Dark Target retrievals fail over bright surfaces such as the Saharan deserts due to the large values of surface reflectivity (Remer et al., 2005; Shi et al., 2013). This problem leads to large spatial gaps in the aerosol optical thickness recorded in desert regions, although these regions are affected by some of the largest
5
aerosol loadings worldwide. The Deep Blue algorithm takes advantage of this surface phenomenology by performing aerosol retrievals in the visible blue spectrum (such as the 0.47 µm spectral channel in MODIS) and by utilizing the selected aerosol model in the inversion to generate the AOT (Hsu et al., 2004, 2006; Shi et al., 2013). Thus, using both two products enables complete coverage of North Africa (ocean and land).
10
Figure 9 shows the Level-3 monthly AOTs derived from the combination of the Dark Target and Deep Blue products (MYD08_D3.051, MODIS-Aqua Ver. 5.1) at 1◦
×1◦
res-olution averaged from 2006 to 2010. The MODIS data shows important dust activity from January to August. We observe high AOT values, in excess of 0.5, over large portions of North Africa. The most important dust activity is observed in March. Two
15
maxima exceeding 1 can be identified for this month. A primary maximum is located over the gulf of Guinea, Nigeria, Benin and the region of Ouagadougou (south-west of Niger). This maximum is associated with the southward dust transport, which is very significant in this season. The secondary maximum is located in the Bodélé depression in Chad and is therefore collocated with the main area of dust emission.
20
Compared with the simulated AOTs (Fig. 7), ALADIN reproduces the monthly hor-izontal distribution of AOT well. However, the model gives larger values of AOT than MODIS, especially in the Sahelian region, central Mauritania and Mali, from March to July. Still, in the Bodélé Depression, the maximum AOT (0.8 to 1) simulated by AL-ADIN in March is underestimated compared with that given by MODIS (1.2 to 1.4)
25
ACPD
15, 5751–5799, 2015Dust aerosol and optical properties over North Africa
M. Mokhtari et al.
Title Page
Abstract Introduction
Conclusions References
Tables Figures
◭ ◮
◭ ◮
Back Close
Full Screen / Esc
Printer-friendly Version Interactive Discussion
Discussion
P
a
per
|
Discussion
P
a
per
|
Discussion
P
a
per
|
Discussion
P
a
per
|
the MODIS monthly mean product due to the poor representation of the diurnal cycle of dust is of the order of 0.1, i.e. 17 %.
Over the gulf of Guinea, ALADIN underestimates the maximum AOT in March, with a value around 0.7, while the observed value from MODIS exceeds 1. Over the Mediter-ranean Sea, large values of AOT (around 0.5) observed by MODIS are obtained in April
5
near the Libyan coast, while the maxima of AOT (around 0.5) simulated by ALADIN are obtained in July and August, with a localisation in the Eastern Mediterranean. Over the Atlantic Ocean, a good agreement is obtained between ALADIN simulations and MODIS observations, in terms of both horizontal distribution and maximum values of AOT.
10
4.2 Comparison with AERONET measurements
The AOTs simulated by ALADIN have also been compared with the AERONET ob-servations available in the AMMA database and the MODIS products. Figures 10 and 11 show, respectively, the average and scatter plot of monthly optical thickness ob-served by AERONET and MODIS and simulated by ALADIN from 2006 to 2010 over
15
Banizoumbou, Cinzana, Soroa, Mbour and Capo Verde.
The large values of AOT (>0.6) measured by AERONET are observed from March to June at the sites of Banizoumbou, Cinzana and Soroa, with a maximum exceed-ing 0.8 obtained in March at Cinzana, in April at Banizoumbou and in May at Soroa (Fig. 10). Indeed, these three stations are located at the same latitude (13◦N) and they
20
mark the southern boundary of the sources of dust emission. They are affected by dust transport associated with the Harmattan wind from March to June, which explains the large AOT values in this season. The low AOTs are observed from November to January, with values around 0.35, corresponding to the low dust emission activity. In August, the AOTs are also low at Banizoumbou, Cinzana and Soroa. For this month,
25
ACPD
15, 5751–5799, 2015Dust aerosol and optical properties over North Africa
M. Mokhtari et al.
Title Page
Abstract Introduction
Conclusions References
Tables Figures
◭ ◮
◭ ◮
Back Close
Full Screen / Esc
Printer-friendly Version Interactive Discussion
Discussion
P
a
per
|
Discussion
P
a
per
|
Discussion
P
a
per
|
Discussion
P
a
per
|
datasets, but there are noticeable differences in terms of quantification. For instance, over Banizoumbou, MODIS observations are slightly larger than AERONET observa-tions for all months, with a maximum of about 1 observed in April. This overestimation is particularly perceptible in the wet monsoon season (July and August). For this site, the MODIS data provides a good correlation coefficient (0.864) (Fig. 11). For ALADIN,
5
the maximum of AOT is given in March with a rather large value of about 1.2. ALADIN overestimates the AOTs from November to March, and underestimates them from April to September, except for July. For Banizoumbou, a lower correlation coefficient (0.285) is obtained with ALADIN compared with MODIS. This weak correlation is probably due to the resolution of the ALADIN model, which is believed to be too small to provide an
10
appropriate accurate representation of the surface parameters for this region.
Over Cinzana, MODIS gives two maxima of AOT reaching 0.8. The first maximum is obtained in April and the second in July. The MODIS AOTs are much larger than the AERONET and ALADIN values, from May to August. The correlation coefficient obtained for MODIS for Cinzana is about 0.549. In contrast, ALADIN simulates the
15
maximum of AOT in March (∼1) with a correlation coefficient of about 0.418.
Over Soroa, the maximum AOT (∼0.8) is observed by MODIS in July during the wet
West African monsoon. MODIS overestimates the AOTs from July to March and under-estimates them in May and June compared to AERONET. The correlation coefficient of MODIS is around 0.128. For Soroa, the AOTs simulated by ALADIN are larger than 0.5
20
from January to July, with a maximum of about 1.1 in March. The correlation coefficient obtained for ALADIN is around 0.255.
At Mbour, the maximum AOT measured by AERONET is obtained in June and is around 0.7. For this site, MODIS values of AOT are larger than AERONET values from January to August. In July, the AOTs observed by MODIS (0.9) are twice as large as
25
ACPD
15, 5751–5799, 2015Dust aerosol and optical properties over North Africa
M. Mokhtari et al.
Title Page
Abstract Introduction
Conclusions References
Tables Figures
◭ ◮
◭ ◮
Back Close
Full Screen / Esc
Printer-friendly Version Interactive Discussion
Discussion
P
a
per
|
Discussion
P
a
per
|
Discussion
P
a
per
|
Discussion
P
a
per
|
Over Capo Verde, the averaged monthly AOTs observed by AERONET and MODIS, and simulated by ALADIN, are in good agreement, except in July, where ALADIN over-estimates the AOTs. The maximum AOTs observed and simulated are obtained in July and are equal to 0.5 for AERONET and MODIS and 0.8 for ALADIN. For this site the correlation coefficients observed for MODIS and ALADIN are 0.603 and 0.584,
respec-5
tively.
4.3 Comparison to surface dust concentration measurements
In this section we use the measured dust mass concentration PM10(Particulate Matter concentration, particles with diameter of 10 µm or less) from the Sahelian Dust Transect (SDT) (Marticorena et al., 2010) to evaluate the simulated surface dust concentration
10
from 2006 to 2010. Note that PM10 measurements refer to particulate matter which passes through a size-selective inlet with a 50 % efficiency cutoff at 10 µm aerody-namic diameter (Marticorena et al., 2010). Therefore, for the simulated concentrations, we consider only the particles smaller than 10 µm in order to perform a consistent com-parison with the observations. Note that the simulated mass concentration of particles
15
of less than 10 µm in diameter represents 40.124 % of the total mass.
The SDT is composed of three stations, namely Banizoumbou, Cinzana and M’bour. Figure 12 shows the monthly mean of the daily median value of measured and sim-ulated surface concentrations in Banizoumbou, Cinzana and M’bour. The analysis of this figure shows that the temporal pattern of simulated and observed concentrations
20
is similar for the Cinzana and Mbour sites, with high concentrations from November to May. In summer, the simulated and observed surface concentrations are low for these two stations. In contrast, noticeable differences are seen from April to June at Bani-zoumbou. For this site, the simulated surface concentration decreases while the PM10 concentration remains high.
25
ACPD
15, 5751–5799, 2015Dust aerosol and optical properties over North Africa
M. Mokhtari et al.
Title Page
Abstract Introduction
Conclusions References
Tables Figures
◭ ◮
◭ ◮
Back Close
Full Screen / Esc
Printer-friendly Version Interactive Discussion
Discussion
P
a
per
|
Discussion
P
a
per
|
Discussion
P
a
per
|
Discussion
P
a
per
|
in good agreement with the maximum PM10observation (370 µg m−3) registered during
the same period. The minimum simulated surface concentration (31 µg m−3) is obtained in September but the minimum PM10concentration (21 µg m−3) is observed in August.
Over Cinzana, a good correlation is obtained between the monthly simulated surface concentration and the PM10 observation, especially from March to October. The
maxi-5
mum simulated surface concentration and observation is obtained in Mars (278 µg m−3
for ALADIN and 257 µg m−3for PM10). The minimum surface concentration (25 µg m−3) is simulated in September, and the minimum PM10 concentration (15 µg m−3) is
ob-served in August. Over Mbour, the monthly simulated surface concentrations are larger than the observations over all months except in August. ALADIN simulates the
max-10
imum concentration in January (299 µg m−3) but the maximum PM
10 is observed in
March (202 µg m−3). The minimum surface concentration (23 µg m−3) is simulated in
August and the minimum PM10 concentration (39 µg m−3) is observed in September. It is worth mentioning that the dust surface concentration is strongly linked with the surface dust emission activity. Thus, the largest values for surface concentrations are
15
registered in spring and winter, which correspond to the period of strong dust emission activity in the Sahelian region.
4.4 Comparison to CALIOP observations
In this section we use the CALIOP Level 2 Layer version 3.01 product (Koffi et al., 2012) over the 2007–2009 period to evaluate the ALADIN vertical distribution of dust
20
aerosols. This data was previously used in Koffi et al. (2012) to evaluate the 12 AeroCom-I (Aerosol Comparison between observations and models, phase I) models over 13 sub-continental regions. In this study, the ALADIN-CALIOP intercomparison was limited to the North Africa (NAF) and Central Africa (CAF) regions. Note that the ALADIN model domain does not completely cover these two regions. Therefore, in our
25
ACPD
15, 5751–5799, 2015Dust aerosol and optical properties over North Africa
M. Mokhtari et al.
Title Page
Abstract Introduction
Conclusions References
Tables Figures
◭ ◮
◭ ◮
Back Close
Full Screen / Esc
Printer-friendly Version Interactive Discussion
Discussion
P
a
per
|
Discussion
P
a
per
|
Discussion
P
a
per
|
Discussion
P
a
per
|
defined by Koffiet al. (2012) are used: (0–15◦N; 18◦W–60◦E) for CAF and (15–35◦N;
18◦W–60◦E) for NAF. The seasonal dust aerosol mean extinction profiles from CALIOP
observations (at 532) from January 2007 to December 2009 over these two regions are available at http://aerocom.met.no/download/CALIOP_BENCHMARK_KOFFI2012/.
Following Koffi at al. (2012), we calculate the mean extinction height Zα over the
5
lowest 10 km of the atmosphere in order to assess ALADIN’s ability to reproduce the mean vertical distribution of dust aerosols over CAF and NAF. The following formula is used for computingZα:
Zα=
n
P
i=1
bext,i·Zi
n
P
i=1 bext,i
(1)
Withbext,i the aerosol extinction coefficient (km−1) at leveli, andZi the altitude (km) of
10
leveli. The sums apply to the first 10 km of the atmosphere.
Figure 13 shows the CALIOP and ALADIN mean seasonal extinction coefficient pro-files for NAF. The analysis of the CALIOP measurements allows the seasonal variability of the dust aerosols profile over NAF to be assessed. In winter, large values for dust aerosol extinction coefficients are observed between the ground and 2 km of height,
15
which lead to values ofZαof about 1.23 km. In spring and summer, the vertical mixing
and the activity of sandstorms are at their maximum. Thus, in summer, Zα (2.44 km) is twice as large as in winter. In autumn, the decrease in dust activity is reflected by a value ofZα equal to about 1.85 km.
This seasonality also exists for the CAF region (Fig. 14). The maximum of Zα is
20
obtained in June-July-August (2.39 km), with a bimodal vertical distribution. The second peak is located at around 3.5 km of height. Koffiet al. (2012) explain this feature by the long-range transport of mineral dust from the Sahara and Sahel regions and the cross-hemispheric transport of biomass burning products from South Africa, which contribute to the aerosol load in the free troposphere.
ACPD
15, 5751–5799, 2015Dust aerosol and optical properties over North Africa
M. Mokhtari et al.
Title Page
Abstract Introduction
Conclusions References
Tables Figures
◭ ◮
◭ ◮
Back Close
Full Screen / Esc
Printer-friendly Version Interactive Discussion
Discussion
P
a
per
|
Discussion
P
a
per
|
Discussion
P
a
per
|
Discussion
P
a
per
|
Over the NAF region, the ALADIN model reproduces both the shape and the sea-sonality of the extinction coefficient profiles rather well. Note that in spring, ALADIN overestimates the extinction coefficient in the first 2 km. At the surface, ALADIN sim-ulates a peak of about 0.18 km−1, while the value measured by CALIOP does not exceed 0.11 km−1. Above 6 km of altitude, ALADIN overestimates the extinction coe
ffi
-5
cient for all seasons. ALADIN underestimatesZα, over all seasons in the NAF region, with a maximum ofZα (1.75 km) simulated in summer, in accordance with the CALIOP data.
Over the CAF region, significant differences are observed in the shape of the CALIOP and ALADIN extinction profiles. In winter, large extinction coefficient values
10
(>0.2 km−1) are simulated by ALADIN in the first 1 km. This is in connection with the
overestimation of surface dust concentration by ALADIN in this region. Note that the three measurement sites of dust concentration investigated in Sect. 4.3 (Banizoumbou, Cinzana and Mbour) are located in this region. In summer and autumn, ALADIN greatly underestimates the extinction coefficient in the first 5 km. The reason here is that, in
15
addition to dust aerosol, the CALIOP measurements are affected by other aerosols, such as biomass-burning products, which contribute to an increase of the extinction coefficient. Note that the Zα values simulated by ALADIN are underestimated for all seasons over the CAF region.
5 Conclusions 20
This study focuses on the elaboration and interpretation of a dust aerosol climatology for North Africa using an operational numerical weather prediction model. The use of a NWP model for this type of study is novel and allows a better representation of the coupled processes between the surface and the atmosphere (emission by density cur-rents, topographic forcing), and the mesoscale processes. The simulated climatology
25
de-ACPD
15, 5751–5799, 2015Dust aerosol and optical properties over North Africa
M. Mokhtari et al.
Title Page
Abstract Introduction
Conclusions References
Tables Figures
◭ ◮
◭ ◮
Back Close
Full Screen / Esc
Printer-friendly Version Interactive Discussion
Discussion
P
a
per
|
Discussion
P
a
per
|
Discussion
P
a
per
|
Discussion
P
a
per
|
position, and provides a three-dimensional distribution of monthly dust aerosol optical properties over this region.
Results of five-year simulations for the 2006–2010 period are presented. The annual dust emission in North Africa estimated by ALADIN is about 878 Tg year−1. The Bodélé depression appears as the most important dust source region in North Africa with a
to-5
tal annual emission of 21.4 Tg year−1. Dust emission over North Africa is characterized by strong seasonal variability. The emission is important in spring (296 Tg) and summer (233 Tg), and drops in winter and autumn to about 196 and 150 Tg, respectively.
The principal dry deposition areas are located near dust source emissions. Thus, in the Bodélé Depression, the mass of dry dust deposition corresponds to about half
10
of the annual dust emission (400–800 g m−2year−1). The southern limit of the dry
de-position area is modulated by the de-position of the ITCZ. In winter, the extension of the dry deposition areas is very significant, especially towards the south and west of Sa-hara. In summer, the southern limit of the area of dust deposition is located around 15◦N, in connection with the establishment of the West African monsoon. The major 15
wet deposition regions depend mainly on the distribution of large scale and convective precipitation and the direction of dust plume transport. They are located in the southern part of North Africa (Sahel, Gulf of Guinea, Central Africa and the Atlantic Ocean). In winter, the wet deposition is very active (10 to 60 g m−2) in the band from 2 to 10◦N over the Gulf of Guinea and the Atlantic Ocean. In spring, wet deposition does not
ex-20
ceed 40 g m−2 over all of North Africa. In summer, wet deposition is very active, with
a maximum simulated over the Bodélé depression and southern Niger (140 g m−2). These findings are consistent with the existence of large convective systems over the Sahelian regions in this season.
The simulated seasonal cycle of the AOT is in good agreement with MODIS
obser-25
ACPD
15, 5751–5799, 2015Dust aerosol and optical properties over North Africa
M. Mokhtari et al.
Title Page
Abstract Introduction
Conclusions References
Tables Figures
◭ ◮
◭ ◮
Back Close
Full Screen / Esc
Printer-friendly Version Interactive Discussion
Discussion
P
a
per
|
Discussion
P
a
per
|
Discussion
P
a
per
|
Discussion
P
a
per
|
in July. Low AOTs are simulated in autumn, again in accordance with MODIS observa-tions.
The vertical distribution of dust aerosol is characterized by a large concentration of dust aerosol at low levels between 0 to 100 m. The maximum of the extinction coeffi -cient is simulated in March.
5
The comparison of the simulated AOTs with ground AERONET measurements gen-erally shows a good correlation at a remote site (Capo Verde). However, an overestima-tion of AOTs is observed in winter at sites located in the vicinity of dust source regions (Banizoumbou, Cinzana and Soroa). This overestimation suggests that the content of atmospheric dust is also overestimated in these source areas in winter. There are two
10
possible reasons here: either the ALADIN model overestimates dust emission, or it un-derestimates the removal processes. In the first case, a possibly overly large emission may be due to an overly low threshold friction velocity simulated by the ALADIN model, so that the mobilization occurs at an overly low wind speed.
ALADIN simulates the temporal pattern of monthly surface concentrations well, but
15
overestimates them from late autumn to late winter at all sites. As for the extinction coefficients, ALADIN reproduces both the shape and the seasonal variability of ex-tinction coefficient profiles well, especially over the NAF region. In contrast, significant differences between the CALIOP and ALADIN extinction profiles are obtained over the CAF region. Indeed, this region is affected by salt and biomass-burning products which
20
heavily influence the extinction coefficients.
It is interesting to note that, despite the absence of any data assimilation process for dust content in ALADIN, the simulations remain overall satisfactorily correlated with observations. This result suggests that the model, whose initial and lateral boundary conditions are regularly refreshed by the global model ARPEGE, does not generate
25
ACPD
15, 5751–5799, 2015Dust aerosol and optical properties over North Africa
M. Mokhtari et al.
Title Page
Abstract Introduction
Conclusions References
Tables Figures
◭ ◮
◭ ◮
Back Close
Full Screen / Esc
Printer-friendly Version Interactive Discussion
Discussion
P
a
per
|
Discussion
P
a
per
|
Discussion
P
a
per
|
Discussion
P
a
per
|
In future, ALADIN’s ability to simulate the dust aerosol content over the Mediter-ranean Sea will be investigated. For this purpose, the model will be tested within the framework of the ChArMeX programme (http://mistrals.sedoo.fr/ChArMEx) over the Mediterranean basin and will be compared with regional climate models over this re-gion.
5
Acknowledgements. This paper is dedicated to the memory of Laurent Gomes.
Based on a French initiative, AMMA was built by an international scientific group and is currently funded by a large number of agencies, especially from France, UK, USA and Africa. It has been the beneficiary of a major financial contribution from the European Community’s Sixth Framework Research Programme. Detailed information on scientific co-ordination and
10
funding is available on the AMMA International web site http://www.amma-international.org. We also acknowledge the MODIS mission scientists and associated NASA personnel for the production of the data used in this research effort. This work was supported by the Algerian
Met Office (ONM), Météo France, Centre National de Recherches Météorologiques (CNRM)
and the French Embassy in Algeria.
15
References
Albrecht, B. A.: Aerosols, cloud microphysics, and fractional cloudiness, Science, 245, 1227– 1230, 1989.
Bagnold, R. A.: The Physics of Blown Sand and Desert Dunes, Methuen, New York, 265 pp., 1941.
20
Bechtold, P., Bazile, E., Guichard, F., Mascart, P., and Richard, E.: A mass flux convection scheme for regional and global models, Q. J. Roy. Meteor. Soc., 127, 869–886, 2001. Binkowski, F. S. and Roselle, S.: Models-3 community multiscale air quality (cmaq)
model aerosol component 1, model description, J. Geophys. Res., 108, 4183, doi:10.1029/2001JD001409, 2003.
25
Bougeault, P.: A simple parameterization of the large-scale effects of cumulus convection, Mon. Weather Rev., 113, 2108–2121, 1985.
ACPD
15, 5751–5799, 2015Dust aerosol and optical properties over North Africa
M. Mokhtari et al.
Title Page
Abstract Introduction
Conclusions References
Tables Figures
◭ ◮
◭ ◮
Back Close
Full Screen / Esc
Printer-friendly Version Interactive Discussion
Discussion
P
a
per
|
Discussion
P
a
per
|
Discussion
P
a
per
|
Discussion
P
a
per
|
Bouteloup, Y., Bouyssel, F., and Marquet, P.: Improvments of Lopez’s prognostic large scale cloud and precipitation scheme, ALADIN Newslett., 28, 66–73, 2005.
Bréon, F. M., Vermeulen, A., and Descloitres, J.: An evaluation of satellite aerosol prod-ucts against sunphotometers measurements, Remote Sens. Environ., 115, 3102–3111, doi:10.1016/j.rse.2011.06.017, 2011.
5
Brooks, N. P. and Legrand, M.: Dust variability over Northern Africa and rainfall in Sahel, in: Linking the Climate Change to Landsurface Change, Kluwer Academic Publishers, Dordecht, Netherlands, 1–25, 2000.
Bubnová, R., Hello, G., Bénard, P., and Geleyn, J. F.: Integration of the fully elastic equations cast in the hydrostatic pressure terrain following coordinate in the framework of the ALADIN
10
NWP system, Mon. Weather Rev., 123, 515–535, 1995.
Callot, Y., Marticorena, B., and Bergametti, G.: Geomorphologic approach for modelling the surface features of arid environments in a model of dust emission: application to the Sahara desert, Geodinamica Acta, 13, 245–270, 2000.
Catry, B., Geleyn, J. F., Bouyssel, F., Cedilnik, J., Brozkova, R., Derkova, M., and Mladek, R.:
15
A new sub-grid scale lift formulation in a mountain drag parametarisation scheme, Meteorol. Z., 17, 193–208, 2008.
Chepil, W. S.: Properties of soil which influence wind erosion: IV. State or dry aggregate struc-ture, Soil Sci., 72, 387–401, 1951.
Chin, M., Jacob, D. J., Gardner, G. M., Foreman-Fowler, M. S., Spiro, P. A., and Savoie, D. L.:
20
A global three-dimensional model of tropospheric sulfate, J. Geophys. Res., 101, 18667– 18690, doi:10.1029/96JD01221, 1996.
Crumeyrolle, S., Tulet, P., Gomes, L., Garcia-Carreras, L., Flamant, C., Parker, D. J., Matsuki, A., Formenti, P., and Schwarzenboeck, A.: Transport of dust particles from the Bodélé region to the monsoon layer – AMMA case study of the 9–14 June 2006 period, Atmos. Chem. Phys.,
25
11, 479–494, doi:10.5194/acp-11-479-2011, 2011.
Cuxart, J., Bougeault, P., and Redelsperger, J. L.: A turbulence scheme allowing for mesoscale and large-eddy simulations, Q. J. Roy. Meteor. Soc., 126, 1–30, 2000.
d’Almeida, G. A.: A model for Saharan dust transport, J. Clim. Appl. Meteorol., 25, 903–916, 1986.
30
ACPD
15, 5751–5799, 2015Dust aerosol and optical properties over North Africa
M. Mokhtari et al.
Title Page
Abstract Introduction
Conclusions References
Tables Figures
◭ ◮
◭ ◮
Back Close
Full Screen / Esc
Printer-friendly Version Interactive Discussion
Discussion
P
a
per
|
Discussion
P
a
per
|
Discussion
P
a
per
|
Discussion
P
a
per
|
Flamant, C., Chaboureau, J- P., Parker, D. J., Taylor, C. M., Cammas, J- P., Bock, O., Timouk, P., and Pelon, J.: Airborne observations of the impact of a convective system on the planetary boundary layer thermodynamics and aerosol distribution in the intertropical discontinuity re-gion of the West African monsoon, Q. J. Roy. Meteor. Soc., 133, 1–28, 2007.
Fouquart, Y. and Bonnel, B.: Computations of solar heating of the earth’s atmosphere: a new
5
parameterization, Beitr. Phys. Atmosph., 53, 35–62, 1980.
Ginoux, P., Prospero, J. M., Torres, O., and Chin, M.: Long-term simulation of global dust distri-bution with the GOCART model: correlation with North Atlantic Oscillation, Environ. Modell. Software, 19, 113–128, 2004.
Grini, A., Tulet, P., and Gomes, L.: Dusty weather forecasts using the MesoNH mesoscale
10
atmospheric model, J. Geophys. Res., 111, D19205, doi:10.1029/2005JD007007, 2006. Haywood, J. M., Francis, P. N., Glew, M. D., and Taylor, J. P.: Optical properties and direct
radiative effect of Saharan dust: a case study of two Saharan dust outbreaks using aircraft data, J. Geophys. Res.-Atmos., 106, 18417–18430, 2001.
Holben, B. N., Eck, T. F., Slutsker, I., Tanré, D., Buis, J. P., Setzer, A., Vermote, E., Reagan, J. A.,
15
Kaufman, Y., Nakajima, T., Lavenu, F., Jankowiak, I., and Smirnov, A.: AERONET – a feder-ated instrument network and data archive for aerosol characterization, Remote Sens. Envi-ron., 66, 1–16, doi:10.1016/S0034-4257(98)00031-5, 1998.
Houghton, J., Ding, Y., Griggs, D. J., Noguer, M., Vander Linden, P. J., Dai, X., Maskell, K., and Johnon, C. A.: Climate Change 2001: The Scientific Basis, Cambridge University Press, New
20
York, 2001.
Hsu, N. C., Tsay, S. C., King, M., and Herman, J. R.: Aerosol properties over bright-reflecting source regions, IEEE T. Geosci. Remote, 42, 557–569, doi:10.1109/TGRS.2004.824067, 2004.
Hsu, N. C., Tsay, S., King, M. D., and Herman, J. R.: Deep Blue Retrievals of Asian Aerosol
25
Properties During ACE-Asia, IEEE T. Geosci. Remote, 44, 3180–3195, 2006.
Intergovernmental Panel on Climate Control (IPCC): Climate Change 2007: The Physical Basis, in: Changes in Atmospheric Constituents and in Radiative Forcing, the Fourth, Assessment Report of the IPCC, edited by: Forster, P., Ramaswamy, V., Artaxo, R., Berntsen, T., Betts, R., Fahey, D. W., Haywood, J., Lean, J., Lowe, D. C., Myhre, G., Nganga, J., Prinn, R., Raga, G.,
30