Chicken Spleen in Response to
Avian Pathogenic
Escherichia coli (APEC)
Infection
Qinghua Nie1,2,3, Erin E. Sandford2, Xiquan Zhang1,3*, Lisa K. Nolan4, Susan J. Lamont2*
1Department of Animal Genetics, Breeding and Reproduction, College of Animal Science, South China Agricultural University, Guangzhou, Guangdong, China,
2Department of Animal Science, Iowa State University, Ames, Iowa, United States of America,3Guangdong Provincial Key Lab of Agro-Animal Genomics and Molecular Breeding and Key Laboratory of Chicken Genetics, Breeding and Reproduction, Ministry of Agriculture, Guangzhou, Guangdong, China,4Department of Veterinary Microbiology, College of Veterinary Medicine, Iowa State University, Ames, Iowa, United States of America
Abstract
Avian pathogenicEscherichia coli (APEC) leads to economic losses in poultry production and is also a threat to human health. The goal of this study was to characterize the chicken spleen transcriptome and to identify candidate genes for response and resistance to APEC infection using Solexa sequencing. We obtained 14422935, 14104324, and 14954692 Solexa read pairs for non-challenged (NC), challenged-mild pathology (MD), and challenged-severe pathology (SV), respectively. A total of 148197 contigs and 98461 unigenes were assembled, of which 134949 contigs and 91890 unigenes match the chicken genome. In total, 12272 annotated unigenes take part in biological processes (11664), cellular components (11927), and molecular functions (11963). Summing three specific contrasts, 13650 significantly differentially expressed unigenes were found in NC Vs. MD (6844), NC Vs. SV (7764), and MD Vs. SV (2320). Some unigenes (e.g. CD148, CD45 and LCK) were involved in crucial pathways, such as the T cell receptor (TCR) signaling pathway and microbial metabolism in diverse environments. This study facilitates understanding of the genetic architecture of the chicken spleen transcriptome, and has identified candidate genes for host response to APEC infection.
Citation:Nie Q, Sandford EE, Zhang X, Nolan LK, Lamont SJ (2012) Deep Sequencing-Based Transcriptome Analysis of Chicken Spleen in Response toAvian Pathogenic Escherichia coli (APEC)Infection. PLoS ONE 7(7): e41645. doi:10.1371/journal.pone.0041645
Editor:Zhanjiang Liu, Auburn University, United States of America
ReceivedMay 14, 2012;AcceptedJune 22, 2012;PublishedJuly 31, 2012
Copyright:ß2012 Nie et al. This is an open-access article distributed under the terms of the Creative Commons Attribution License, which permits unrestricted use, distribution, and reproduction in any medium, provided the original author and source are credited.
Funding:This research was supported by grants from the National High Technology Research and Development Program (863) of China (2011AA100301; 2010AA10A102) and the National Broiler Industry Technology System (nycytx-42-G1-04). Animal studies were supported by National Research Initiative Competitive Grant no. 2008-35604-18805 from the United States Department of Agriculture National Institute of Food and Agriculture Microbial Genome Program. The funders had no role in study design, data collection and analysis, decision to publish, or preparation of the manuscript.
Competing Interests:The authors have declared that no competing interests exist.
* E-mail: [email protected] (XZ); [email protected] (SJL)
Introduction
Avian pathogenic Escherichia coli (APEC), a gram-negative, facultative anaerobic bacterium, causes intestinal and extra-intestinal infections, septicemia, and mortality in broiler chickens [1]. The most common infectious bacterial disease in poultry, APEC-induced colibacillosis reduces growth and egg production, thereby causing significant economic losses, as well as potentially contaminating poultry products, which generatess a risk for human health [1,2]. The APEC-O1, O2, O78 serotypes of the O serogroup represent at least half of the total number of isolates [3,4], and are responsible for over 80% of human septicemia cases world wide [2]. Except for the control of environmental conditions, such as humidity and ventilation, prevention of APEC infection usually relies on antibiotic therapy or vaccine adminis-tration. However, vaccines are not fully effective against heterol-ogous APEC strains and there is consumer pressure to reduce the use of antibiotics in food animal production. Elucidating the host resistance mechanisms against APEC infection is a foundational step in developing sustainable strategies to enhance resistance to APEC through development of more effective vaccines and through genetic selection of poultry populations for enhanced innate resistance to APEC.
Until now, the major focus in study of the host:pathogen interaction with APEC has been on the bacteria itself. Some virulence factors or genes responsible for pathogenesis or invasion capacities have been discovered in various APEC strains. With two-dimensional gel electrophoresis, one differentially expressed protein of OmpA was isolated from serum and proposed to be involved in APEC resistance [5]. ExPEC adhesin I has been shown to play a significant role during APEC infection in chickens, as its deletion leads to reduced colonization ability and, moreover, complementation of the adhesin gene restored this ability [6]. By microarray investigation and mutational analysis for confirmation, some upregulated APEC genes have been identified in APEC cultured in APEC-treated chicken serum, and these genes are predicted to contribute to APEC virulence [7]. In addition, some other genes, such as APEC autotransporter adhesin A (aatA) and ibeAhave also been reported to affect APEC infection [8,9].
using an avian macrophage microarray revealed 981 differentially expressed chicken ESTs during phagocytosis ofEscherichia coli(E. coli) [11]. A similar study identified 146 common elements modulated by both APEC andM. synoviaeand exposure to APEC induced higher expression of cytokine genes and genes involved in oxidative burst than M. synoviae did [12]. Until now, very few studies at the whole transcriptome level have been reported in response to APEC infection in chicken.
Whole transcriptome shotgun sequencing or RNA-seq is an efficient and reliable technology for transcriptomic analysis so as to reveal genetic architecture, to identify sequence variation, and to quantify gene expression [13]. A variety of platforms exist for RNA-Seq, including Illumina Solexa, Roche 454, Life Technology SOLID, and others. Identification of host genetic factors resistance to APEC is of great significance for poultry breeding and production. With use of Illumina deep sequencing of APEC-challenged birds, this study aims to investigate the genetic
architecture of the spleen transcriptome, and to discover genes/ transcripts and genetic markers for resistance to APEC infection in the chicken.
Results
Illumina Draft Reads
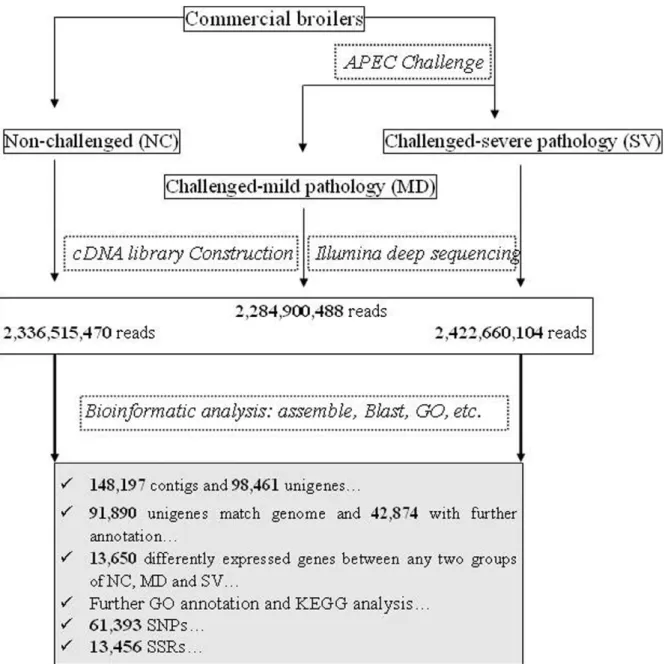
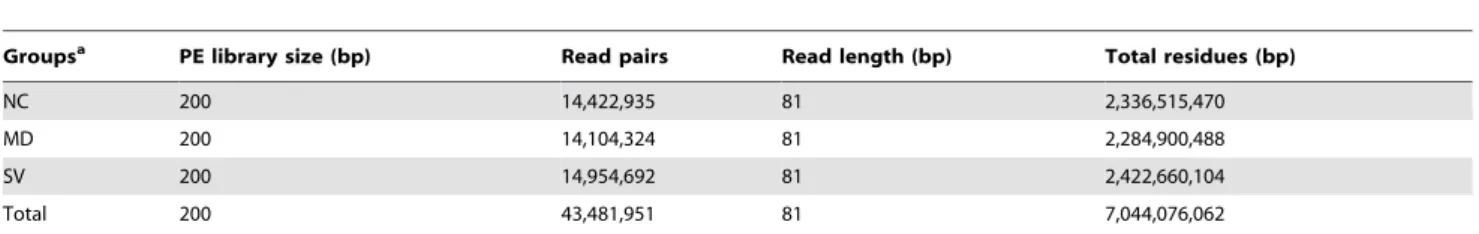
In this study, spleens of three males were used to prepare one pooled RNA sample for each group of NC, MD and SV. Three cDNA libraries were then constructed to perform Illumina deep sequencing. The schematic of Illumina deep sequencing and analysis are shown in Figure 1. We obtained 14,422,935, 14,104,324, 14,954,692 qualified Illumina read pairs for NC, MD, and SV, giving rise to total residues of 2,336,515,470, 2,284,900,488, and 2,422,660,104 bp, respectively. The overall Illumina read pairs and residues for all samples are 43,481,951 and 7,044,076,062 bp, respectively (Table 1).
Figure 1. Schematic of Illumina EST analysis.It includes sample preparation, cDNA library construction and Illumina sequencing, data analysis including assemble, blast, GO annotation, gene expression analysis, etc.
Assemble and BLAST Analysis
After assembly analysis based on all Illumina reads, we identified 148,197 contigs with total residues of 195,622,566 bp. The average length of all contigs was 1,320 bp, with the smallest sequence of 300 bp and the largest one of 19,212 bp. The sequence length distribution of contigs is indicated in Figure 2 and Table S1. Analysis of nucleotide content within all contigs showed that the content of A, T, C, G were 26.45% (51,750,884 nucleotides), 26.52% (51,887,566), 23.83% (46,619,027), and
23.19% (45,365,089), respectively, giving rise to an overall GC content of 47.02% in the chicken whole transcriptome.
Further assembly analysis showed that all contigs contributed to 98,461 unigenes. BLAST analysis with the known chicken genome sequence indicated that 134,949 contigs and 91,890 unigenes match the chicken genome. The distributions of contigs and unigenes in chicken chromosomes are described in Table 2.
Table 1.Summary of draft reads of three libraries by Illumina deep sequencing.
Groupsa PE library size (bp) Read pairs Read length (bp) Total residues (bp)
NC 200 14,422,935 81 2,336,515,470
MD 200 14,104,324 81 2,284,900,488
SV 200 14,954,692 81 2,422,660,104
Total 200 43,481,951 81 7,044,076,062
aNC, MD, and SV are three groups of non-challenged, challenged-mild pathology, and challenged-severe pathology, respectively.
doi:10.1371/journal.pone.0041645.t001
Figure 2. Sequence length distribution of contigs assembled from Illumina reads.All Illumina reads of non-challenged (NC), challenged-mild pathology (MD) and challenged-severe pathology (SV) were used in assembly analysis which gave rise to 148197 contigs. The horizontal and vertical axes show the size of contigs and log number contigs, respectively.
GO Assignments
Among 97,491 assembled unigenes, 12,272 were successfully annotated by GO assignments, belonging to one or more of the three categories: biological process, cellular component, and molecular function. Among the annotated unigenes, 11,664 are involved in various biological process categories, including cellular process (9,876 unigenes; 16.33%), metabolic process (7,808; 12.91%), biological regulation (4,969; 8.22%), regulation of biological process (4,391; 7.26%), and others (Figure 3A). Further, 11,927 unigenes are involved in cellular component categories, including cell part (11,936; 28.38%), cell (11,936; 28.38%), organelle (7,850; 18.66%), organelle part (4,309; 10.25%), macromolecular complex (2,589; 6.16%), membrane-enclosed
lumen (1,842; 4.38%), extracellular region (727; 1.73%), extracel-lular region part (669; 1.59%), and others (200; 0.48%) (Figure 3B). In addition, 11,963 unigenes are involved in molecular function catgories, including binding (10,141; 49.66%), catalytic activity (5,442; 26.65%), molecular transducer activity (1,271; 6.22%), transporter activity (860; 4.21%), enzyme regulator activity (852; 4.17%), transcription regulator activity (823; 4.03%), nucleic acid binding transcription factor activity (598; 2.93%), structural molecule activity (312; 1.53%), and others (120; 0.59%) (Figure 3C).
Differentially Expressed Genes
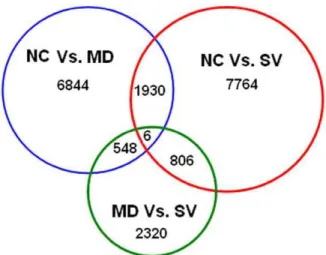
Comparison of gene expression showed that a total of 13,650 unigenes were differentially expressed between any two-way comparison of the groups of NC, MD and SV (fold changes$2 or#22; q value,0.01), including 6,844 significantly expressed isogenes between NC and MD (NC Vs. MD), 7,764 between NC and SV (NC Vs. SV), and 2,320 between MD and SV (MD Vs. SV). Moreover, 1,930 unigenes were significantly differentially expressed in both NC Vs. MD and NC Vs. SV, and 548 in NC Vs. MD and MD Vs. SV, as well as 806 in NC Vs. SV and MD Vs. SV. Only 6 unigenes were significantly differentially expressed in all of NC Vs. MD, NC Vs. SV, and MD Vs. SV. Numbers of all differentially expressed genes among the three groups of NC, MD and SV are illustrated in Figure 4. In addition, there are 531, 115 and 134 unigenes that are uniquely expressed in the group of NC, MD, and SV, respectively.
Metabolic Pathways by KEGG Analysis
KEGG enrichment analysis showed that the differentially expressed genes were involved in twenty predicted pathways at a significant level. The pathways and involved unigene numbers are metabolic pathways (514 unigenes and 252 differently expressed unigenes), purine metabolism (418; 199), thiamine metabolism (359; 181), T cell receptor signaling pathway (105; 38), biosyn-thesis of secondary metabolites (98; 53), lysine degradation (75; 42), drug metabolism-other enzymes (71; 35), tropane, piperidine and pyridine alkaloid biosynthesis (56; 30), microbial metabolism in diverse environments (29; 22), oxidative phosphorylation (28; 21), biosynthesis of phenylpropanoids (19; 13), metabolism of xenobiotics by cytochrome (18; 9), drug metabolism-cytochrome (18; 9), phenylalanine metabolism (17; 14), beta-alanine metabo-lism (15; 8), methane metabometabo-lism (13; 9), glycolysis/gluconeogen-esis (12; 10), phenylpropanoid biosynthglycolysis/gluconeogen-esis (12; 9), histidine metabolism (6; 6), and tyrosine metabolism (6; 6). All pathways and related information are described in Table 3.
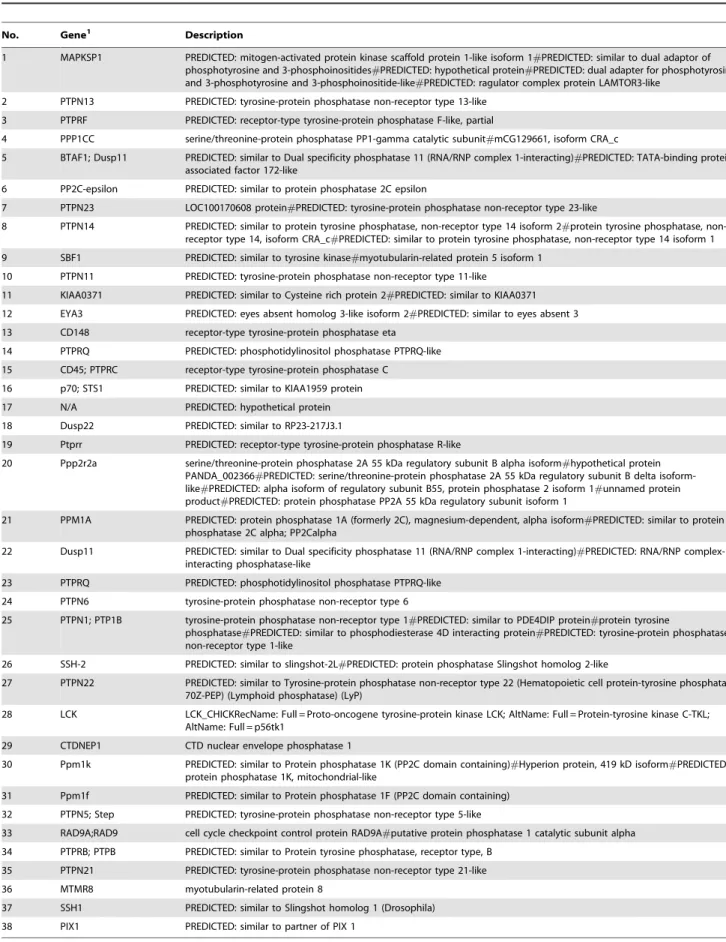
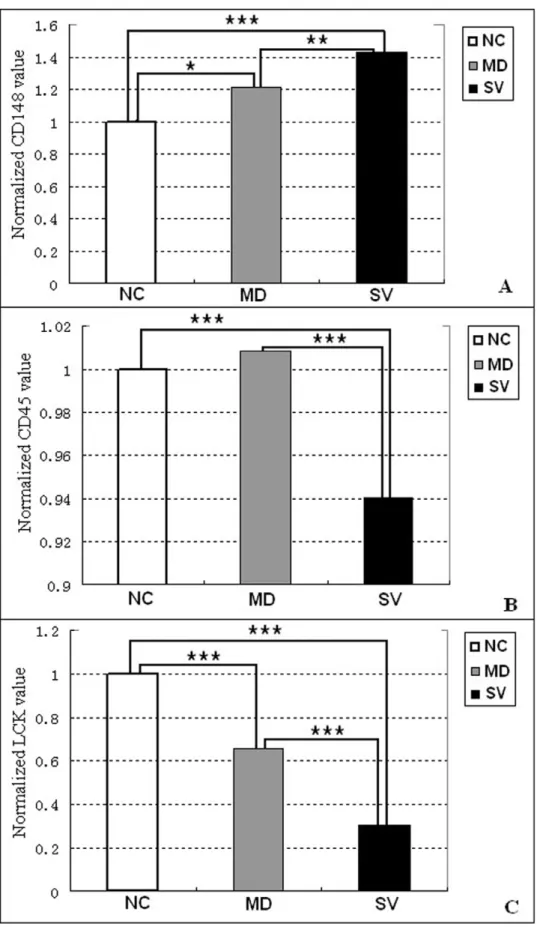
A total of 38 differentially expressed genes are involved in the T cell receptor (TCR) signaling pathway, which has important functions in animal immunity (Table 4). Three crucial genes in this pathway, CD148, CD45, and LCK, exhibited significantly different expression among NC, MD and SV groups (Table 5). The CD148 was significantly up-regulated in SV (P,0.001) and MD (P,0.05) compared with NC (Figure 5A); in contrast, LCK was significantly lower in SV (P,0.001) and MD (P,0.001) compared with NC (Figure 5C). The CD45 gene, was expressed at a significantly lower level in SV compared with NC (P,0.001) and with MD (P,0.001), but was not significantly different between NC and MD (P.0.05) (Figure 5B).
Discussion
Assembly, Blast and GO Analysis
The high-throughput sequence data obtained by Illumina deep sequencing contributes to the understanding of the genetic
Table 2.Distribution of contigs and unigenes in chicken genome. Chromosomes Counts of contigs Counts of unigenes Genome sizea
1 20,456 14,336 200,994,015
2 14,092 10,142 154,873,767
3 11,719 8,254 113,657,789
4 11,219 7,407 94,230,402
5 9,245 6,303 62,238,931
6 5,098 3,517 37,400,442
7 5,329 3,534 38,384,769
8 5,071 3,344 30,671,729
9 4,427 2,901 25,554,352
10 4,084 2,777 22,556,432
11 3,204 2,243 21,928,095
12 3,446 2,344 20,536,687
13 3,335 2,268 18,911,934
14 4,016 2,598 15,819,469
15 4,105 2,488 12,968,165
16 222 116 432,983
17 2,996 1,875 11,182,526
18 4,498 1,785 10,925,261
19 3,225 2,066 9,939,723
20 3,204 2,126 13,986,235
21 2,054 1,397 6,959,642
22 834 539 3,936,574
23 1,885 1,257 6,042,217
24 1,363 932 6,400,109
25 547 334 2,031,799
26 1,903 1,197 5,102,438
27 1,516 955 4,841,970
28 1,761 1,164 4,512,026
Z 7,304 5,334 74,602,320
MT 13 10 16,775
Total 142,171 95,543 1,031,622,801
aGenome size for each chromosome is based on the released chicken whole
genome sequence in either NCBI (ftp://ftp.ncbi.nih.gov/genomes/Gallus_gallus/ ) or ENSEMBL database (ftp://ftp.ensembl.org/pub/release-63/fasta/gallus_ gallus/dna/).
architecture of chicken transcriptome. In this study, we pooled RNA from multiple individuals to generate one sample, and subsequently performed Illumina deep sequencing. This pooling strategy was widely used in some similar studies [14,15]. As a result, we generated 148,197 contigs for 195.6 Mb residues of chicken spleen transcriptome based on 43,481,951 Illumina read pairs. Considering all contigs, the overall GC content of the transcriptome was calculated to be 47.02%, which is very close to that reported for genome-wide exons (i.e. 47.00% for GGA4q), but much higher than that of genome-wide introns (i.e. 40.00% for GGA4q) [10]. We obtained a total of 98,461 unigenes by further
assembly analysis, which was more than all predicted genes (20,000–23,000) in chicken genome [10]. We compared our unigenes with NCBI unigene database using blastn, and found that 35,056 unigenes of this study have high similarity with NCBI unigenes (19,218) using 95% identity cutoff. Compared with our unigenes, 1,103 of 19,218 NCBI unigenes are covered by 100% in length, and moreover, 4,326, 2,151 and 2,373 unigenes show the coverage of 90–99%, 80–89%, and 70–79%, respectively. Some unigenes of this study represent for the same NCBI unigene probably because some genes show low expression level in spleen and our Illumina sequences are less deep enough to generate the
Figure 3. Functional classification of chicken transcriptome.(A) GO: Biological process. (B) Cellular component. (C) GO: Molecular function. Each transcript or gene generally has multiple functions.
complete transcript by assemble analysis. Meanwhile, some unigenes of this study are longer than corresponding unigene in NCBI, i.e. 3,661 unigenes were longer than NCBI corresponding unigenes using a cutoff (less than 90% coverage for our unigenes and more than 90% coverage for NCBI unigenes). In addition,
there are 7,276 unigenes which couldn’t be mapped to chicken genome. These unmapped unigenes still belong to chicken transcriptome, and some if not all of them might be ncRNA which need to be studied in future. Alternative splicing is also very common in chicken genome, as it was previously estimated that 40260% of all genes and 74% of multiexon genes are alternatively spliced in the human genome [16]. GO annotation showed that some unigenes were involved in the three categories of biological process (11,664 unigenes), cellular component (11,927), and molecular function (11,963).
The chicken whole genome was sequenced in 2004 [10], but no major update has been published since then. Recently, the genomes of two other avian species, i.e. turkey and zebra finch, were sequenced [17,18]. The known chicken genome is 1,063 Mb in total length, of which 933 Mb were localized in 29 autosomes (GGA1-28 and 32) and sex chromosomes (Z and W), and the remaining residues were unlocalized [10,19]. In the current study, blast analysis with the chicken genome showed that most contigs and unigenes mapped to GGA1-5 and the Z chromosome, corresponding to the fact that these macrochromosomes contain a major part of the chicken genome [19]. It is logical that no contig or unigene was found for the known GGA32, because only 1,028 bp of sequences are available in this chromosome (ftp://ftp. ncbi.nih.gov/genomes/Gallus_gallus/).
Even though the chicken transcriptome of various tissues has been investigated by cDNA microarray or gene chip [7,11,12], this technology fails to detect sequence variation and to recognize new genes or transcripts. With emergence of second generation sequencing, RNA-seq is a more powerful approach for transcrip-tome analysis [13]; however, such investigations in chickens and other birds are very limited. Recently, a total of 856,675 Roche 454 reads were obtained in crows and further expression analysis
Figure 4. Differentially expressed genes that are unique or shared among three groups of NC, MD and SV.NC Vs. MD refers to the comparison between non-challenged (NC) and challenged-mild pathology (MD) groups. NC Vs. SV refers to the comparison between NC and challenged-severe pathology (SV) groups. MD Vs. SV refers to the comparison between MD and SV groups. Numbers in each section of the figure indicate the numbers of differently expressed genes in the indicatedcomparison.
doi:10.1371/journal.pone.0041645.g004
Table 3.Involvement of differentially expressed genes in predicted pathways by KEGG enrichment analysis.
No. Pathways #unigenes1 upval dpval enrichment
1 Metabolic pathways 514 (252) 1.39E260 1 yes
2 Purine metabolism 418 (199) 1.04E246 1 yes
3 Thiamine metabolism 359 (181) 9.06E247 1 yes
4 T cell receptor signaling pathway 105 (38) 1.80E206 0.999999 yes
5 Biosynthesis of secondary metabolites 98 (53) 2.15E217 1 yes
6 Lysine degradation 75 (42) 1.48E213 1 yes
7 Drug metabolism - other enzymes 71 (35) 6.33E210 1 yes
8 Tropane, piperidine and pyridine alkaloid biosynthesis 56 (30) 8.95E210 1 yes
9 Microbial metabolism in diverse environments 29 (22) 2.61E211 1 yes
10 Oxidative phosphorylation 28 (21) 2.32E211 1 yes
11 Biosynthesis of phenylpropanoids 19 (13) 1.09E206 1 yes
12 Metabolism of xenobiotics by cytochrome 18 (9) 0.001988018 0.999624 yes
13 Drug metabolism - cytochrome 18 (9) 0.001988018 0.999624 yes
14 Phenylalanine metabolism 17 (14) 4.38E208 1 yes
15 beta-Alanine metabolism 15 (8) 0.00116723 0.999828 yes
16 Methane metabolism 13 (9) 5.11E205 0.999996 yes
17 Glycolysis/Gluconeogenesis 12 (10) 2.44E206 1 yes
18 Phenylpropanoid biosynthesis 12 (9) 2.22E205 0.999999 yes
19 Histidine metabolism 6 (6) 0.00010714 1 yes
20 Tyrosine metabolism 6 (6) 0.00010714 1 yes
Table 4.Differentially expressed genes involved in the T cell receptor (TCR) signaling pathway.
No. Gene1 Description
1 MAPKSP1 PREDICTED: mitogen-activated protein kinase scaffold protein 1-like isoform 1#PREDICTED: similar to dual adaptor of phosphotyrosine and 3-phosphoinositides#PREDICTED: hypothetical protein#PREDICTED: dual adapter for phosphotyrosine and 3-phosphotyrosine and 3-phosphoinositide-like#PREDICTED: ragulator complex protein LAMTOR3-like
2 PTPN13 PREDICTED: tyrosine-protein phosphatase non-receptor type 13-like
3 PTPRF PREDICTED: receptor-type tyrosine-protein phosphatase F-like, partial
4 PPP1CC serine/threonine-protein phosphatase PP1-gamma catalytic subunit#mCG129661, isoform CRA_c
5 BTAF1; Dusp11 PREDICTED: similar to Dual specificity phosphatase 11 (RNA/RNP complex 1-interacting)#PREDICTED: TATA-binding protein-associated factor 172-like
6 PP2C-epsilon PREDICTED: similar to protein phosphatase 2C epsilon
7 PTPN23 LOC100170608 protein#PREDICTED: tyrosine-protein phosphatase non-receptor type 23-like
8 PTPN14 PREDICTED: similar to protein tyrosine phosphatase, non-receptor type 14 isoform 2#protein tyrosine phosphatase, non-receptor type 14, isoform CRA_c#PREDICTED: similar to protein tyrosine phosphatase, non-receptor type 14 isoform 1
9 SBF1 PREDICTED: similar to tyrosine kinase#myotubularin-related protein 5 isoform 1
10 PTPN11 PREDICTED: tyrosine-protein phosphatase non-receptor type 11-like
11 KIAA0371 PREDICTED: similar to Cysteine rich protein 2#PREDICTED: similar to KIAA0371
12 EYA3 PREDICTED: eyes absent homolog 3-like isoform 2#PREDICTED: similar to eyes absent 3
13 CD148 receptor-type tyrosine-protein phosphatase eta
14 PTPRQ PREDICTED: phosphotidylinositol phosphatase PTPRQ-like
15 CD45; PTPRC receptor-type tyrosine-protein phosphatase C
16 p70; STS1 PREDICTED: similar to KIAA1959 protein
17 N/A PREDICTED: hypothetical protein
18 Dusp22 PREDICTED: similar to RP23-217J3.1
19 Ptprr PREDICTED: receptor-type tyrosine-protein phosphatase R-like
20 Ppp2r2a serine/threonine-protein phosphatase 2A 55 kDa regulatory subunit B alpha isoform#hypothetical protein PANDA_002366#PREDICTED: serine/threonine-protein phosphatase 2A 55 kDa regulatory subunit B delta isoform-like#PREDICTED: alpha isoform of regulatory subunit B55, protein phosphatase 2 isoform 1#unnamed protein product#PREDICTED: protein phosphatase PP2A 55 kDa regulatory subunit isoform 1
21 PPM1A PREDICTED: protein phosphatase 1A (formerly 2C), magnesium-dependent, alpha isoform#PREDICTED: similar to protein phosphatase 2C alpha; PP2Calpha
22 Dusp11 PREDICTED: similar to Dual specificity phosphatase 11 (RNA/RNP complex 1-interacting)#PREDICTED: RNA/RNP complex-1-interacting phosphatase-like
23 PTPRQ PREDICTED: phosphotidylinositol phosphatase PTPRQ-like
24 PTPN6 tyrosine-protein phosphatase non-receptor type 6
25 PTPN1; PTP1B tyrosine-protein phosphatase non-receptor type 1#PREDICTED: similar to PDE4DIP protein#protein tyrosine
phosphatase#PREDICTED: similar to phosphodiesterase 4D interacting protein#PREDICTED: tyrosine-protein phosphatase non-receptor type 1-like
26 SSH-2 PREDICTED: similar to slingshot-2L#PREDICTED: protein phosphatase Slingshot homolog 2-like
27 PTPN22 PREDICTED: similar to Tyrosine-protein phosphatase non-receptor type 22 (Hematopoietic cell protein-tyrosine phosphatase 70Z-PEP) (Lymphoid phosphatase) (LyP)
28 LCK LCK_CHICKRecName: Full = Proto-oncogene tyrosine-protein kinase LCK; AltName: Full = Protein-tyrosine kinase C-TKL; AltName: Full = p56tk1
29 CTDNEP1 CTD nuclear envelope phosphatase 1
30 Ppm1k PREDICTED: similar to Protein phosphatase 1K (PP2C domain containing)#Hyperion protein, 419 kD isoform#PREDICTED: protein phosphatase 1K, mitochondrial-like
31 Ppm1f PREDICTED: similar to Protein phosphatase 1F (PP2C domain containing)
32 PTPN5; Step PREDICTED: tyrosine-protein phosphatase non-receptor type 5-like
33 RAD9A;RAD9 cell cycle checkpoint control protein RAD9A#putative protein phosphatase 1 catalytic subunit alpha
34 PTPRB; PTPB PREDICTED: similar to Protein tyrosine phosphatase, receptor type, B
35 PTPN21 PREDICTED: tyrosine-protein phosphatase non-receptor type 21-like
36 MTMR8 myotubularin-related protein 8
37 SSH1 PREDICTED: similar to Slingshot homolog 1 (Drosophila)
38 PIX1 PREDICTED: similar to partner of PIX 1
1Genes are named based on NCBI gene database (http://www.ncbi.nlm.nih.gov/gene/). N/A means not available.
indicated a general pattern of ineffective dosage compensation in that species [20,21]. The results of the current study as well as 148,197 Illumina reads are useful resource for further investigation on chicken transcriptome.
Differently Expressed Genes for APEC
Comparison of gene expression among the different treatment groups in the current experiment is helpful for identification of candidate genes underlying response and resistance to APEC infection in chicken. Many fewer differentially expressed unigenes were found in the MD Vs. SV contrast (2,320) compared with that of NC Vs. MD (6,844) and NC Vs. SV (7,764), revealing that there is greater difference between infected and non-infected states than between mild and severe infections. Among the differently expressed genes, there are 531, 115 and 134 unigenes that specifically express in NC, MD, and SV groups, respectively. Our previous study with cDNA microarray technology revealed 1,101 significantly expressed genes between SV and NC [22]. Because RNA-Seq can recognize new unigenes or unique isoforms present in chicken transcriptome, it should be more powerful in expression analysis. Further, KEGG prediction and GO analysis showed that these differently expressed genes were involved in a couple of major pathways. It is notable that 38 and 22 unigenes are contained in the two predicted pathways of TCR signaling pathway and microbial metabolism in diverse environments, respectively, suggesting that these unigenes are candidate genes for APEC infection in chicken.
The TCR signaling in response to antigen recognition can induce integrin to facilitate T-cell activation and thus the TCR signaling pathway has a central role in the adaptive immune response [23,24]. Within the TCR signaling pathway, CD148, CD45 and LCK are crucial genes that regulate the signal transduction throughout the entire network [25,26]. It is notable that CD45 and CD148 are specifically required forL. pneumophila phagocytosis and effector translocation [27], suggesting that they are involved in the interaction between host and bacterium. It has been proposed that CD45 is alone sufficient for TCR triggering [28] and, moreover, CD45 deficiency results in a severe combined immunodeficiency phenotype [26]. In the current study, both CD45 and LCK were significantly downregulated in SV compared to NC and MD (P,0.001), which supports the critical function of CD45 in the immune response to APEC in chicken. The expression of CD148 was upregulated in SV compared with NC (P,0.001) and MD (P,0.01) in this study. The true function of CD148 in the immune system remains unclear and there are contrary opinions regarding whether CD148 is dispensable for normal growth and development [26]. The identified unigenes in the TCR signaling pathway are candidate genes for APEC
infection in chicken, and warrant additional functional confirma-tion by further investigaconfirma-tion.
The cytokine interleukin-1 beta (IL1B) is known as a ‘‘master’’ cytokines and plays a great role on the process of anti-infectious protection. In the pathogenesis of APEC, we found that IL1B expression was significantly up-regulated in both SV and MD compared to NC, and moreover SV showed higher IL1B level than MD. It indicated that IL1B was a key cytokine responsible for the inflammation process caused by APEC infection. A similar result was also found in cow mastitis. Investigation on the global transcription of Mild priming primary mammary epithelial cells (MEC) of cow for 12 h with lipopolysaccharide (LPS) (100 ng/ml) before stimulated with heat inactivated E. coli bacteria showed that, the expression of IL1B was significantly down-regulated to inhibit inflammation [29]. Moreover, it was predicted that IL1B could directly regulate 44 differently expressed genes in the process of LPS priming-mediated modulation of the E. coli-elicited response [29].
Toll-like receptors are important factors for immune response. In this study, TLR4 was significantly up-regulated in MD (2.3 folds) and SV (2.9 folds) compared to NC, which was consensus to the study of TLR4 in human. After co-stimulation the T24 human bladder carcinoma cell with E. coli and lactobacilli, TLR4 were significantly increased in both mRNA and protein level, and inhibition of TLR4 blocked the lactobacilli potentiation of NF-kappaB [30]. TLR2 were also up regulated in MD (3.0 folds) and SV (3.3 folds) compared to NC. It was reported the TLR2 subfamily were involved in the avian response to C. perfringens challenge [31].
Compared to NC, the L-phenylalanine oxidase IL4I1 up-regulated its expression in SV and MD at 20 and 39 folds respectively. Meanwhile, IL4I1 expression in SV was about 2 fold higher than MD. It indicated that IL4I1 facilitates the pathogens of APEC. In human, it was proved that IL4I1 improve tumor growth by inhibiting the CD8(+) antitumor T-cell response [32].
Materials and Methods
Ethics Statement
The APEC challenge experiment and sample collection were approved by the Iowa State University Institutional Animal Care and Use Committee (#11-07-6460-G).
APEC Challenge Experiment and Sample Preparation A total of 240 non-vaccinated commercial male broilers at 4 weeks age were challenged with 0.1 ml APEC O1 (10E8 colony forming units) by the intra-air sac route into the left thoracic airsac. Another 120 non-vaccinated males were non-challenged
Table 5.Comparison of gene expression that differs significantly among NC, MD and SV for CD148, CD45 and LCK.
Gene Expression value1 NC vs. MD NC vs. SV MD V = vs. SV
NC MD SV Fold change2 q value3 Fold change2 q value3 Fold change2 q value3
CD148 955 991 1191 20.2113 0.0128 20.4345 1.45E210 20.2232 0.0091
CD45 19572 17645 17329 20.0084 0.7551 0.0597 0.000912 0.0681 0.0006
LCK 1465 1035 837 0.3434 1.63E-07 0.6917 1.67E227 0.3484 1.76E-05
1The expression value is based on the obtained reads within the specific gene in the three groups of [non-challenged (NC), challenged-mild pathology (MD), and
challenged-severe pathology (SV)]. 2Refers to normalized fold changes.
3The q-value was calculated according to Benjamini et al. (1995) [38].
(NC) but treated with 0.1 ml phosphate buffered saline (PBS). All detailed information on the APEC O1 strain and challenge design and procedures was previously described [22]. Birds were euthanized and necropsy was performed at one day post challenge. Based upon pathological finds a summarized lesion score, ranging from 0 to 7, was determined for each bird. Birds with lesion scores of 0–2 were regarded as mild pathology (resistant phenotype), and those scoring 4–7 as severe pathology (susceptible phenotype). Subsequently, spleens from three groups [non-challenged NC, challenged-mild pathology (MD) and challenged-severe pathology (SV)] were subjected to Illumina deep sequencing to investigate the dynamic responses of chicken transcriptome. The recorded lesions (mean6standard deviation) for NC, MD, and SV groups were 0.0060.00, 0.5060.58, and 5.2561.26, respectively.
RNA Isolation, cDNA Library Construction and Illumina Deep Sequencing
For each group, three spleens were randomly chosen and shipped on RNAlater (Applied Biosystems) to Shanghai Majorbio Bio-pharm Biotechnology Co., Ltd. (Shanghai, China), where total RNA was isolated from each spleen by trizol (Invitrogen, CA, USA). Then, samples of three individuals were pooled within each group in equal amounts to generate one mixed sample per group by RNA pooling. These three mixed RNA samples were subsequently used in cDNA library construction and Illumina deep sequencing.
Three cDNA libraries were prepared using the TruseqTM RNA sample prep Kit (Illumina, San Diego, CA USA) following the manufacturer’s instructions. First, magnetic beads containing poly-T molecules were used to purify mRNA from 10mg of total RNA. Second, the three samples were chemically fragmented and reverse transcribed into cDNA. Third, end repair and A-base tailing was performed and then Illumina adapters were ligated to the cDNA fragments.
After a gel size fractionation step to extract fragments of 300 bp, 29mL of the purified samples were amplified by 15-cycle PCR. Amplified products were validated and quantified using an Agilent 2100 bioanalyzer and the DNA 1000 Nano Chip Kit (Agilent, Technologies, Santa Clara, CA, USA). Libraries were loaded onto the channels of the flow cell at 8 pM concentration. Sequencing was performed on the Genome Analyzer IIx (Illumina, San Diego, CA, USA) by running 81+7+81 cycles using Illumina’s cBot Paired End Cluster Plate Kit and 36 Cycle Sequencing Kit according to the manufacturer’s instructions.
Bioinformatic Analysis
Reads trimming and assembly. For each of the sequencing reads, low quality bases (Sanger base quality,20) of 39ends were first trimmed using in-house perl scripts and then the sequencing
adapters were trimmed using fastx_toolkit software (http:// hannonlab.cshl.edu/fastx_toolkit/). All Illumina reads of three samples (NC, MD and SV) were assembled by Trinity software using default parameters [33].
Transcriptome Annotation
The isogenes were compared with the protein nonredundant database using BlastX with E values less than 1.061025(E values
less than 1.061025 were considered as significant) [34]. Gene
ontology (GO) terms were extracted from the best hits obtained from the BlastX against the nr database (E value #1.061026) using blast2go, and then sorted for the GO categories using in-house perl scripts [35]. Metabolic pathway analysis was performed using the Kyoto Encyclopedia of Genes and Genomes (KEGG).
Expression Analysis
Reads from each samples were mapped to isogenes using bowtie software respectively using corresponding parameters for pair ends reads and single reads [36]. The expression of each gene was calculated using the numbers of reads mapping to its isogenes. For calculating gene expression correctly, reads which aligned to different isogenes of the same gene were only counted once. Reads which have best alignments to more than one gene were not counted. Both reads from a read pair were removed if one read aligned to one gene and the other aligned to another gene. The differentially expressed genes were analyzed using the R package DEGseq and the Benjamini q-value was calculated [37,38]. Gene Ontology and KEGG pathway enrichment analysis was per-formed by using the GOseq package, which took gene length bias into account, using a 0.05 cutoff for the false discovery rate [39].
The according to et al. (1995).
Supporting Information
Table S1 Sequence length distribution of 148,197 as-sembled contigs. Frequencies refer to the percentage of the contigs with each different sequence length.
(DOC)
Acknowledgments
We thank Michael G Kaiser for his contributions to sample preparation and handling. We also thank Dr. Yi Ren (Shanghai Majorbio Bio-pharm Biotechnology Co., Ltd.) for his great contribution to the data analysis.
Author Contributions
Conceived and designed the experiments: QN XZ SL. Performed the experiments: QN. Analyzed the data: QN. Contributed reagents/ materials/analysis tools: QN ES LN. Wrote the paper: QN.
References
1. Barnes HJ, Nolan LK, Vaillancourt JP (2008) Colibacillosis. In Diseases of Poultry. 12th edition. Edited by Saif YM, Blackwell Publishing: 691–732. 2. Ron EZ (2006) Host specificity of septicemic Escherichia coli: human and avian
pathogens. Curr Opin Microbiol 9: 28–32.
3. Dho-Moulin M, Fairbrother JM (1999) Avian pathogenic Escherichia coli (APEC). Vet Res 30: 299–316.
4. Oliveira A, Sillankorva S, Quinta R, Henriques A, Sereno R, et al. (2009) Isolation and characterization of bacteriophages for avian pathogenic E. coli strains. J Appl Microbiol 106: 1919–1927.
5. Tyler CD, Lichti CF, Diekman AB, Foley SL (2008) Evaluation of differentially expressed proteins following serum exposure in avian pathogenic Escherichia coli. Avian Dis 52: 23–27.
6. Anta˜o EM, Ewers C, Gu¨rlebeck D, Preisinger R, Homeier T, et al. (2009) Signature-tagged mutagenesis in a chicken infection model leads to the identification of a novel avian pathogenic Escherichia coli fimbrial adhesin. PLoS One 4: e7796.
7. Li G, Feng Y, Kariyawasam S, Tivendale KA, Wannemuehler Y, et al. (2010) AatA is a novel autotransporter and virulence factor of avian pathogenic Escherichia coli. Infect Immun 78: 898–906.
8. Dai J, Wang S, Guerlebeck D, Laturnus C, Guenther S, et al. (2010) Suppression subtractive hybridization identifies an autotransporter adhesin gene of E. coli IMT5155 specifically associated with avian pathogenic Escherichia coli (APEC). BMC Microbiol 10: 236.
9. Wang S, Niu C, Shi Z, Xia Y, Yaqoob M, et al. (2011) Effects of ibeA deletion on virulence and biofilm formation of avian pathogenic Escherichia coli. Infect Immun 79: 279–287.
10. International Chicken Genome Sequencing Consortium (2004) Sequence and comparative analysis of the chicken genome provide unique perspectives on vertebrate evolution. Nature 432: 695–716.
12. Lavric M, Maughan MN, Bliss TW, Dohms JE, Bencina D, et al. (2008) Gene expression modulation in chicken macrophages exposed to Mycoplasma synoviae or Escherichia coli. Vet Microbiol 126: 111–121.
13. Ozsolak F, Milos PM (2011) RNA sequencing: advances, challenges and opportunities. Nat Rev Genet 12: 87–98.
14. Colaiacovo M, Subacchi A, Bagnaresi P, Lamontanara A, Cattivelli L, et al. (2010) A computational-based update on microRNAs and their targets in barley (Hordeum vulgare L.). BMC Genomics 11: 595.
15. Xie SS, Li XY, Liu T, Cao JH, Zhong Q, et al. (2011) Discovery of porcine microRNAs in multiple tissues by a Solexa deep sequencing approach. PLoS One 6: e16235.
16. Kim H, Klein R, Majewski J, Ott J (2004) Estimating rates of alternative splicing in mammals and invertebrates. Nat Genet 36: 915–916.
17. Dalloul RA, Long JA, Zimin AV, Aslam L, Beal K, et al. (2010) Multi-platform next-generation sequencing of the domestic turkey (Meleagris gallopavo): genome assembly and analysis. PLoS Biol 8: e1000475.
18. Warren WC, Clayton DF, Ellegren H, Arnold AP, Hillier LW, et al. (2010) The genome of a songbird. Nature 464: 757–762.
19. Wallis JW, Aerts J, Groenen MA, Crooijmans RP, Layman D, et al. (2004) A physical map of the chicken genome. Nature 432: 761–764.
20. Wolf JB, Bayer T, Haubold B, Schilhabel M, Rosenstiel P, et al. (2010) Nucleotide divergence vs. gene expression differentiation: comparative tran-scriptome sequencing in natural isolates from the carrion crow and its hybrid zone with the hooded crow. Mol Ecol 19 Suppl 1: 162–175.
21. Wolf JB, Bryk J (2011) General lack of global dosage compensation in ZZ/ZW systems? Broadening the perspective with RNA-seq. BMC Genomics 12: 91. 22. Sandford EE, Orr M, Balfanz E, Bowerman N, Li X, et al. (2011) Spleen
transcriptome response to infection with avian pathogenic Escherichia coli in broiler chickens. BMC Genomics 12: 469.
23. Burbach BJ, Medeiros RB, Mueller KL, Shimizu Y (2007) T-cell receptor signaling to integrins. Immunol Rev 218: 65–81.
24. Huse M (2009) The T-cell-receptor signaling network. J Cell Sci 122: 1269– 1273.
25. Lin J, Weiss A (2001) T cell receptor signaling. J Cell Sci 114: 243–244. 26. Hermiston ML, Zikherman J, Zhu JW (2009) CD45, CD148, and Lyp/Pep:
critical phosphatases regulating Src family kinase signaling networks in immune cells. Immunol Rev 228: 288–311.
27. Charpentier X, Gabay JE, Reyes M, Zhu JW, Weiss A, et al. (2009) Chemical genetics reveals bacterial and host cell functions critical for type IV effector translocation by Legionella pneumophila. PLoS Pathog 5: e1000501. 28. Choudhuri K, van der Merwe PA (2007) Molecular mechanisms involved in T
cell receptor triggering. Sem in Immunol 19: 255–261.
29. Gu¨nther J, Petzl W, Zerbe H, Schuberth HJ, Koczan D, et al. (2012) Lipopolysaccharide priming enhances expression of effectors of immune defence while decreasing expression of pro-inflammatory cytokines in mammary epithelia cells from cows. BMC Genomics 13: 17.
30. Karlsson M, Scherbak N, Reid G, Jass J (2012) Lactobacillus rhamnosus GR-1 enhances NF-kappaB activation in Escherichia coli-stimulated urinary bladder cells through TLR4. BMC Microbiol 12: 15.
31. Lu Y, Sarson AJ, Gong J, Zhou H, Zhu W, et al. (2009) Expression profiles of genes in Toll-like receptor-mediated signaling of broilers infected with Clostridium perfringens. Clin Vaccine Immunol 16: 1639–1647.
32. Lasoudris F, Cousin C, Prevost-Blondel A, Martin-Garcia N, Abd-Alsamad I, et al. (2011) IL4I1: an inhibitor of the CD8(+) antitumor T-cell response in vivo. Eur J Immunol 41: 1629–1638.
33. Grabherr MG, Haas BJ, Yassour M, Levin JZ, Thompson DA, et al. (2011) Full-length transcriptome assembly from RNA-Seq data without a reference genome. Nat Biotechnol 29: 644–652.
34. Altschul SF, Madden TL, Scha¨ffer AA, Zhang J, Zhang Z, et al. (1997) Gapped BLAST and PSI-BLAST: a new generation of protein database search programs. Nucleic Acids Res 25: 3389–402.
35. Ashburner M, Ball CA, Blake JA, Botstein D, Butler H, et al. (2000) Gene ontology: tool for the unification of biology. The Gene Ontology Consortium. Nat Genet 25: 25–29.
36. Langmead B, Trapnell C, Pop M, Salzberg SL (2009) Ultrafast and memory-efficient alignment of short DNA sequences to the human genome. Genome Biol 10: R25.
37. Wang L, Feng Z, Wang X, Wang X, Zhang X (2010) DEGseq: an R package for identifying differentially expressed genes from RNA-seq data. Bioinformatics 26: 136–138.
38. Benjamini Y, Hochberg Y (1995) Controlling the false discovery rate: a practical and powerful approach to multiple testing. J R Statist Soc B 57: 289–300. 39. Young MD, Wakefield MJ, Smyth GK, Oshlack A (2010) Gene ontology